Fun with Plot.ly
Through other entries in the HaD Prize I became aware of plot.ly, which is basically something akin to a 'cloud-based' plotting service. This sounds somewhat insane at first - of all the things I want in the cloud, plotting complicated mathematical graphs probably isn't one of them.
But when combined with distributed analysis and remote solving, this might be more reasonable than you expect. In particular if you have multiple processes running, at some point you need to collect and plot (or otherwise analyze) this data. Due to the mentioned embarrassingly parallel nature of the side-channel analysis problem (see project details for more on this), you can frequently plot the output of each analyser instance independently. Since each instance is probably headless, and you almost definitely wouldn't want to manually combine this data, using a cloud-based service actually might be easier than writing a protocol to collect the data and then plot it locally. In addition if you are using something like Amazon EC2 anyway, using plot.ly means you would be communicating from Amazon's network directly to plot.ly, which is probably going to be much faster than my internet connection downloading data from all the independent nodes!
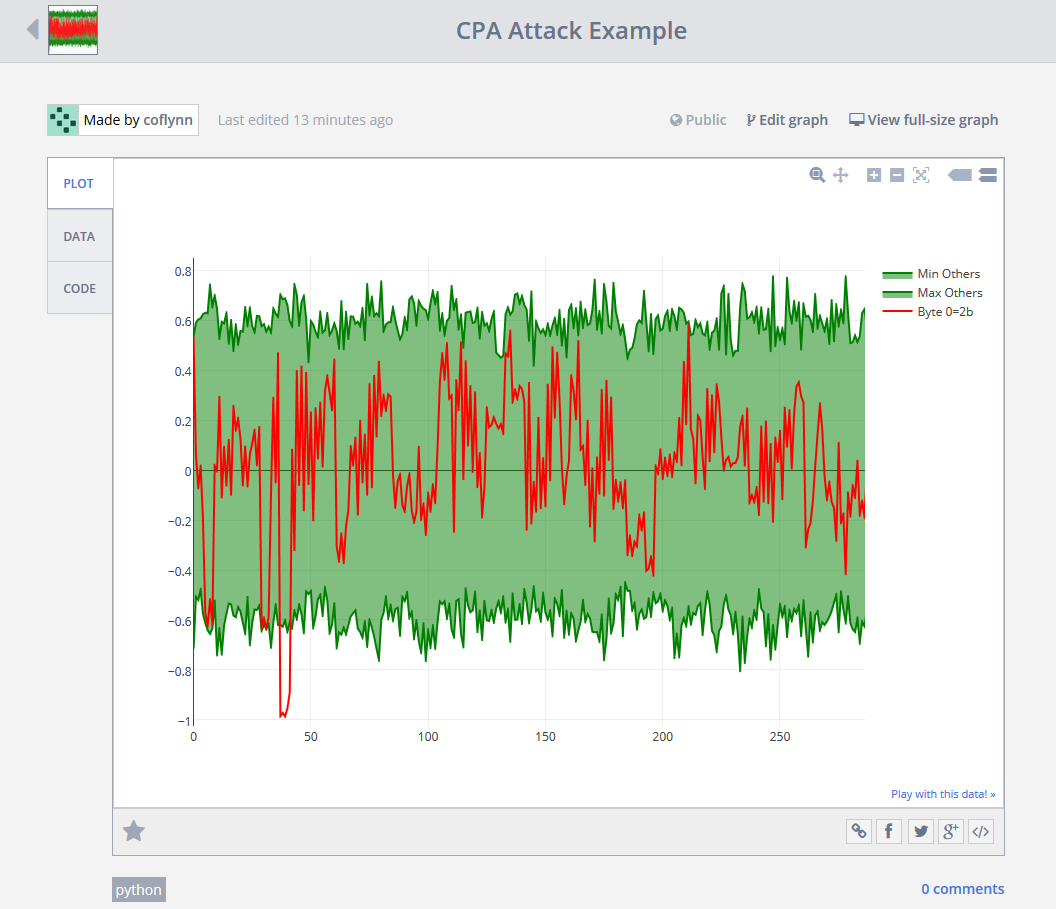
So despite by misgivings about cloud-based plotting service, I do see for some limited applications where it is easier than plotting locally on my computer. So if you are willing to be dragged kicking and screaming through a cloud-based plotting example, I'll show you how it works. The objective is to end up with a web-based graph which looks like this for example (correlation output vs. sample number):

If you want to see this yourself go to https://plot.ly/~coflynn/1 (and ignore the attempt to get you to sign up). This is showing you that for Byte 0, the maximum correlation was detected around sample point 38, with the correct key-byte hypothesis of 0x2B. I'll demonstrate how I created this graph on my attack system.
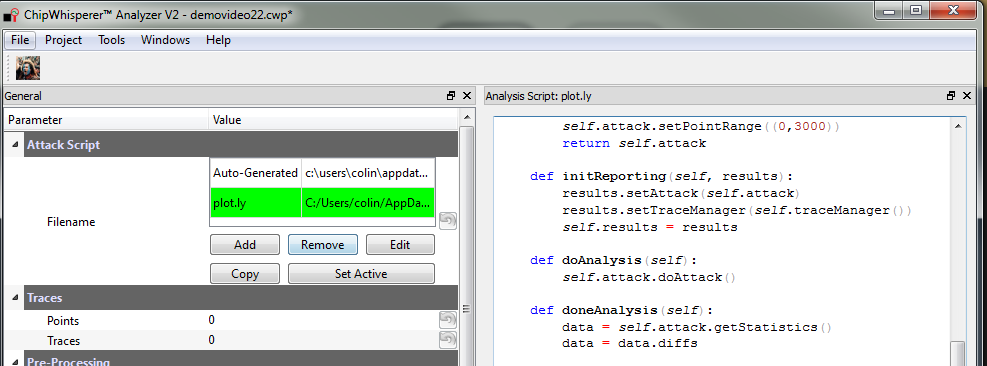
First off, we'll again use the Python-based analysis script. One of the default API calls which will be attempted is called doneAnalysis() once the attack is complete. It's at this point we'll plot the required data. The default template does not have a doneAnalysis() call, so you can simply add one like the following shows:

Inside that doneAnalysis() function, you can paste the following, where the user & token can be seen by going to the example plot page when you are signed in:
    def doneAnalysis(self):
        data = self.attack.getStatistics()
        data = data.diffs

        py.sign_in("YOUR_USER", "YOUR_TOKEN")
        traceList = []

        #Example plots first byte only
        for bnum in range(0,1):
            diffs = data[bnum]
            prange = self.results.graphoutput.getPrange(bnum, diffs)

            #Get correct key from plotting module, can override here too
            self.results.graphoutput.setupHighlights()
            highlights = self.results.graphoutput.highlights

            newdiff = np.array(diffs)
            for j in highlights[bnum]:
               newdiff[j] = 0

            maxlimit = np.amax(newdiff, 0)
            minlimit = np.amin(newdiff, 0)
            hyp = highlights[bnum][0]
            traceList = [Scatter(x=prange, y=minlimit, fill='tozeroy',
                                       line=Line(color='green'), name='Min Others'),
                         Scatter(x=prange, y=maxlimit, fill='tozeroy',
                                       line=Line(color='green'), name='Max Others'),
                         Scatter(x=prange, y=diffs[hyp],
                                       line=Line(color='red'), name='Byte %d=%02x'%(bnum, hyp))
                        ]

        data = Data(traceList)
        plot_url = py.plot(data, filename='CPA Attack Example')
        print plot_url
Then you have to add some imports at the beginning of the file:
import numpy as np
import plotly.plotly as py
from plotly.graph_objs import *
Pretty easy! Most of the above code was adapted from my OutputVsTime class in the ResultsPlotting.py file, including the min/max fill code. This is required since you'd otherwise be plotting 256 lines overtop of each other, which is very slow when displaying on plot.ly (see a test if you don't believe me). You can of course just plot all the lines if you want, but this way you only have to plot 3, which is much much faster.
There is some other reasonable use-cases for plot.ly too. You can monitor the output of an attack on a small computer (i.e. checking your smart phone whilst you are at the pub waiting for it to finish), and it would be ideal for sharing scientific results. Having the graph on plot.ly would be a big step up from just a rasterized version of the results, since it gives people access to the data in a usable form.
If you really want, it's possible to add an Upload to Plot.ly button to the GUI, since the API calls are almost the same as the internal plotting functions. But for me the only situations that make sense to use plot.ly are where you can't see/control the GUI, such as remote/headless computers, so I don't see much value in such a button.
Updated LNA PCBs
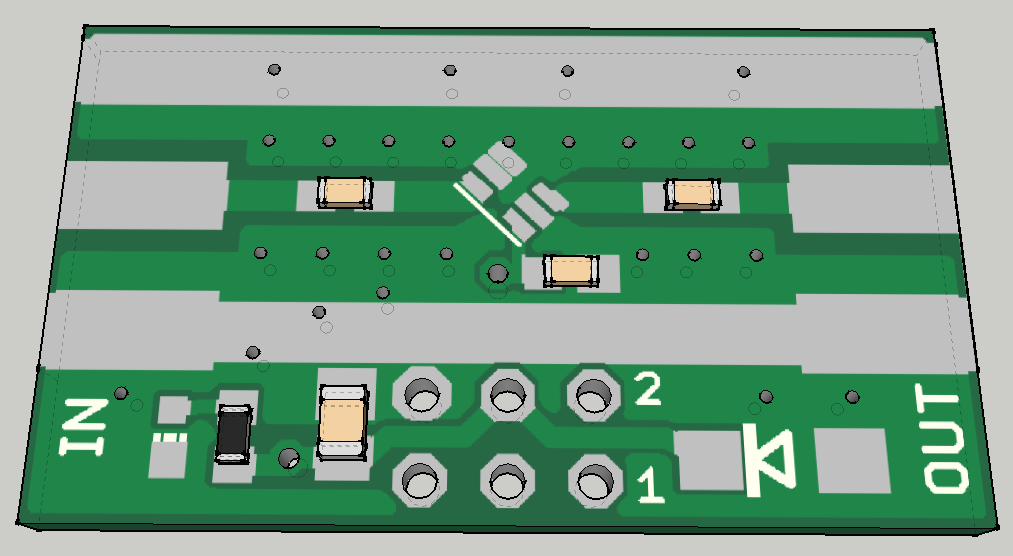
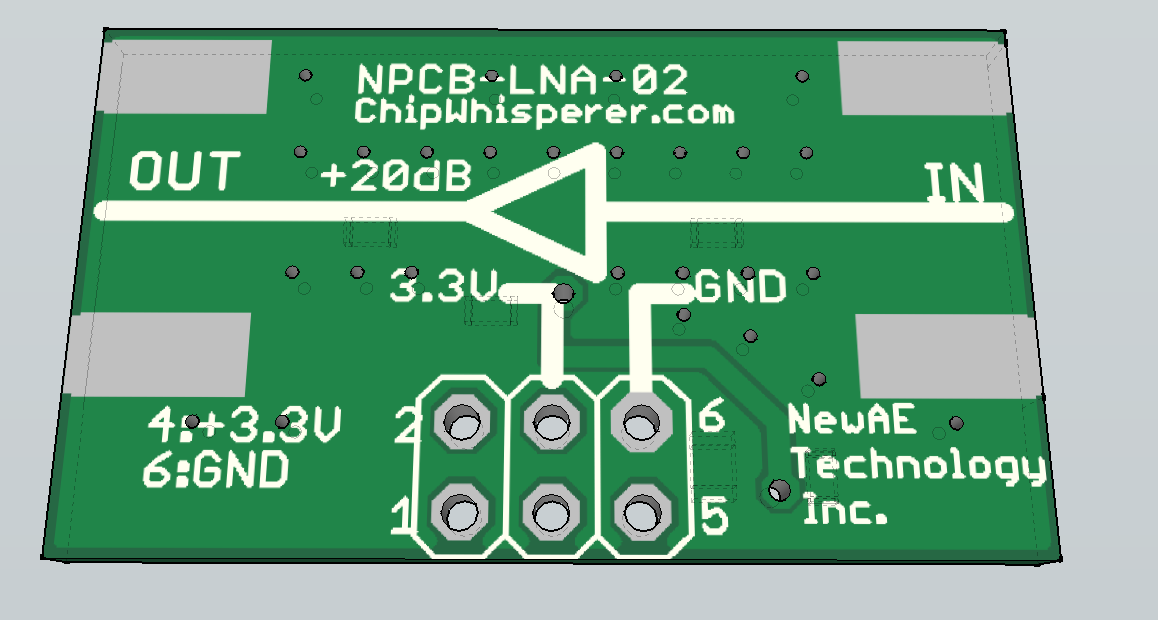
Enough cloud stuff for now, let's talk hardware again before getting back to cloudy things. I've made some small updates to the LNA PCB. Mostly improvements in the silkscreen, but I also add some exposed copper such that you can solder a shield over the RF portion. The shield would actually connect onto the SMA jacks themselves, so would have to be a custom-bent piece of metal, or possibly even just some copper tape. It wouldn't be pretty, but it should work a treat.


There's also updates to the Differential Probe PCB, along with some small fixes to the other boards pushed to GIT. I plan on adding a new feature to the diff probe which shows you when the null offset is correctly set, avoiding the need to check the offset voltage before use, so will post details of that when I get a chance.
Side-Channel as a Service
Unlike all my other posts, this topic will describe some ideas to give you an idea where this project might go. The features described here do not exist in the codebase though, I haven't had time yet, but thought it would be interesting to read where this project might go.
I realized that many academic researchers don't actually care about the hardware, and are simply interested in testing their algorithms in hardware (i.e. for side-channel resistance). As such it would be possible to build a rack of ChipWhisperer + Target boards, and researchers could simply 'rent' access on those boards. They would like to be able to download algorithms to the target device, control the ChipWhisperer device, etc. They don't necessarily need to physically have the hardware on their desk.
This would ideally allow the researcher to communicate with the ChipWhisperer hardware over a network connection, i.e. using the same GUI to touch a device anywhere in the world. Whilst the current level of abstraction would allow this easily by packaging commands in UDP/TCP connections, this might seem like too much of a hack, instead of using something more along the lines of a REST API to touch features of the ChipWhisperer hardware.
But deploying a REST API without considering if it's really the best solution would also be a hack. Having considerable experience with various IoT projects (including being part of developing Zigbee-IP, 6LoWPAN, Contiki-uipv6, and some miscellaneous events), and having seen the over-application of certain technologies, I'm always a little sceptical that REST is always the solution. So Sidechannel as a Service might need to wait a bit to figure out the real use-cases, and determine what makes the most sense for an interface.
For now I've been using these devices remotely via a VNC connection. I actually have one server with a ChipWhisperer-Capture connected to it. When I need to do long captures I connect to this computer via a VNC client, setup the capture, and then run the capture over VNC. Because there is more than just sending commands to the ChipWhisperer-Capture (i.e. you also need to communicate with the target device, which might rely on drivers on the host computer), this solution has worked well for me. It allows me to easily disconnect from the server and log in periodically to check progress. But it requires some thought about how to move forward.
 Colin O'Flynn
Discussions
Become a Hackaday.io Member
Create an account to leave a comment. Already have an account? Log In.