MobileWill
-
Graph Widget
05/29/2016 at 18:43 • 0 commentsCurrently the graph is made up of an bitmap (converted into an array) that contains the axis and tick marks to divide up the axis. To speed up graph redraw performance, I had used a bitmap converted to an array and then take the previous value and reset that pixel from the bitmap array and then draw the new point. This worked very well over redrawing the entire graph.
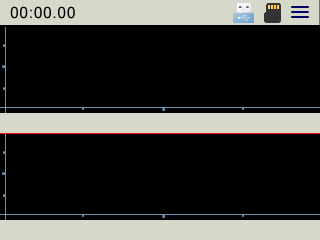
I wanted to make the graph data that is displayed configurable by the user. Originally (as seen in the pictures), the graph has four radials on the right side. The fourth being a split screen graph. The problem lays in where to put the data for the second graph? I could overlay it. but that takes away from the graph data. So I think the way to go is to remove the low info bar and then each graph (top and bottom) will have its own info bar. It is hard to cram all of the needed info for the user in a small screen and still be easily viewable. I wish I could find cell phone displays readily available. The final version will most likely be a capacitive touch display. Then to configure the graph you would just tap the graph. Here is a mock up of what I was thinking.
![]()
It would be a self contained widget with properties you can set, being able to push data to it. They will auto scale on the y-axis and possibly have the option for the user to force the scale if needed. They key is going to optimize for faster refresh rates which is one of my goals. The ability to select which graph is on top and bottom allows you to compare various data points.
Here are the graphs I am thinking of including, at least initially.
Current, Voltage, Wattage, mAh, and mWh.
There still needs to be a place for other data such as peaks, mins and consumption. Once this is complete I can expand upon features such as building out the SD card data logging options and the serial command interface.
-
New Bug
05/29/2016 at 06:41 • 0 commentsIt seems with the new status bar on top the info bar at bottom has stopped updating. Very strange. The bottom is still made of up a container with textboxes. In thinking through the next design steps it didn’t make sense to spend time on fixing this issue since the graph needs to be converted into a widget and will change the bottom info bar.
-
New Status Bar Widget
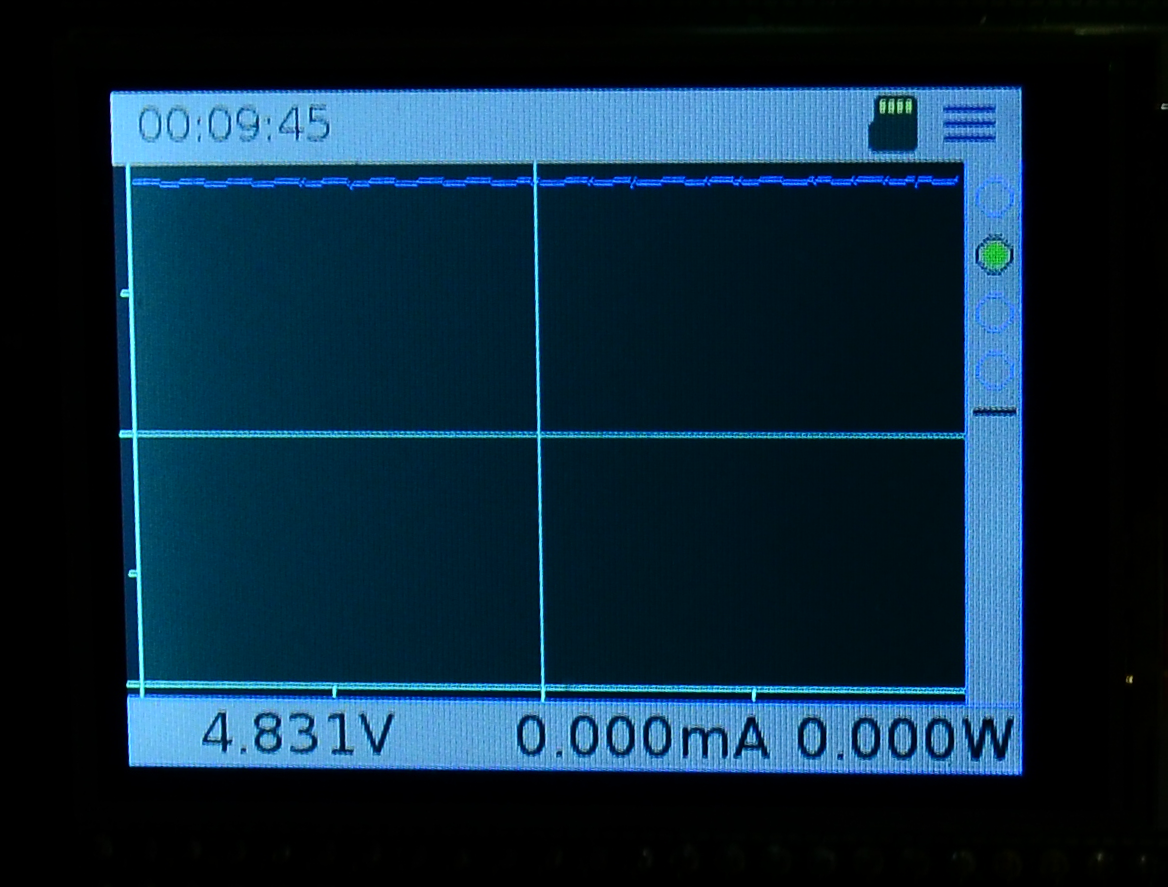
05/29/2016 at 06:37 • 0 commentsIn an effort to streamline the interface, code, and improve performance I have been working with uGFX support to make some major improvements before moving forward with features. One of their suggestions is to make the status bar at the top a widget instead of layered objects. Currently it was a container with a textbox, four buttons and three images of which two are indicators. The buttons actually were using images as well. Working with support, a widget was created that acts as an object with properties that can trigger events. Much better and cleaner in code.
Here is a picture of the first test with it.
![]()
-
Bug fix
05/27/2016 at 06:23 • 0 commentsBug fix: I had an issue where when you open the settings frame it would crash just before drawing the text on the save button. I have been ignoring it for awhile but finally sat down to take a look. Fortunately, after thinking it through it didn’t take much time to find the reason for it. Apparently the font I was loading for the save button and time display was set to a font that hadn’t been loaded in memory first. Doh! If you have used uGFX this will make sense. You have to open the font first before you can use it. Then you can set it as the default or set the font for an object.
Here is a pic of the offending code. I am not certain what font it is with the _u since that isn’t listed in the list of available fonts. I must of got it from somewhere though...![]()
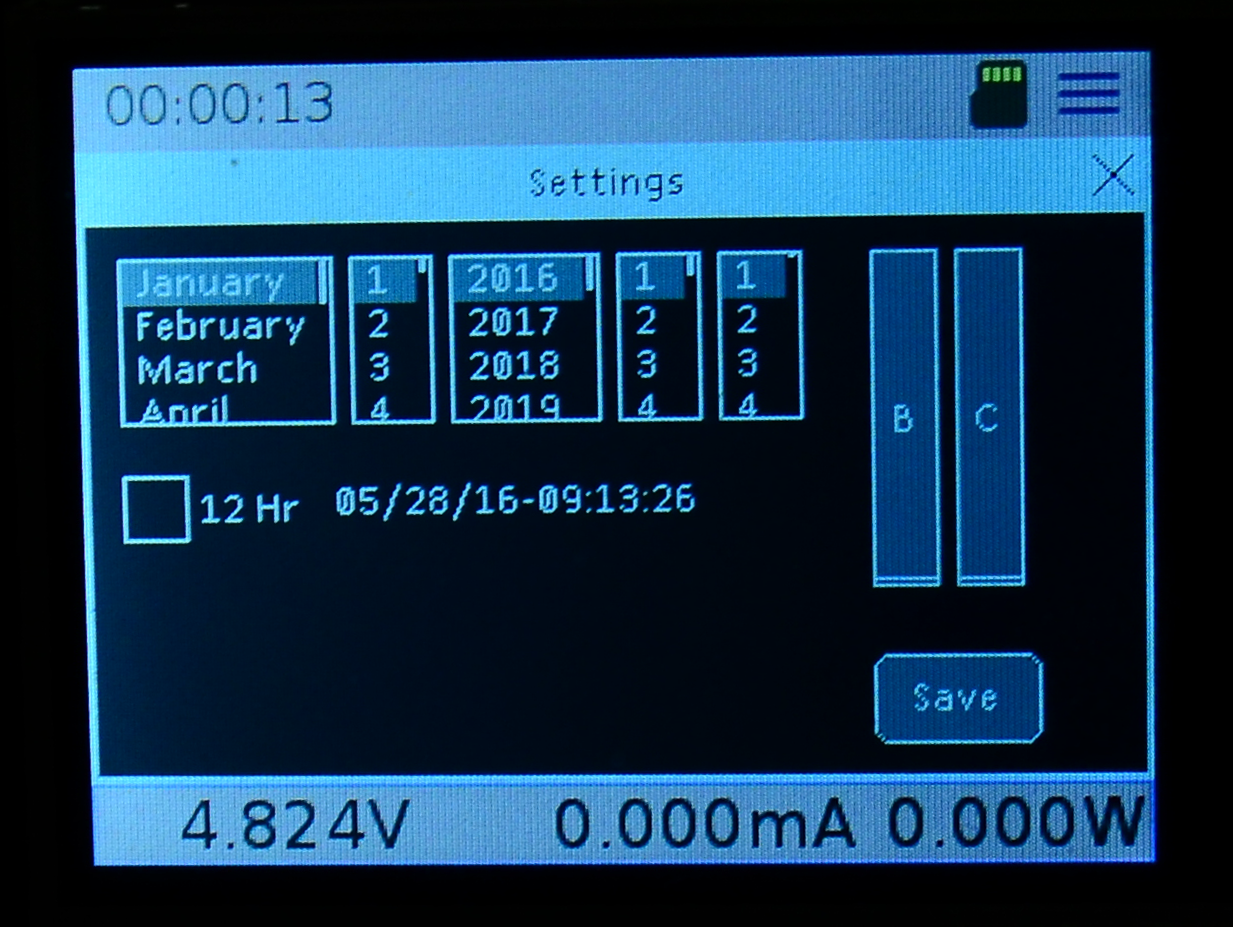
Here is the working settings dialog
![]()
USB Multimeter
All in one open source device to monitor and data log power usage of USB devices and other connection types.