Ted Yapo
-
How to design an LED glow marker
08/25/2016 at 21:55 • 0 comments...at least my first crack at a comprehensive approach. Here's a model for the parts of the system that can be optimized:
![]()
Electro-chemical (a.k.a. batteries)
This one is pretty easy. Of the four readily available lithium battery chemistries, three take top spots for highest energy density in primary batteries. All of them have decently flat discharge curves (nearly constant voltage over life), and work in cold temperatures.
Chemistry Voltage (Nom.) Wh/kg Wh/L Example Li-MnO2 3 V 280 580 CR2032 Li-(CF)x 3 V 360-500 1000 BR2032 Li-SOCl2 3.5 V 500-700 1200 TL-2450 Li-FeS2 1.5 V 297 - Energizer L91 [ data from Wikipedia: Lithium Battery]
Lithium thionyl chloride (Li-SOCl2) has the highest energy density (mass and volume). You can buy them from DigiKey, but they're expensive, toxic, and can explode when shorted [wikipedia]. They have an awesomely flat discharge curve and work in extreme cold. I have a few to play with, but I don't think they're practical for this use.
Lithium managanese dioxide (Li-MnO2) are the "CR" lithium coin cells we usually think of (e.g. the ubiquitous CR2032). According to the wikipedia article, they rank third in energy density, but I think the table is wrong (see below); from the datasheets, they appear to be in second place. They're cheap and I've seen them in department stores, home improvement stores, pharmacies, and supermarkets.
Lithium carbon monofluoride (Li-(CF)x) are the "BR" coin cells compatible with the "CR" series (e.g. BR2032). The datasheets show a 190 mAh rating for the BR2032 compared to 240 for the CR2032, so I don't understand how the energy densities in the table can show this chemistry as superior. In any case, they're available, but nowhere near as common as the "CR" batteries, and so I'm ruling them out.
Lithium iron disulfide (Li-FeS2) are the lithium "AA" and "AAA" batteries, most commonly found as Energizer brand. As replacements for alkaline batteries, they have a higher capacity, work better in the cold, are much lighter, have a flatter discharge curve, perform much better at high discharge rates, have amazing shelf life (20 years), and cost a lot more. Because of their superior performance in digital cameras, they're also widely available. The real downside for glow markers is that they're only available in larger sizes (no coins), and worse, you need a pair of them because they're approximately 1.5V.
Rechargeable batteries are interesting, but they suffer three problems. First, they have low capacity and high self-discharge compared to primary chemistries. You can recharge them (maybe from solar or other energy scavenging sources), but their service life isn't very long - think about how many years you get out of a cell phone or lithium camera battery before it no longer holds a charge and you need to replace it. With the discharge rates of glow markers, primary batteries can outlast rechargeables even if you are re-charging them.
Super-capacitors might be more interesting if you have a power source to periodically charge them (solar?), but they have terrible energy-density compared to batteries. If you have a few cloudy days in a row, your light might go out.
Bottom line: "CR"-series coin cells where size is a concern, "AA" or "AAA" lithium batteries for high brightness markers or super-long-term use where the size can be tolerated.
Electrical
For any light output level which is below the LED efficiency peak, it makes sense to run the LED in a pulsed mode near the most efficient point. So far, I've used microcontrollers to control the LED pulse, and this is the most flexible approach, although I am exploring using ultra-low-power timer chips as well. With a microcontroller, there are two basic contributions to inefficiency: sleep current and active current.
Obviously, choosing a micro with the lowest sleep current makes sense. Active current is a little more complex. My first thought was to choose an LED which was most efficient at high current levels (hundreds of mA, if possible), so that the active current of the micro would be small in comparison, and hence keep efficiency high. Now that it seems the largest LEDs I am likely to be able to use may have efficiency peaks in the tens of mA region, so this may not be possible. For example, the PIC12LF1571 maximum active current at 16MHz/3V is above 1mA. That's at least a 10% efficiency loss if driving the LED with a constant pulse of 10mA; more if using an inductor to create a triangular/sawtooth drive - and this doesn't count the time required for the internal oscillator to stabilize.
Ignoring the actual pulse generation circuit for now, it seems like for a given micro/LED combination, it will make sense to trade-off LED efficiency for micro overhead. For example, driving with a little more LED current will reduce the electrical-to-optical efficiency, but improve the ratio of microcontroller overhead (the duty cycle can be reduced to keep the same overall brightness). This should be easy to simulate and find a maximum overall efficiency point.
Finally, the pulse generation circuit needs to be optimized. This may be the most straightforward, given the wealth of literature available on optimizing switching DC-DC converters. Inductor and MOSFET switch selection are likely the largest contributions, once pulse current and waveform are chosen.
Electro-optical
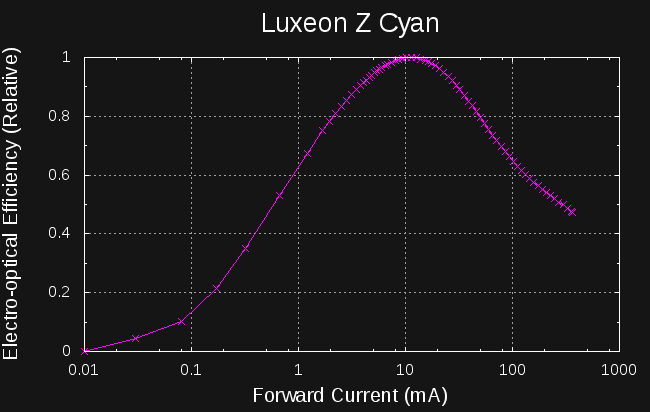
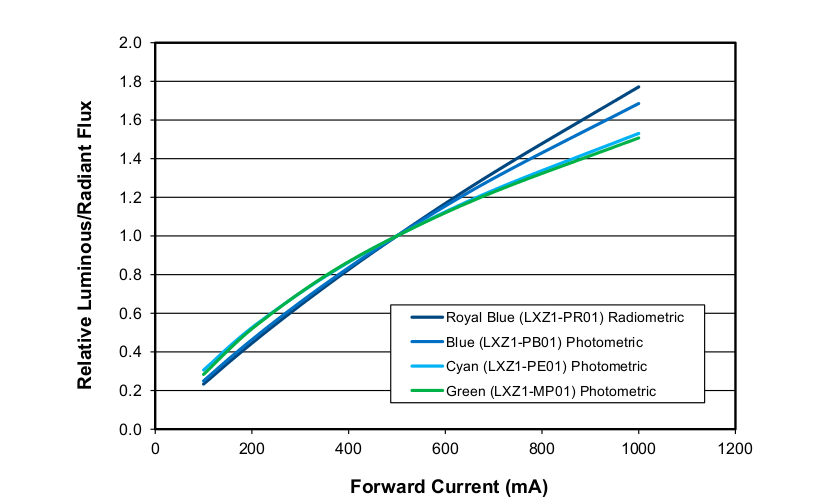
Assuming a selected LED (color choice depends on physiological and expected ambient conditions discussed below), the electrical-to-optical efficiency is a function of LED current. I've spent a lot of time (and build logs) on this topic, so I'll just add one plot I made today for my old favorite LED:
![]()
This LED is most efficient driven at 10 mA, more than 2x that at the nominal rated current of 500 mA. For low light output, it's most efficient to drive it in PWM with pulses as close as possible to 10 mA. I had previously been driving this LED at 100 mA (the datasheet provided no guidance), so was losing almost 40% efficiency just based on drive level (I'm excited to make a new version that exploits this possible gain).
When choosing between LEDs, of course, we have to compare their absolute electrical-to-optical efficiency. This, again, may be a difficult figure to glean from the datasheet, but with some calculations and simple experiments, reasonable comparisons can probably be made.
There's also a third effect to take into consideration. With green/blue LEDs, there can be a moderate shift in the peak wavelength with current drive level. This can make the LEDs more or less efficient at stimulating the human visual system, depending on the LED and the dark adaptation of the observer.
Physiological
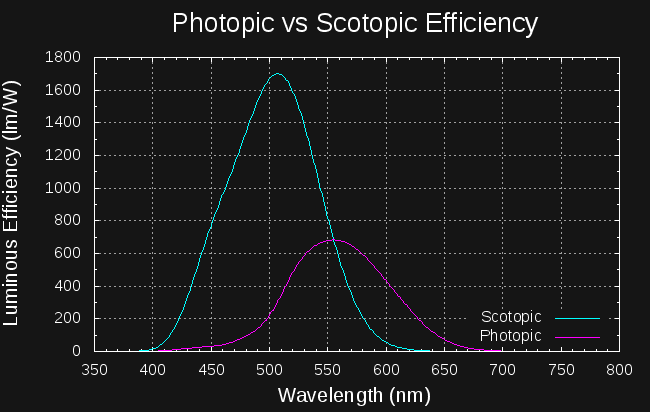
There may not be much we can do to improve the detector in this system, but we can try to understand it. The human visual system has a variable sensitivity to light depending on the wavelength and adaptation of the eye (bright vs dark-adapted). Here are the sensitivity curves for photopic (daytime) and scotopic (fully dark adapted) vision:
![]()
Photopic vision has a peak sensitivity of 683 lm/W at 555 nm, while scotopic vision peaks at 507 nm with 1699 lm/W. For dark adapted eyes, you're about 2.5x better off using cyan light than green. But, for daytime vision, you're 2.3x better off with green than cyan. Both of these figures assume a narrow spectrum; for wider sources, like LEDs, you need to do a little math using these curves to evaluate the luminous efficiency. I'm working on digitizing the LED spectra from the datasheets to do this kind of comparison. The data for these curves can be downloaded from http://www.cvrl.org/lumindex.htm. I multiplied the normalized values by the peak sensitivities for the two curves.
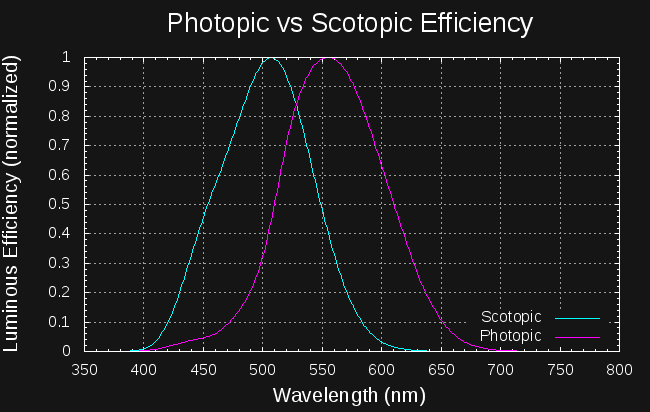
There is probably a compromise that can be made. Plotting both curves with their peaks normalized to unity,
![]()
we see that light at a wavelength of around 528 nm stimulates both curves at about 84% of their peak: this light would be relatively efficient with either light or dark adaptation. Given that we probably spend most of our nights in the mesopic region between these extremes of adaptation, an LED with a peak near 528 nm may be a good choice.
Pulsed Light Perception
I initially thought that part of the "brightness gain" I had observed with pulsed LEDs over low-current DC was due to a physiological effect that makes blinking lights appear brighter, mostly due to this article. When this project was blogged on hackaday, one of the commenters, [Paul] put it pretty eloquently:
That Shimizu paper from Nikkei claims the “pulsed LEDs are brighter” effect is due to the Broca-Sulzer effect, which is horseshit — the Broca-Sulzer effect, though totally real, happens only with relatively long pulses (dozens of milliseconds). (see, for example, http://webvision.med.utah.edu/book/part-viii-gabac-receptors/temporal-resolution/ ) It absolutely isn’t an effect on the sub-millisecond pulse lengths. What Shimizu is seeing is the poor efficiency of the LED driven at low current, and higher efficiency when run at 20x the current but 5% duty.
after measuring the relative efficiency curves for a few LEDs, I can understand how easy it would be to make this mistake. But, I'm still intrigued by the notion that there might be something to gain by pulsing at the right frequency or pulse width. Unfortunately, testing this requires human subjects and careful experimental design. It's tempting, but I think I'm going to put this off for now.
-
LED Efficiency Spread / New Ebay LEDs
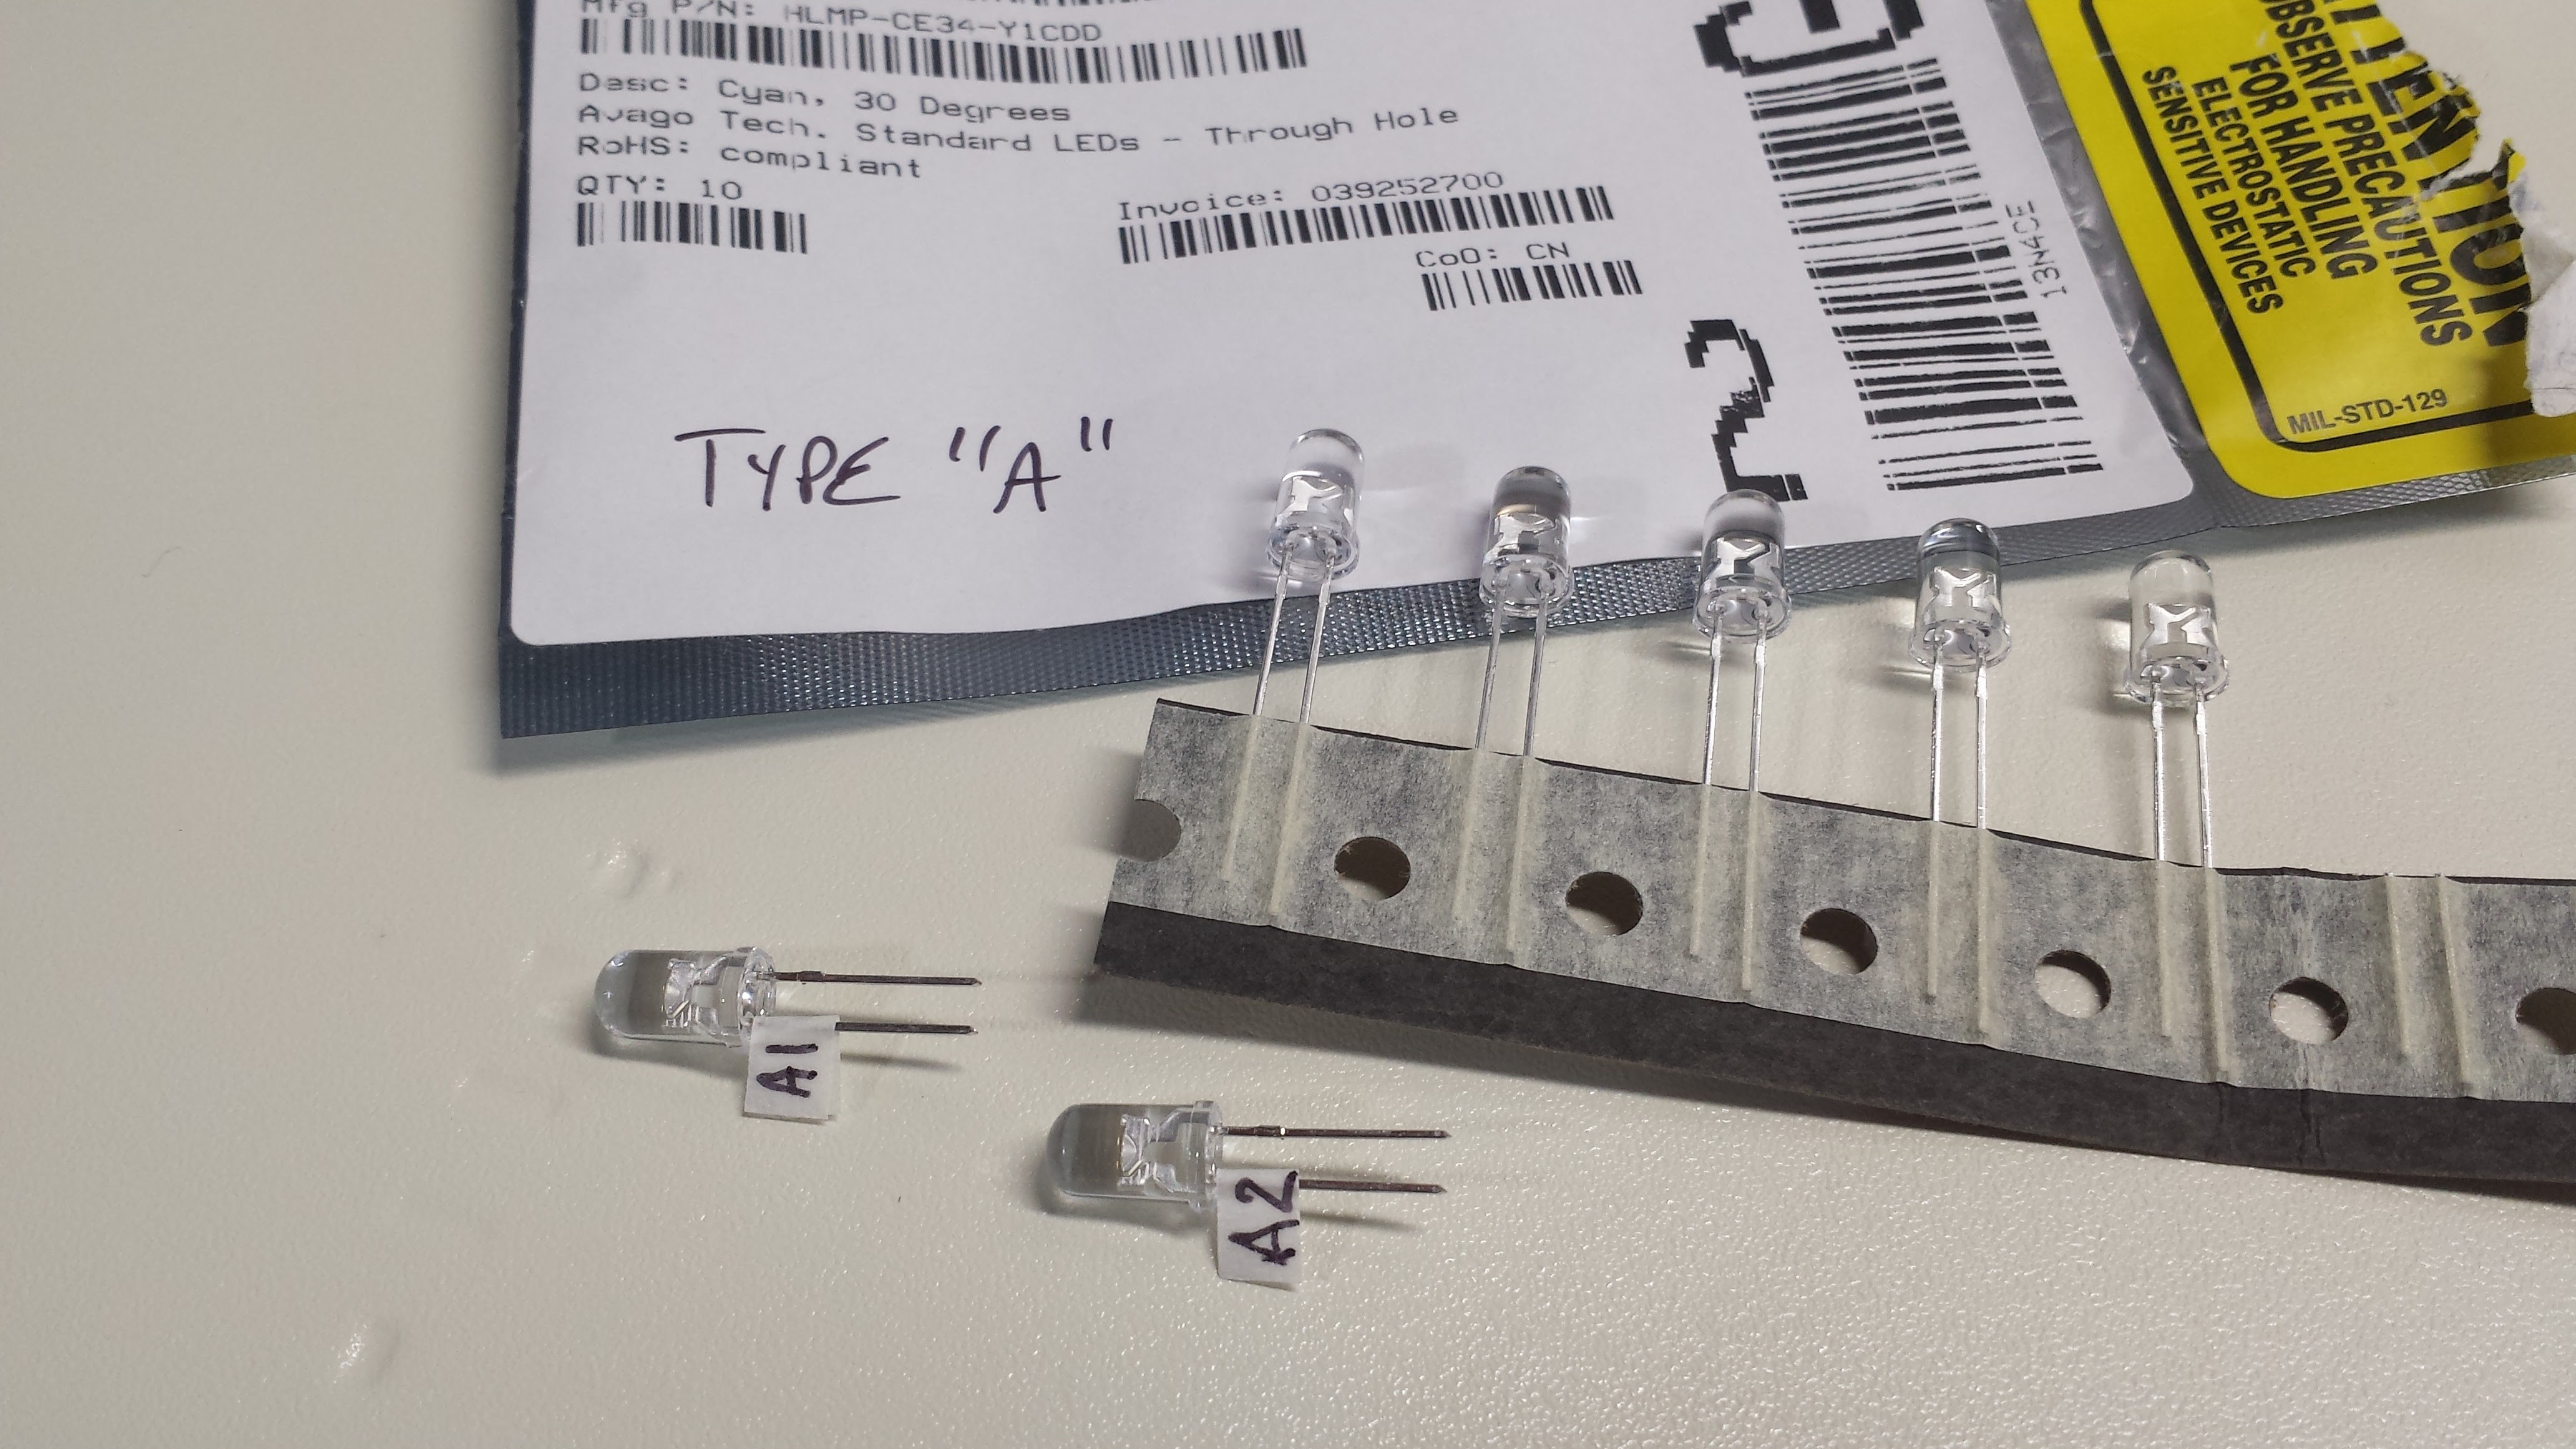
08/23/2016 at 19:53 • 3 commentsNow that I have a first prototype of #Automated LED/Laser Diode Analysis and Modeling running, I decided to see how well matched the relative efficiency curves are for a set of LEDs from the same batch. I have 8 of the ones I have been testing, so I cut them off the tape and labeled them:
![]()
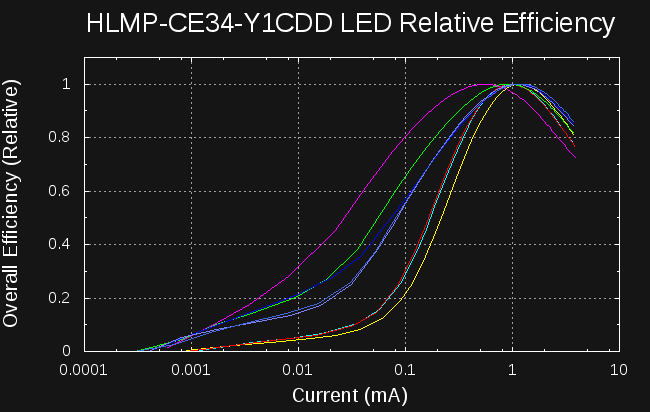
Running a sweep in the analyzer takes a few minutes for each LED, so it was short work to plot all of the efficiency curves:
![]()
Since I am not sure how repeatable the LED/sensor optical coupling in the scanner is yet, all of these curves are normalized to have their peak at 1.0. It could be that some of them are more or less absolutely efficient, but at least we can see how we would do choosing a single current for driving any of them. It's not a bad cluster, with the exception of the magenta curve (LED A2), which peaks a little low. Even so, if we chose 1 mA to drive any of these LEDs, A2 would still be at 95% of its peak efficiency.
I think it makes sense to run some curves like this with any candidate LEDs. Unfortunately, most of the LEDs I've been looking at have to be surface-mounted, so I need a board for each sample. I guess I can initially evaluate a single sample of each type of LED to narrow down the field, then have 10 cheap boards made to evaluate the spread for a few candidate parts.
Ebay LEDs
I found some LEDs claiming 490 nm output (very close to the dark adapted peak) on ebay. These are "3W" units, similar in power to the Luxeon Z I have been using, but cost around $0.80 each:
http://www.ebay.com/itm/221441900690?_trksid=p2060353.m2749.l2649&ssPageName=STRK:MEBIDX:IT
and some "1W" versions:
http://www.ebay.com/itm/221441917487?_trksid=p2060353.m2749.l2649&ssPageName=STRK:MEBIDX:IT
They claim a 120-degree viewing angle, which is the same as the Luxeon Z. I can't wait for them to arrive so I can test them. They're also hand-solderable.
-
Miscellany
08/19/2016 at 13:28 • 13 commentsI had some news and a few ideas I'd like to get out there, even though I haven't had enough time to flesh everything out yet.
New Team Member
I'd like to welcome @tony ozrelic to the team! Tony and I have been discussing some promising new circuit topologies for the design (more about this below). I'm really excited that people are experimenting with these things!
Lime Luxeon LEDs
I ran across another Luxeon Z LED - the LXZ1-PX01 in "lime" color. This LED is interesting for a few reasons. First, it boasts an output of up to 200 lm, compared to around 70 for the cyan, or 100 for the green. It achieves this impressive performance by using a blue or UV emitter (not sure which) and a greenish phosphor, similar to the construction of white LEDS. The lumen ratings are relative to the photopic curve, of course, so it may not be as efficient for dark-adapted eyes (scotopic vision). When I find some time, I'll digitize the spectral curves from the respective datasheets and evaluate them against the photopic and scotopic sensitivity curves to see how these LEDs might compare in the dark. In any case, this sounds like an interesting LED to test. The bad news: $4.20 each. Ouch.
DIY Phosphor LEDs
So, the lime LED got me thinking. What about driving a UV LED with a TritiLED-like circuit, and using it to excite a glow-in-the-dark phosphor? If the phosphor has a decent persistence time, you don't have to worry about rapidly pulsing the LED - maybe a few times a second would be enough to continuously re-charge the glow. I have some glowing plastic stars left over from making bedroom ceiling constellations and a bag of activated ZnS powder from spinthariscope experiments that I can run some tests on. You might even be able to convert wristwatches with phosphorescent hands to tritium-like performance with a strategically-placed pulsing UV emitter.
I have no idea what level of efficiency to expect from this kind of setup, but it seems like a fun thing to try. The really bad news: UV Luxeon Z (LHUV-0390-0400) emitters are $15 each. Bigger ouch.
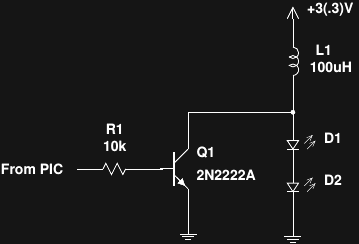
New Topologies
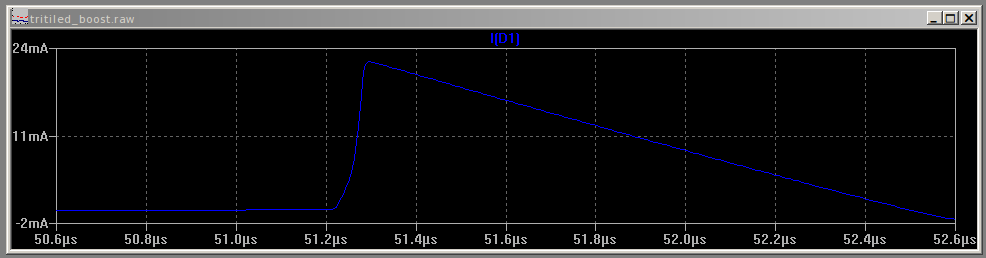
Tony sent me an interesting pulse circuit he came up with:
![]()
It's a wonderfully simple single-shot inductor boost converter. The forward voltage drop of the series LEDs is large enough to prevent current flow between pulses. To pulse the LEDs, the transistor is briefly turned on, ramping up current in L1. Once the transistor switches off, the inductor voltage rises to maintain the same initial current flow, now into the LEDs. As we saw two logs ago, the sawtooth-shaped current pulses generated by a circuit like this can be adjusted to give nearly optimal LED efficiency. Very convenient.
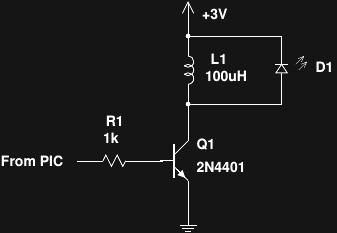
I couldn't sleep after I saw this circuit, and ended up playing around in LTspice with simulations until I came up with this variation using a single LED:
![]()
If you took the two photon arrows off the LED symbol, this would be a solenoid/relay driver circuit with a protective catch diode. Turning the transistor on energizes the inductor, which then discharges through the LED after the transistor turns off. It just doesn't get any simpler than this. Tony built one of these, too (I'm still in simulation-mode), and reported that it was brighter than the two-LED version. It would also be cheaper, especially with Luxeon LEDs.
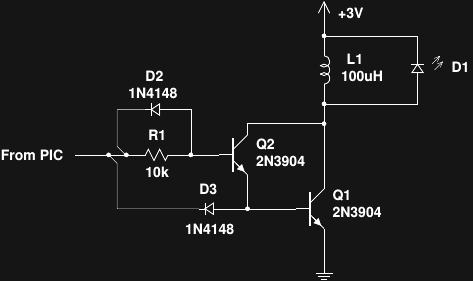
The one thing that might drag efficiency down here is the base current, which is wasted. Using a MOSFET might help, but driving the gate capacitance might negate any gains - I'm not sure yet. Another alternative which I've been playing with in simulation uses a Darlington pair with a couple of diodes to improve turn-off time. This circuit forces the base current of the driver transistor through the inductor, so it's not wasted:
![]()
Here, D1 and D2 speed the turn-off and seem to improve the overall efficiency, at least in simulations. This idea is only half-baked, so shoot holes in it if you can.
In any case, some version of this single-shot inductive boost idea seems like just the thing for improving efficiency. With these circuits, the overall LED brightness and power consumption are likely to be strong functions of battery voltage, so some smart software on the PIC is probably in order. PICs with an ADC and internal voltage reference could be programmed to monitor the battery voltage (maybe reading it every few seconds) and adjust the pulse duration using a pre-calibrated lookup table to maintain an optimum LED current. A second lookup table could provide a duty-cycle adjustment to maintain a constant brightness level.
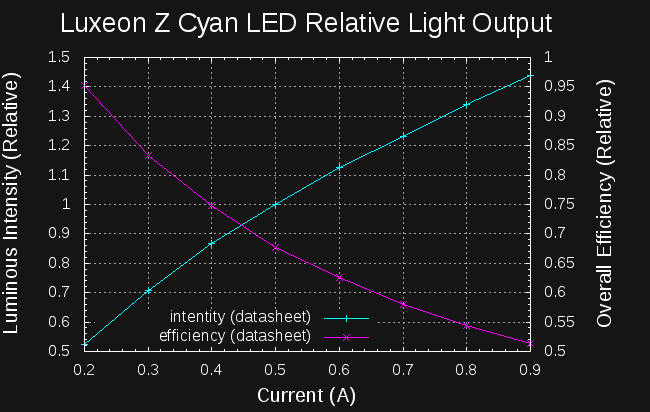
Datasheet Scraping for the Luxeon Z
I'm still waiting for properly heat-dissipating PCBs to test the Luxeon Z LEDs at high currents, but I pulled the datasheet-graph-digitization trick again to see what Lumileds themselves implicitly say about the relative efficiency of their LEDs. I grabbed these plots from the datasheet:
![]()
![]()
then digitized the cyan curves with the awesome open-source engauge-digitzer, and calculated the relative efficiency:
![]()
As you can see, this LED is almost 2x as efficient at 200mA as it is at 1A (the maximum rated DC current). As expected, the data doesn't extend all the way down to show the efficiency peak somewhere below 200mA. My original circuit pulsed the LED at about 100mA. Now I'm really curious as to how close I (accidentally) got to the ideal!
-
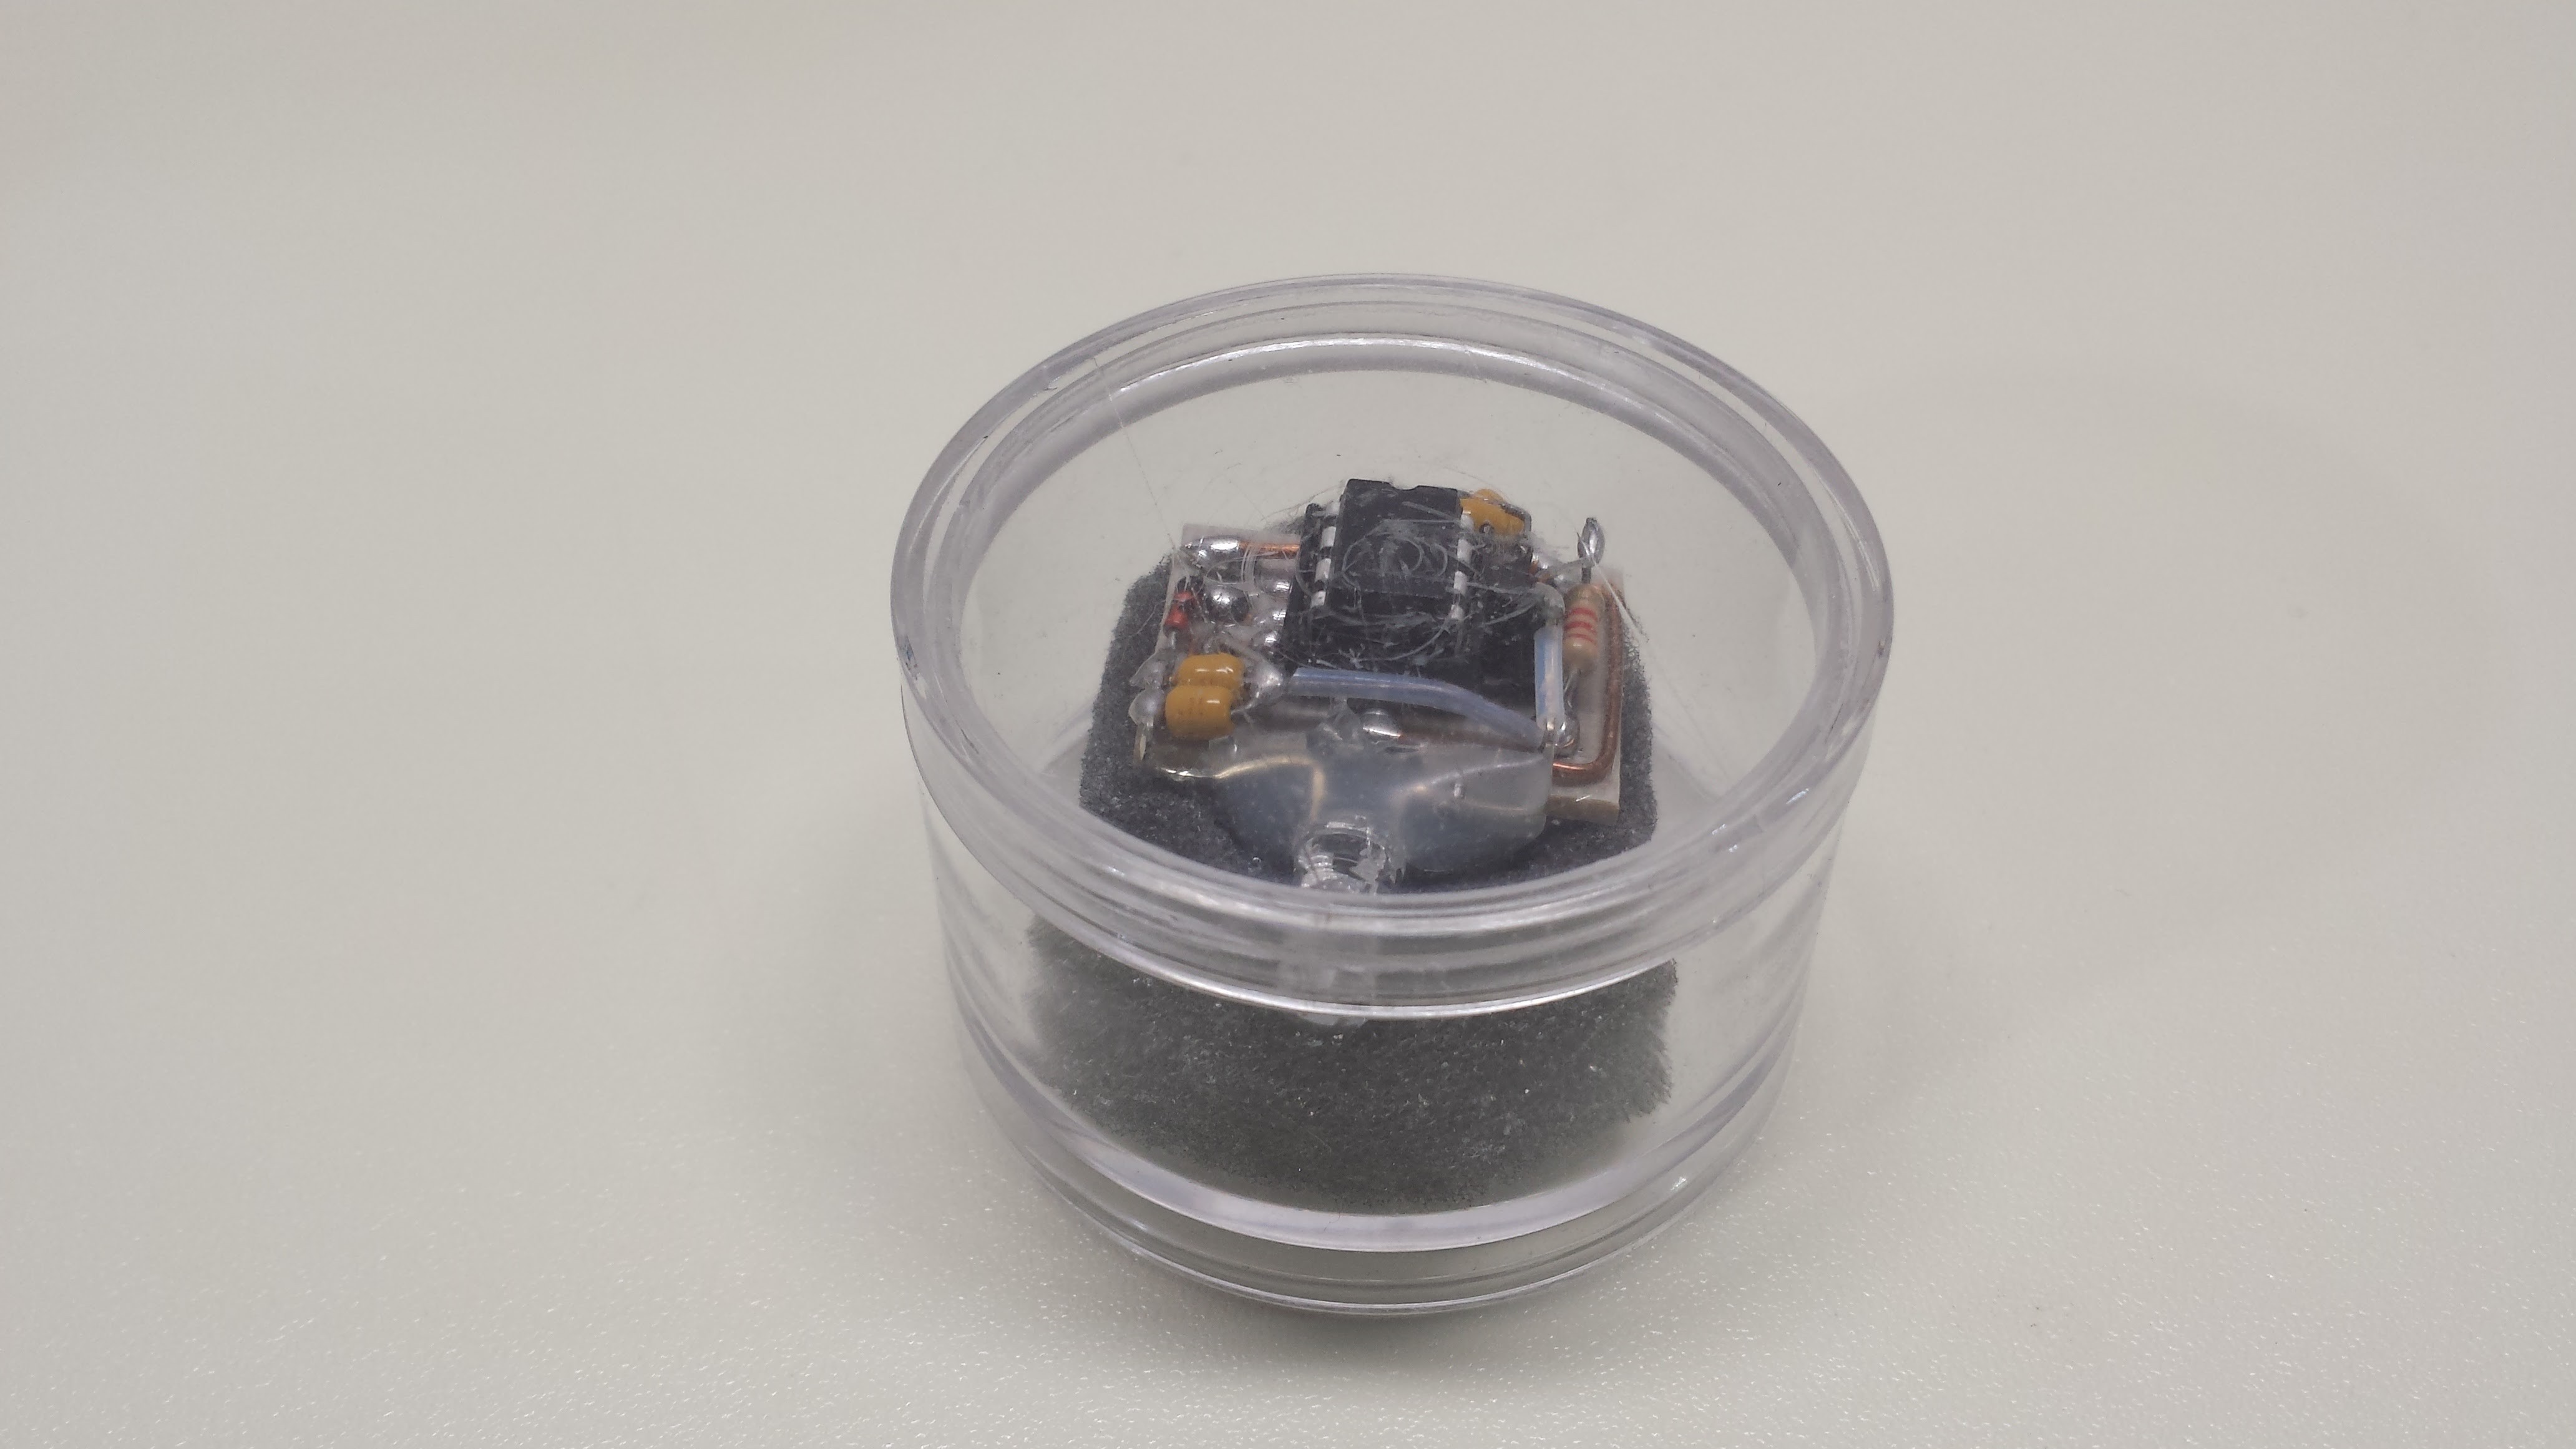
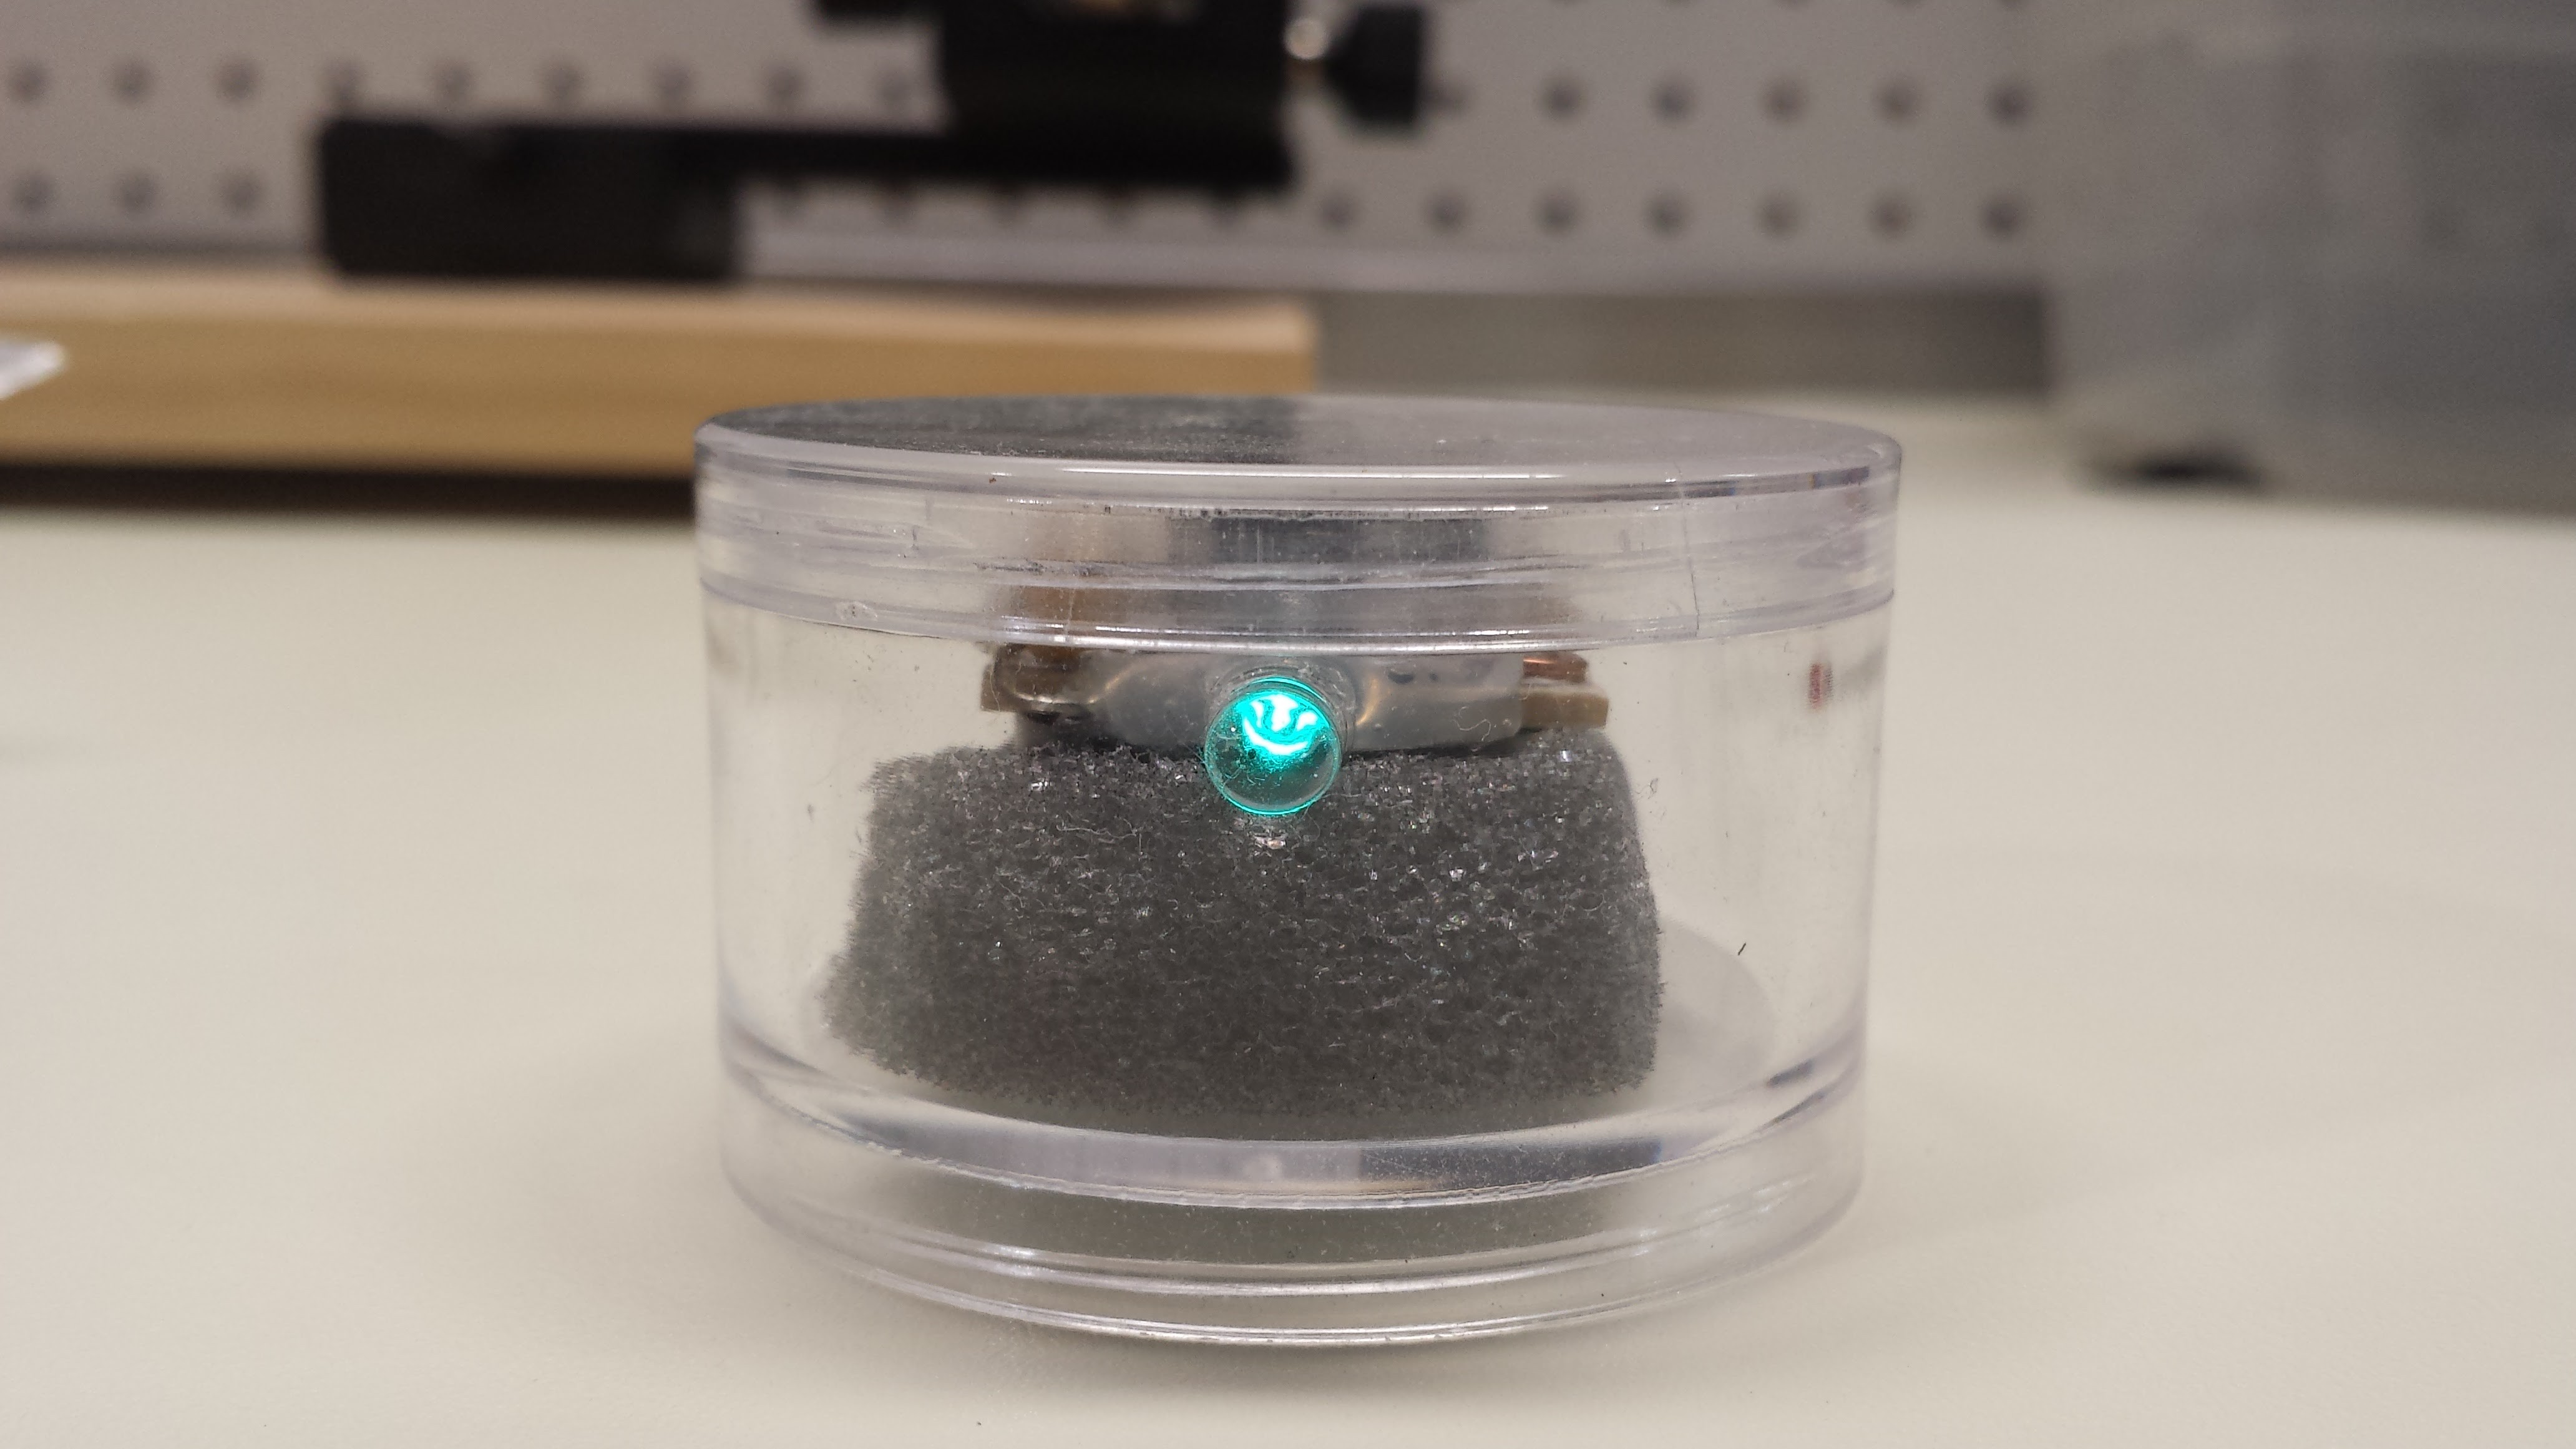
The first TritiLED is dead...
08/19/2016 at 12:29 • 0 commentsLong live the first TritiLED!
![]()
![]()
Earlier this week, I woke up in the middle of the night and missed the familiar green glow; at the time, I figured that the thing had simply fallen off the nightstand. When I got up this morning, I noticed it there, lifeless.
Checking my notes, I stopped fooling with this one and just let it run on 20150622. Assuming I caught it on that first night, it ran for 421 days on a CR2032 battery.
Of course, I just popped in another battery this morning, good for another year or more.
-
Designing Pulses for Maximum Efficiency
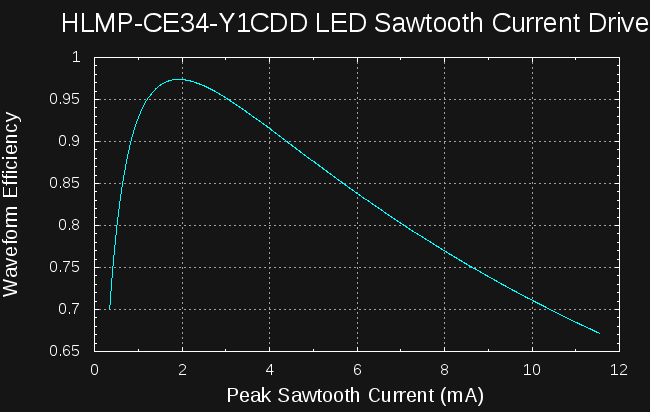
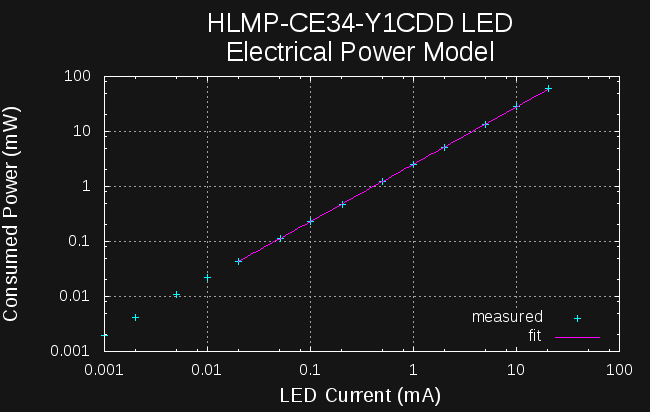
08/16/2016 at 14:45 • 0 commentsI've worked out a design procedure for finding the optimum peak current for a given pulse shape based on data measured or scraped from datasheet graphs. For example, here's the relative efficiency of sawtooth current waveforms vs peak sawtooth current for one particular LED. By choosing the peak current correctly (1.93mA), we can obtain 97.4% of the peak efficiency of the LED. Contrast this with using the datasheet nominal value of 20mA to set the peak, which results in only 47.7%. A naive design can easily waste 50% of the available energy.
![]()
This approach is applicable to any LED and waveform shape, but requires a bit of explanation; I don't have bullet-proof pre-packaged code to do these calculations automatically yet - it's all in a messy octave file for now. All of the data presented here is for the HLMP-CE34-Y1CDD LED I have been playing with lately (mainly because it's in a convenient 5mm package).
Approach
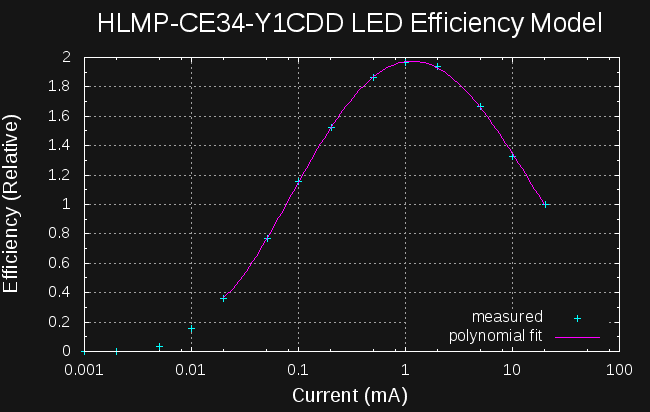
For the moment, I'm concerned with finding the optimum pulse amplitude for a given LED current pulse shape. For example, finding the optimum amplitude for constant-current pulses is trivial - simply choose the current corresponding to the point of peak efficiency. To get a an accurate idea of where that point is, I fit a 4-th order polynomial to the efficiency data measured earlier:
![]()
The data was fit for currents from 20uA to 20mA, as I consider this a reasonable bracket around the peak. There's nothing special about the choice of polynomial order, other than it fits the data well; it's simply used as a smoothing interpolant here. Finding roots of the derivative of the polynomial model yields the location of the estimated peak efficiency at 1.15 mA.
For rectangular current waveforms, the best we can do is pulse the LED with 1.15mA. I consider this to have a "waveform efficiency" of 1. With other waveforms, the efficiency must necessarily be less than this, since the current is not always at the peak efficiency point. For these waveforms, we can manipulate the peak current, scaling the whole pulse up or down to change the efficiency. Once the optimum pulse waveform has been found, the pulse width and/or duty cycle can be changed to give the desired light output or power consumption. This might sound convoluted, but I think a concrete example will clear it all up (it did for me :-)
Sawtooth Pulses
As an example, consider sawtooth current pulses like you might get from a magnetized inductor "discharging" into the LED:
![]()
Here, the LED current jumps up to an initial peak, then decays back down to zero. As a first approximation, I'll assume an idealized sawtooth - the current jumps up to the peak instantaneously, then ramps down linearly (the method I'll describe for optimization would work with the actual shape just as well). Here's the problem - how do we choose the peak current to optimize efficiency? If we make the peak current equal to the optimum efficiency point, everywhere to the right is sub-optimal. Likewise, if we set the optimal current point somewhere else on the slope, the points to the left are above optimum, while those to the left are below. There exists an amplitude for this waveform which maximizes LED efficiency - but, where is this point, and how close can we get to the "waveform efficiency" of the the rectangular pulse (1 by definition)?
For a given waveform (and fixed amplitude), we can evaluate the waveform efficiency by the following formula:
where V(peak), I(peak), and E(v, peak) refer to the voltage, current, and relative luminous intensity at the efficiency peak, respectively. The initial factor in parenthesis is a normalization constant that sets the constant-current pulse waveform efficiency to unity. The meat of the formula is the ratio of the total amount of light emitted to the total electrical energy consumed over one cycle of the waveform. By evaluating this ratio at a number of possible peak currents, we can compare the relative efficiencies obtained, and choose one close to the optimum.
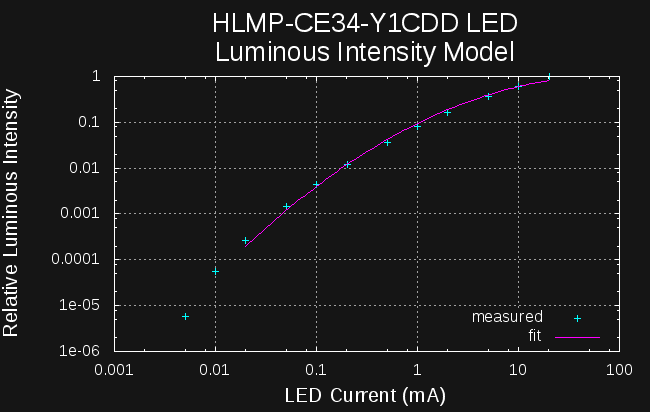
I wrote some octave code to do these integrations numerically, but they require models for power and relative intensity as a function of current. Here is the model for relative luminous intensity as a function of current:
![]()
The function fit here is a 2nd-order polynomial (parabola) fit to log-log data. Again, there's no intended physical significance to the model; it's purely for smoothing and interpolation. A similar fit was made for electrical power consumption vs LED current:
![]()
This model is trivial, being a power law (no pun intended), and is simply fit with a line.
Results
Running the analysis using these models yields the plot where we started this log:
![]()
To generate this curve, I evaluated the waveform efficiencies for 971 values of peak current ranging from 350uA to 11.5 mA. The best value was 1.93 mA, and this achieves 97.4% of the efficiency that can be obtained from this LED. I was really happy to see that you could achieve this efficiency with a sawtooth waveform - it opens up the possibility of very efficient inductor-based circuits.
Note that the efficiency of the waveform does not depend on the pulse length, just the maximum amplitude. We are free to choose short or long pulses and vary the duty cycle as required by other design constraints.
Next Steps
A simple, efficient, circuit to pulse the LED with sawtooth waveforms from an inductor would be a logical follow-on.
Also, I'd like to somehow make this kind of analysis easier. Right now, it requires a number of human decisions (order of polynomial fits and similar choices). I could try just using linear (or more complex) interpolations for re-sampling the data. This would not achieve the same smoothing/noise filtering goals, but might provide acceptable results.
For now, if you want to check out the octave code, you can get it here.
-
Unbiased Testing
08/12/2016 at 14:16 • 1 commentThe tests I've done so far have indicated that there's something to be gained with pulsed LEDs for efficient glow markers, but the simple by-eye evaluation of relative brightness between the DC-driven and pulsed LEDs may not be very accurate. I've been playing with ideas to remove some of the bias from this comparison:
![]()
But I probably should explain how I got to this point first.
LED Brightness Spread
It's common practice for LED manufacturers to sort "identical" LEDs into bins based on brightness (if they're making this measurement with a constant current, they're really sorting by efficiency, but that's beside the point). Even if the two LEDs we are comparing (pulsed vs DC) are from the same brightness bin, there could still be some variation in brightness, perhaps skewing the comparison results. One solution would be to select a pair of LEDs for matched brightness from a larger sample of parts, but this presupposes an accurate method for comparing brightness. A simpler approximation is to test the LEDs twice - with each one in the DC and pulsed circuit in turn. If the difference in results between the two trials is too large, the LED pair can be rejected as "too different", and a new pair selected. If the difference is small, the average of the two trials could be used.
Light Detectors
Human Eye
The human eye can detect intensity differences of about 1% (see Poynton's Gamma FAQ, Section 13). It sounds good enough, but this is based on comparing two homogeneous light patches right next to each other. With LEDs and their varying radiation pattern, I seriously doubt you can approach this accuracy looking directly at them. I had some early success placing a sheet of paper over two LEDs to diffuse the outputs - what I had made was a primitive Joly photometer. I decided to take this one step further and construct a 3D printed version especially for use with LEDs. The design uses a thin separator, 1 extrusion width thick, to divide two compartments filled with paraffin wax:
![]()
I printed one, but failed at the first wax casting:
![]()
Even with this lousy construction, it was clear that this approach is flawed for low light levels: too much light is lost due to scattering and absorption in the wax. The LEDs here are running at about 10mA, and are plainly visible, but at very low currents, it's simply not workable. I think with greater care casting the wax, this approach could probably be used for brightness comparisons at relatively large currents, but it's not much use for designing glow markers.
Another reason not to use the human eye as a detector is psychological bias. I'd like to show that this pulsed-LED idea works, and I fear that I might subconsciously skew the results.
Electronic Light Sensors
I have been playing with the VEML7700 ambient light sensor from Vishay. While the VEML700 has good sensitivity, wide dynamic range and a spectral sensitivity curve very closely matched to the human visual system (photopic vision only, unfortunately), coupling LEDs to the sensor repeatably is problematic. Because of the angular dependence of the LED output, and to a lesser extent that of the sensor, the coupling coefficient is sensitive to misalignment - obtaining the same coupling between two LEDs and their respective detectors isn't easy. The usual way to make such measurements angle-independent is to use an integrating sphere, which solves the problem by forcing many "random" Lambertian reflections between the emitter and detector. Builds for spheres abound on the Internet, and a very good reflective coating can be made cheaply with flat latex paint and barium sulfate, but the light "loss" due to the number of internal bounces and the small fraction of light directed to the detector also render this method impractical for low-output sources.
I'll note that for relative intensity or efficiency testing with a single LED, repeatable coupling isn't required as long as the coupling doesn't change over the course of the measurements.
The other possible factor affecting electronic sensors is the high-speed pulses generated by the glow marker circuits. It's not clear yet if the VEML7700 integrates such pulses accurately, and the maximum 800ms integration time would require averaging multiple samples to obtain good accuracy with approximately 50 Hz pulses. Even returning to previous designs I've used, it's quickly apparent that the simple photodiode + transimpedance amplifier circuit often used for "DC" light measurements requires some very careful design to accurately measure pulsed sources like this.
Cameras
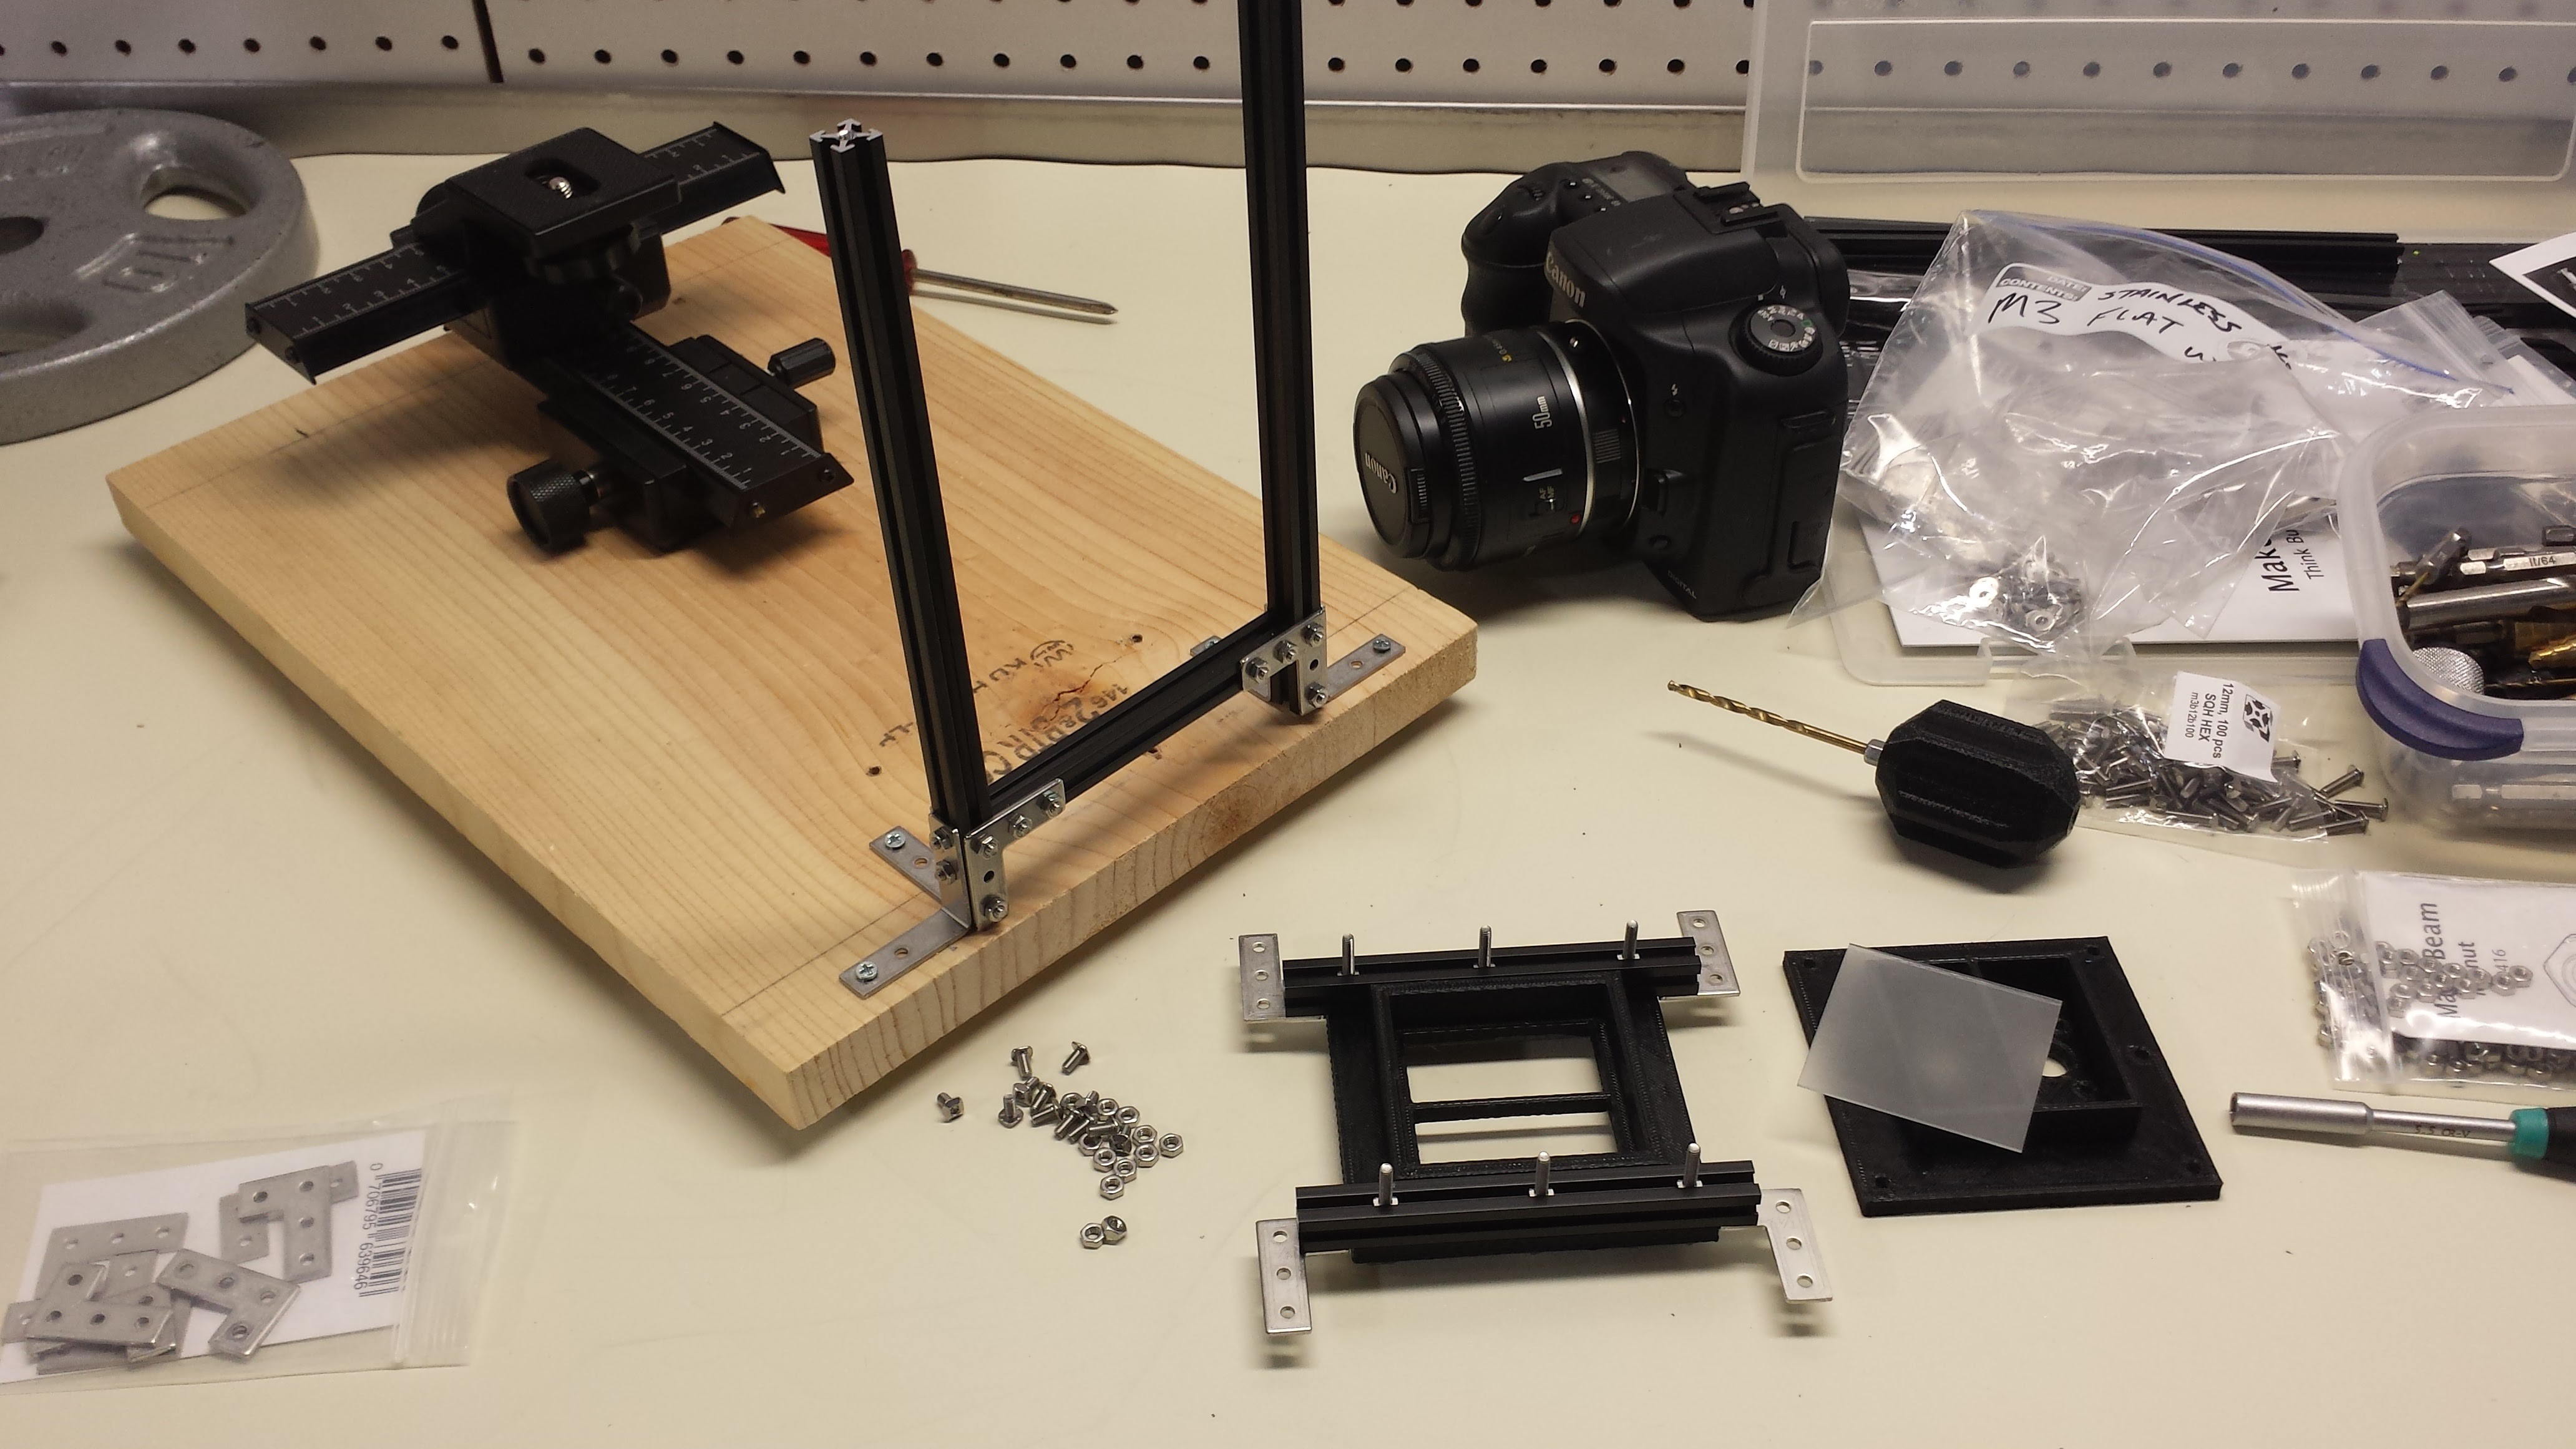
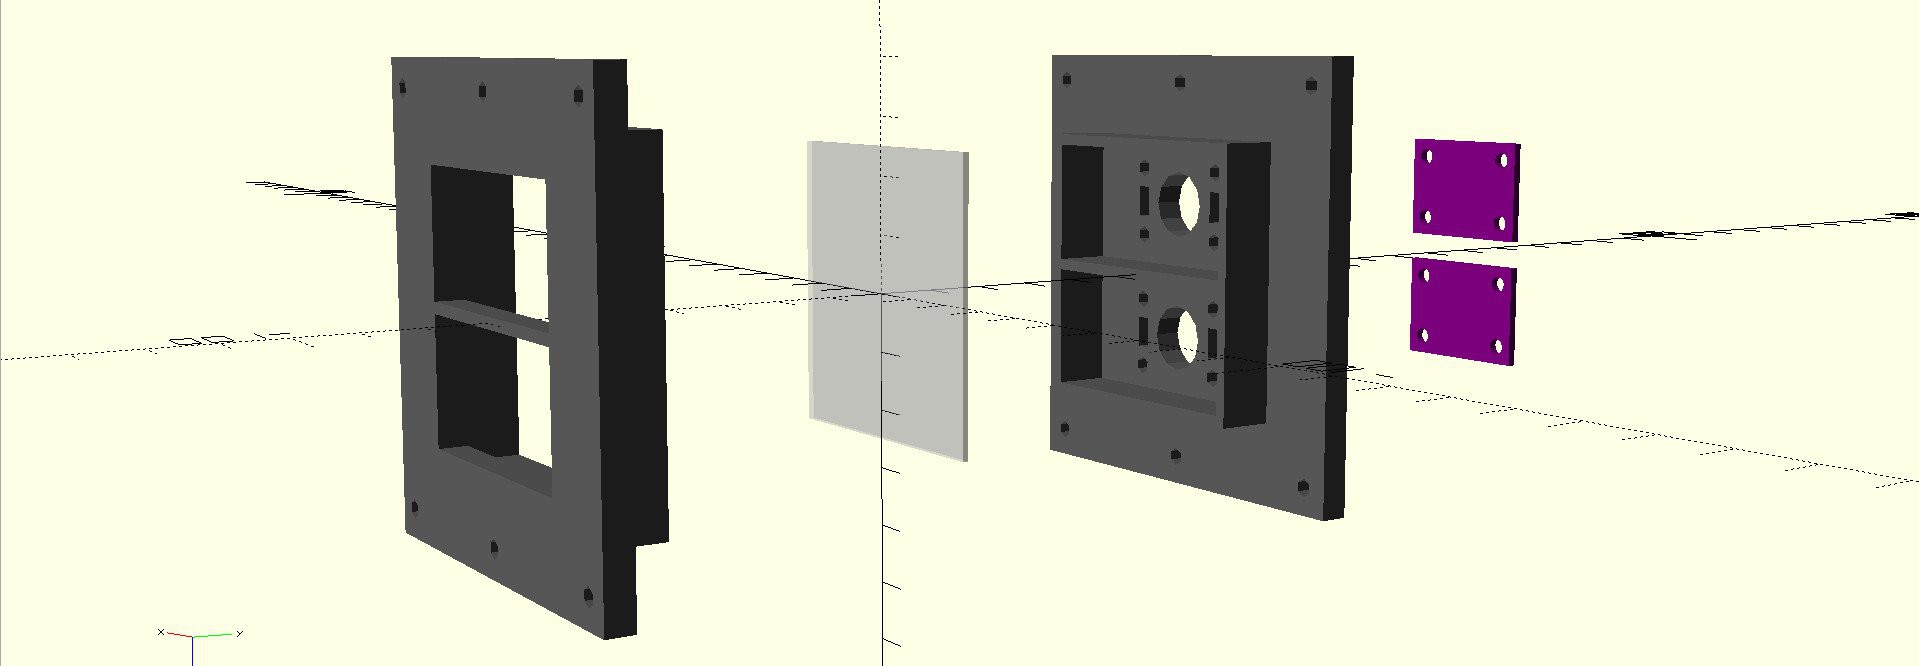
Off-the-shelf DSLR cameras seem like a very good sensor for comparing dimly-lit LEDs. They are quite sensitive, handle long exposure times for integrating pulsed light sources accurately, and are easily calibrated with a series of "dark" and "flat" exposures (more on this later). I decided to go back to my first paper-over-LED comparator idea using a DSLR as the sensor. I designed a comparator cell for 3D printing:
![]()
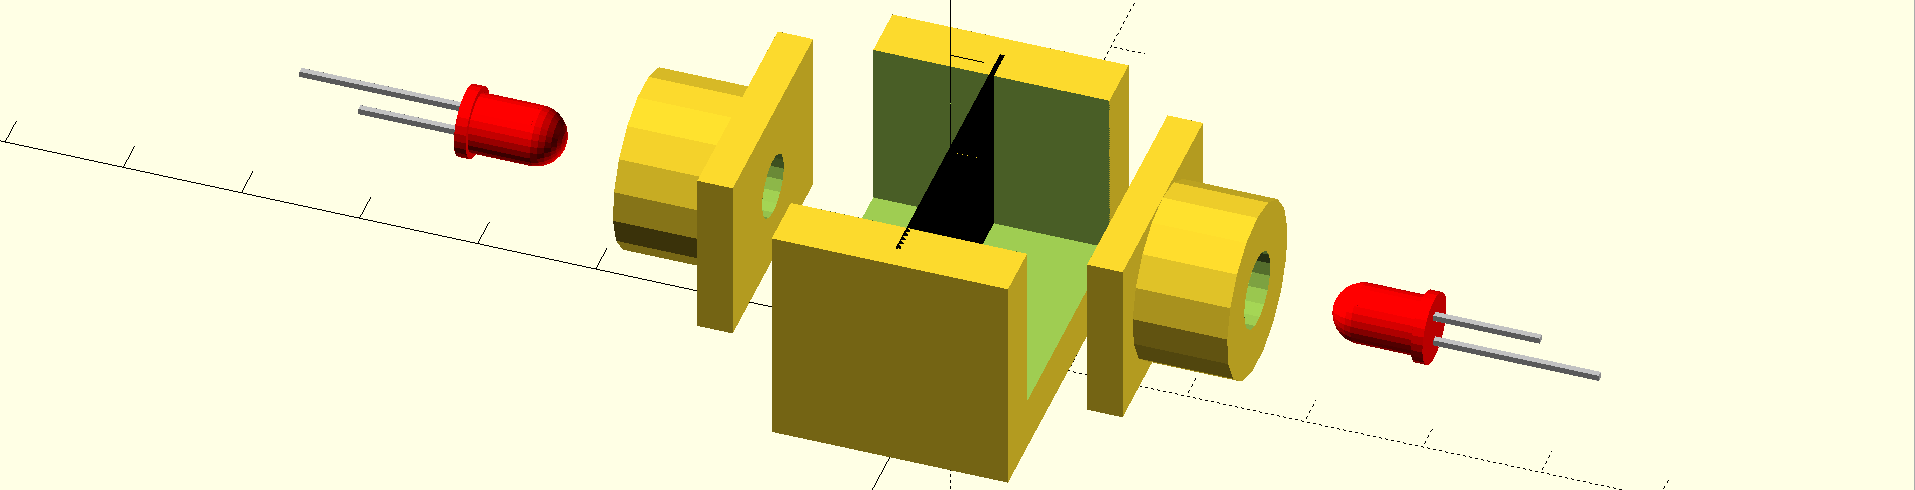
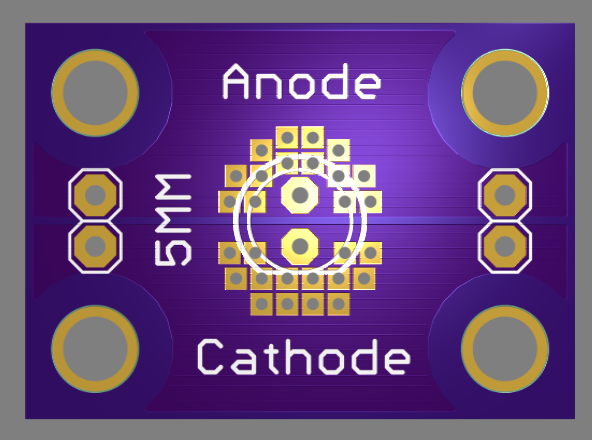
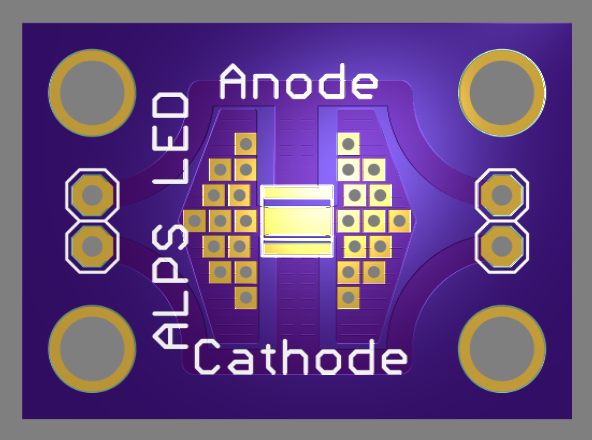
The cell is designed to mount on a MakerBeam frame. The two LEDs to be compared "project" their light onto a 50mm square ground glass screen. The exact fraction of light captured by this method is not important, as long as the two LEDs generate similar patterns (this setup is designed for two "identical" LEDs, not to compare different types). Two LED carrier boards are attached to the rear of the cell. Here's the design for LEDs in 5mm T1-3/4 packages:
![]()
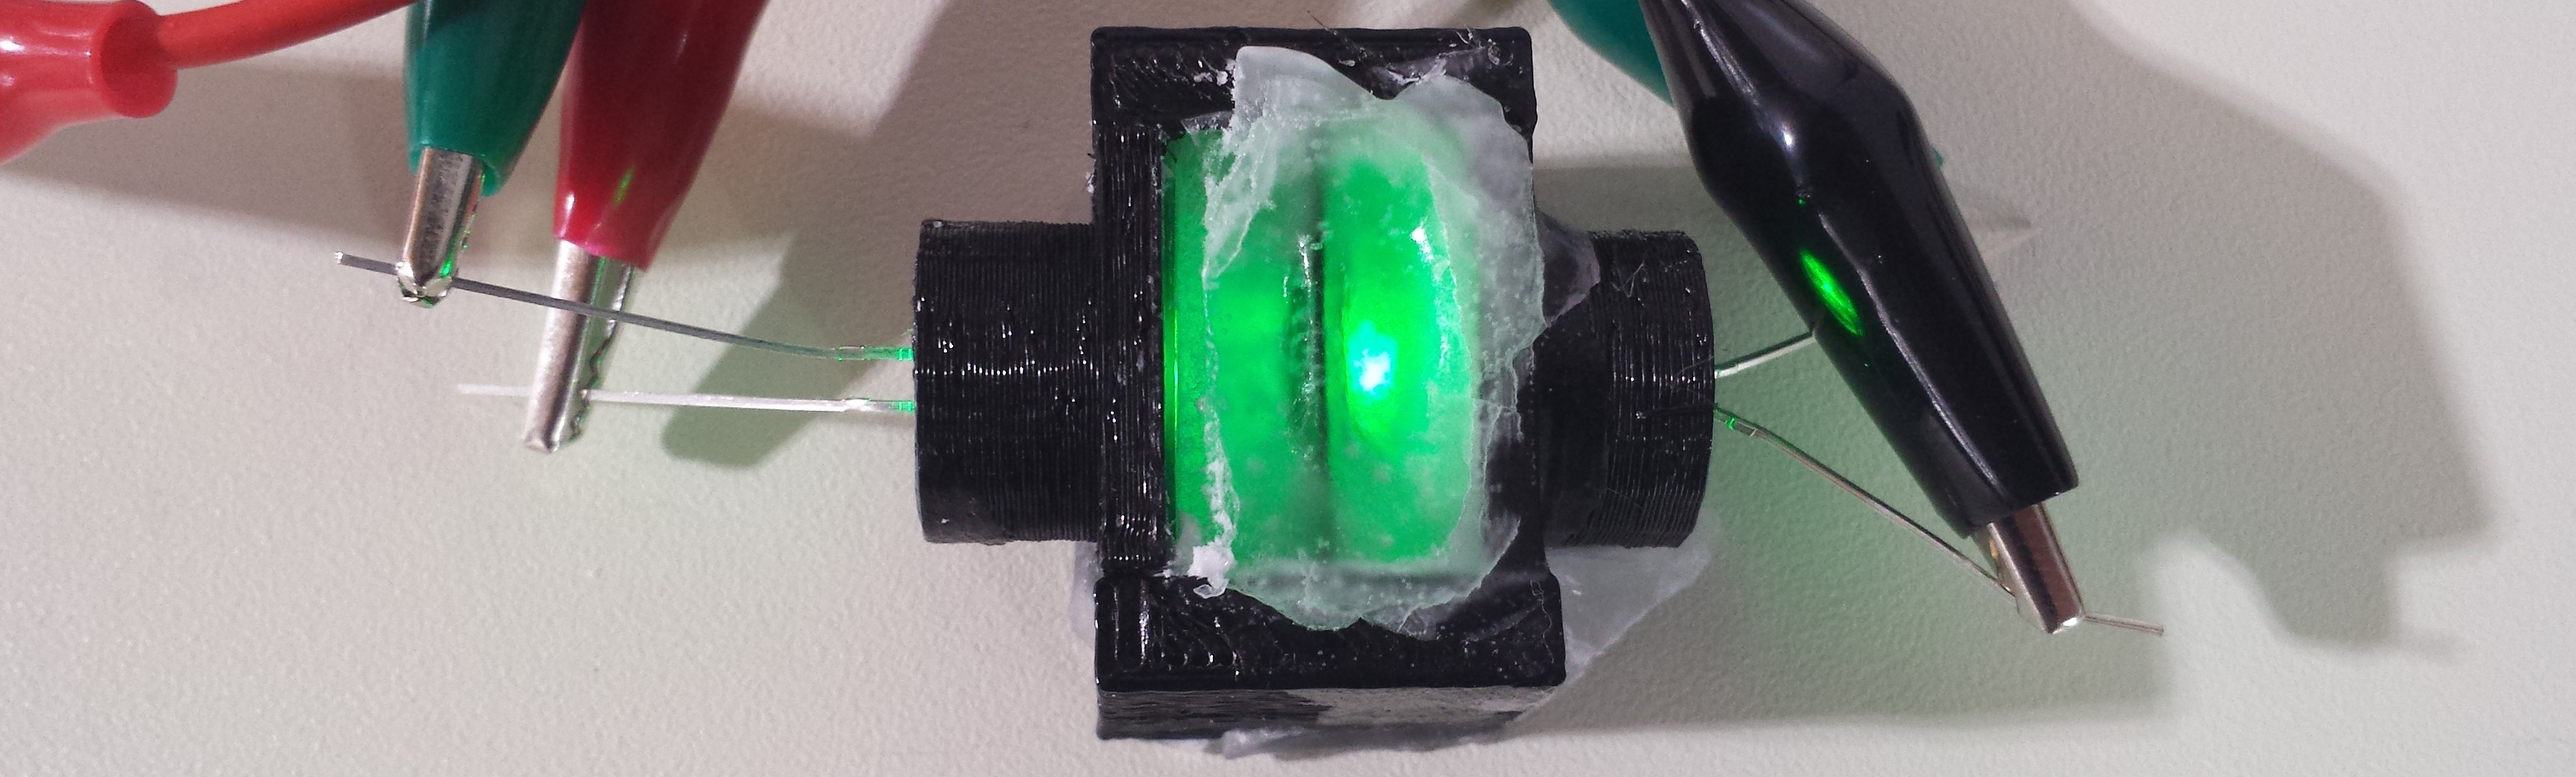
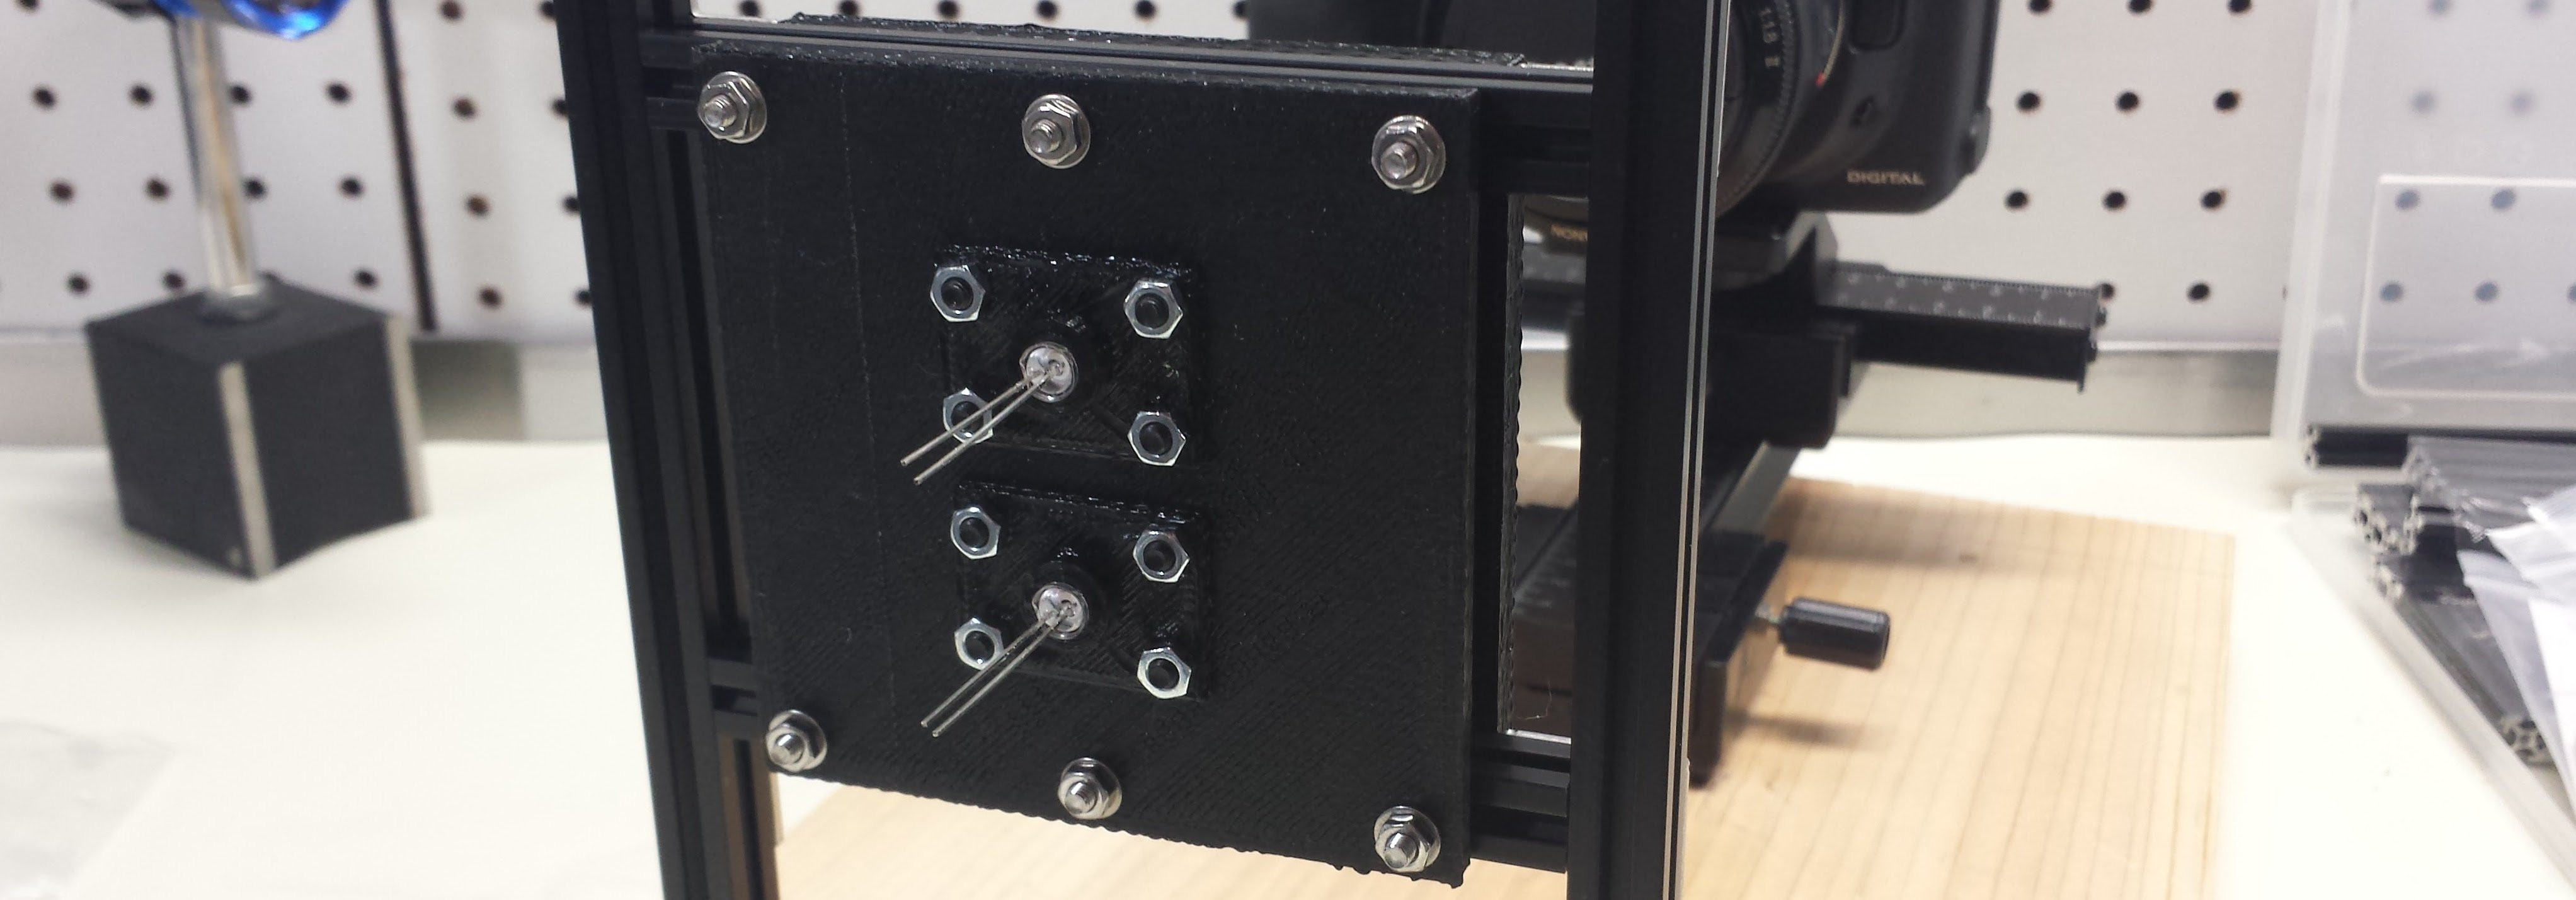
I've designed a number of such boards to carry the LEDs in various packages I intend to test (more on this later). Instead of waiting for the boards to come back from the fab, I printed some "fake" boards to hold 5mm LEDs for testing:
![]()
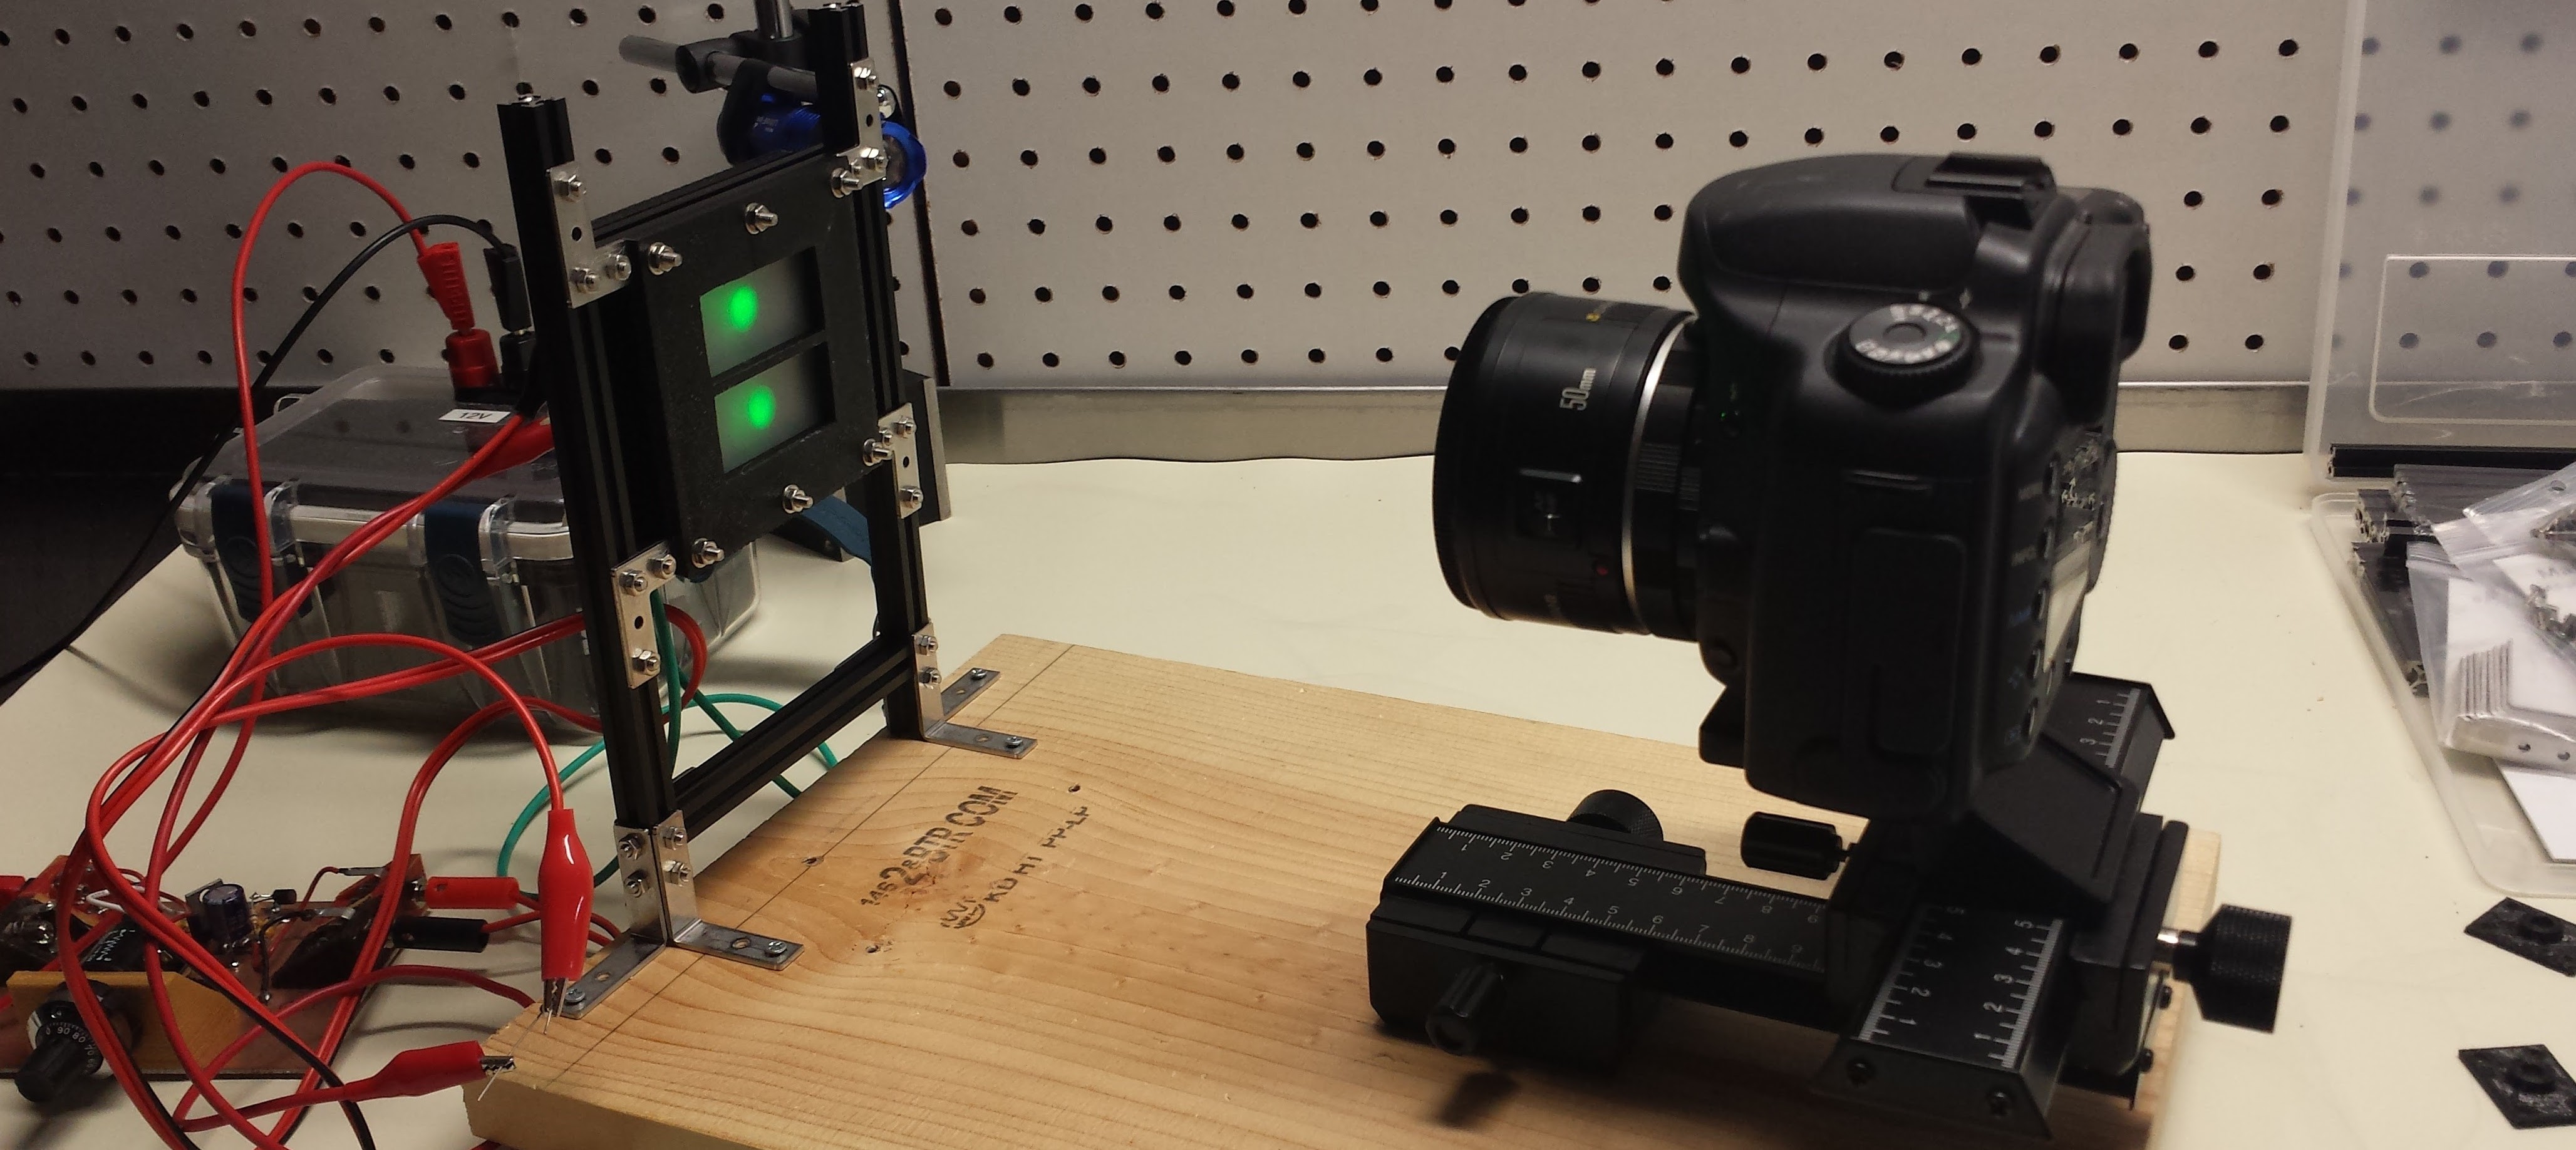
Here's what the whole assembly looks like:
![]()
A Canon EOS-10D is fitted with a 50mm f/1.8 lens and a macro spacer ring to allow it to focus on the close screen. The LEDs are cranked up very bright for this photograph - in practice, they are much dimmer, and the whole assembly is covered with a cardboard box to block ambient light. The camera can be operated remotely over USB (1.1 ! - it's an old DSLR).
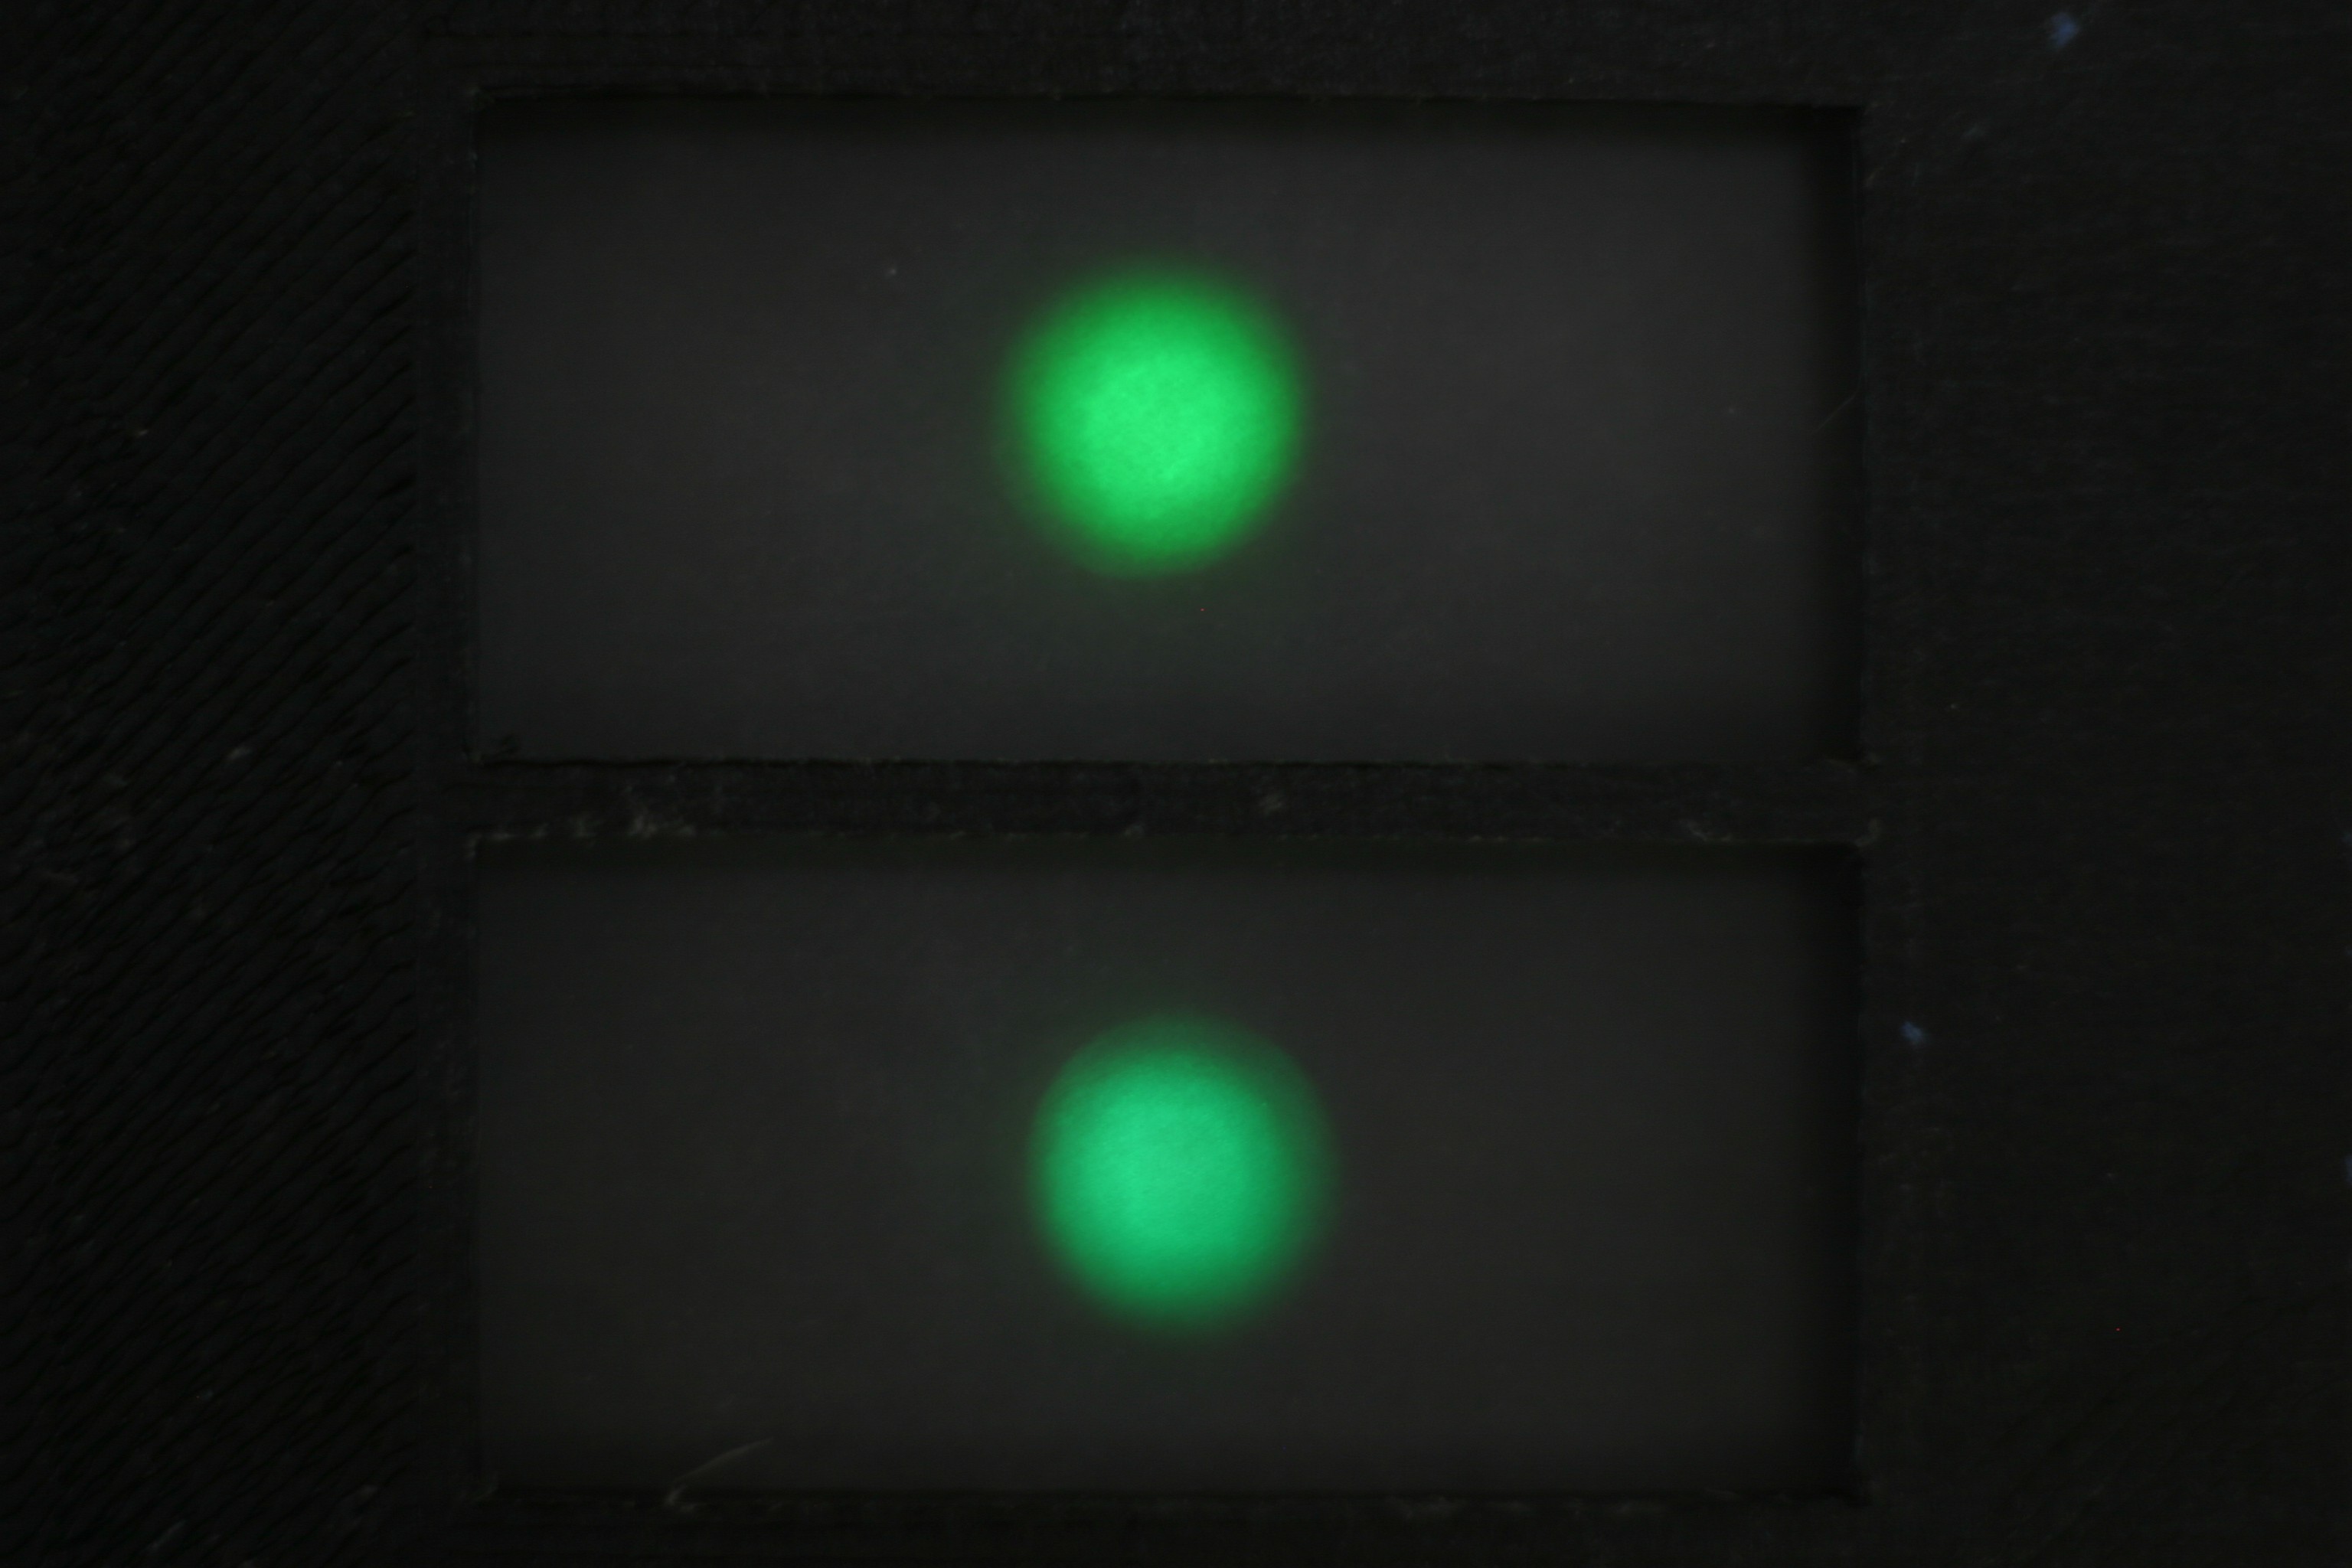
Here's a sample image captured with the setup:
![]()
This image was taken in normal room lighting (no cardboard box), and the LEDs were roughly held in place with tape, but you can get the idea. The EOS-10D has a 12-bit ADC, and the linear Bayer-pattern output can be obtained from images taken in "raw" mode then decoded with the excellent open-source dcraw utility. I've done this before for scientific applications, and it works very well. I have yet to write the comparison code, but it should be straightforward: mask off two image areas corresponding to the two LED windows, then sum up all pixel values in each window and compare the results. Any images with saturated pixels (4095 counts) need to be rejected, since this clipping will affect the results.
To get accurate data from the camera sensor, it first has to be calibrated. This problem has been well studied for astophotography, and calibration using dark and flat frames is the norm. A dark frame is one taken with the lens cap on - this reveals the dark-current in the sensor, "stuck" pixels, and amplifier glow, which can be subtracted from the LED images. A "flat" frame is used to calibrate the camera for vignetting of the lens system: image brightness tends to fall off away from the center of the image. To capture a flat frame, a uniform intensity surface is photographed. I ordered one of these LED backlights from Adafruit:
![]() Of course, I don't know how uniform the output from the backlight is, but I can try it in several orientations and positions to see how similar the generated flat fields are. I also found a 10cm square EL panel on ebay to try. Between the two, and possibly a few more sheets of ground glass, I'm confident I can generate decent flats.
Of course, I don't know how uniform the output from the backlight is, but I can try it in several orientations and positions to see how similar the generated flat fields are. I also found a 10cm square EL panel on ebay to try. Between the two, and possibly a few more sheets of ground glass, I'm confident I can generate decent flats.
LED Test Boards
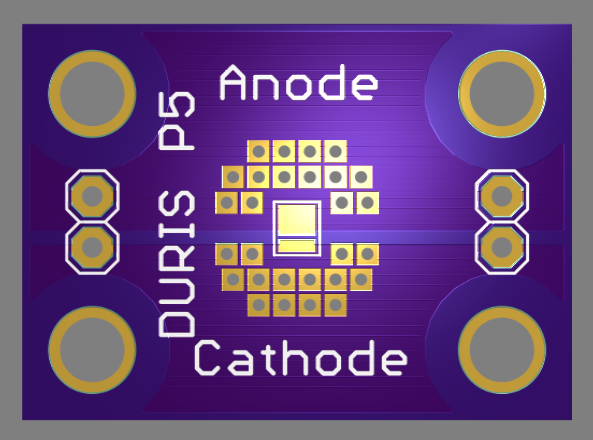
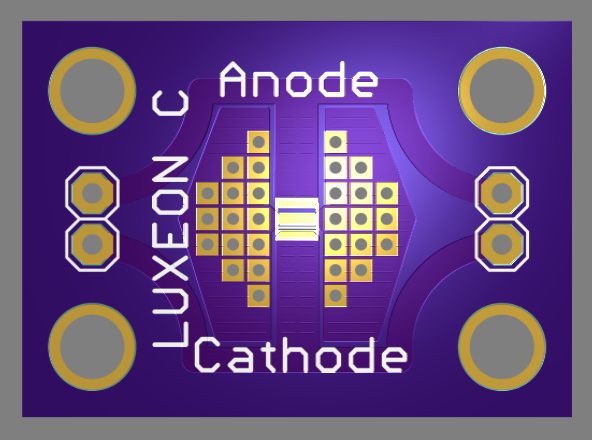
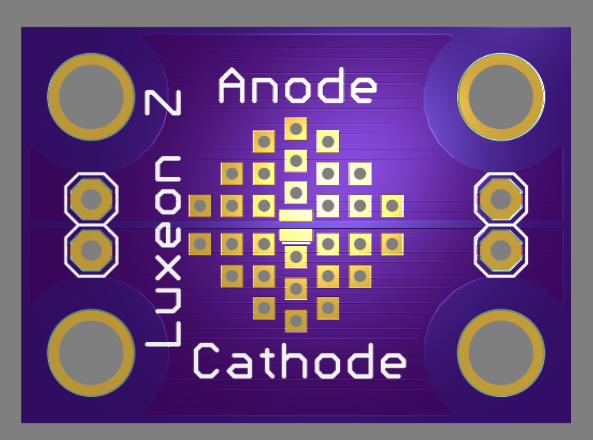
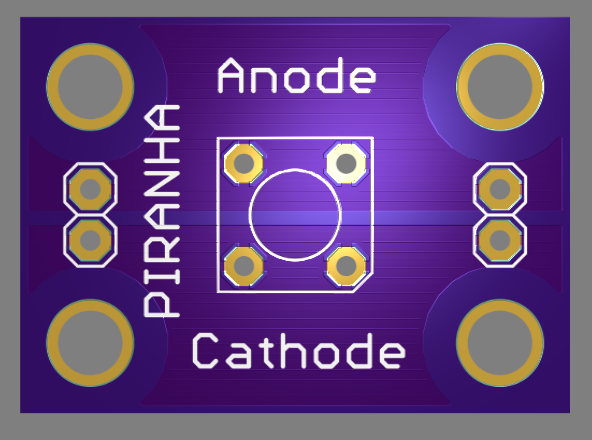
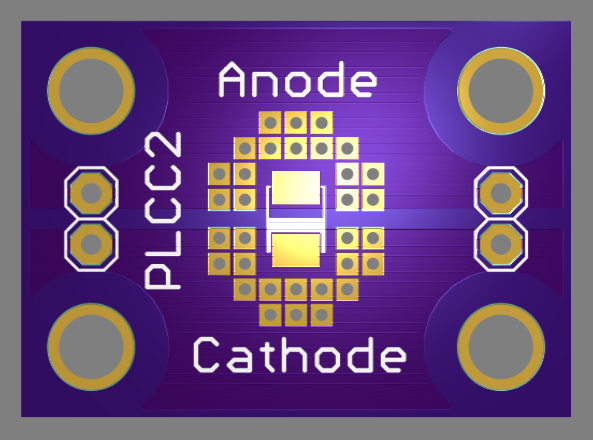
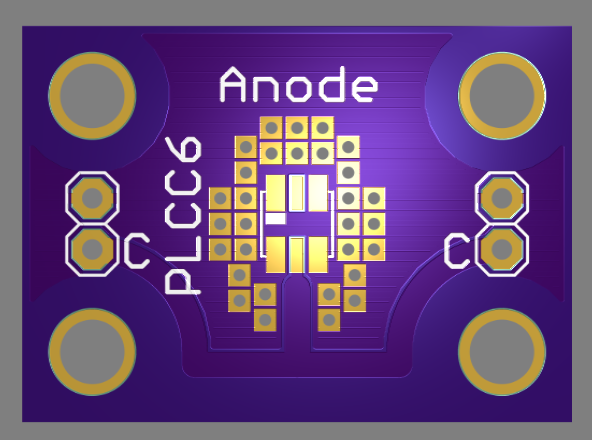
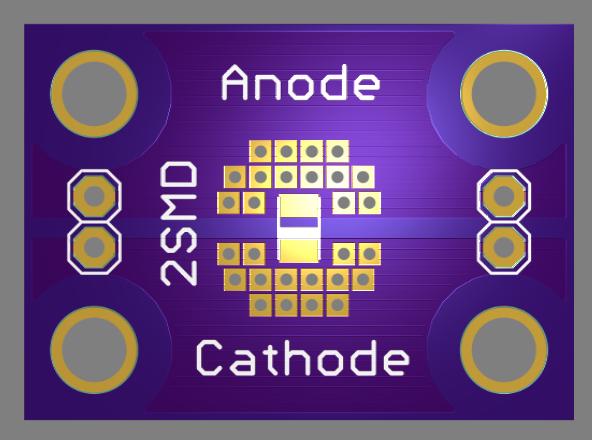
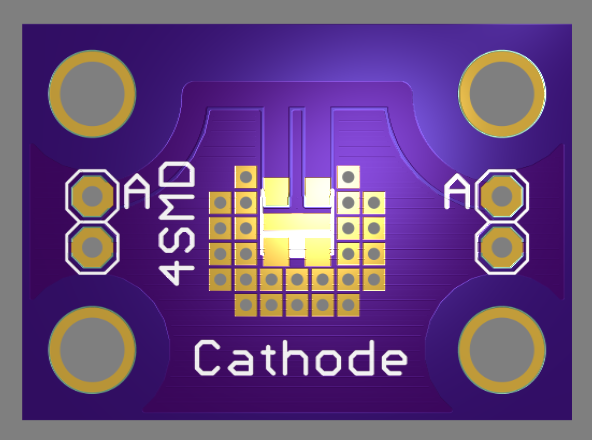
I designed 10 boards to test at least 11 different LEDs (some boards will accommodate several different model LEDs). Here are the other 9 designs, along with the target LEDs (and links to datasheets):
![]() Piranha / Super-Flux
Piranha / Super-Flux
![]() Würth 150141GS73100
Würth 150141GS73100
SunLED XZM2DG45SNext Steps
I have to wait for a lot of boards. My batch of #Ugly SMD Adapters for prototyping the next versions of the pulse circuits were lost by the USPS. OSH Park is rushing a new order for me, but it will still be a little while. The 10 LED carrier boards will take a while, too. In the interim, I can write some software for comparing LEDs and get some mileage testing 5mm parts.
-
(Mechanically) Reading the Datasheet
08/07/2016 at 19:46 • 0 commentsEDIT (8/11/16): I re-plotted this with better data after fixing a bug in my light sensor driver: see addendum.
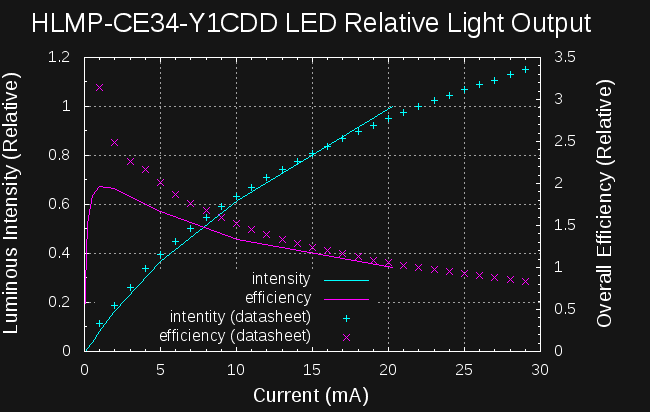
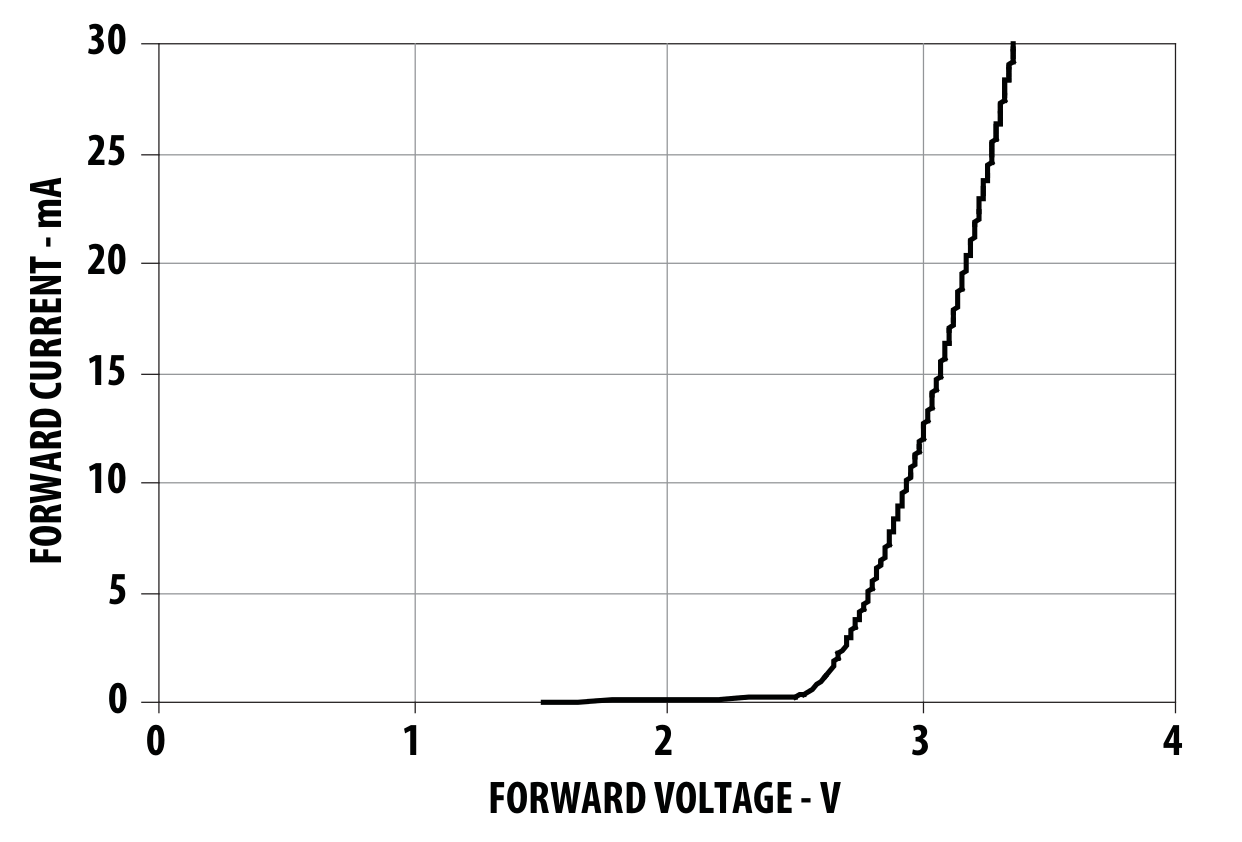
I mentioned that there was enough raw data in the figures on the HLMP-CE34-Y1CDD datasheet to calculate the relative efficiency, at least for larger values of current. As a double-check, I ran a few numbers manually, and the peak efficiency seemed to be there in the data, but I still wasn't fully convinced - this is a new light sensor for me, I just wrote the driver, and a lot of things could have gone wrong. So, this morning, I digitized the data from the plots in the datasheet and ran the analysis on their data:
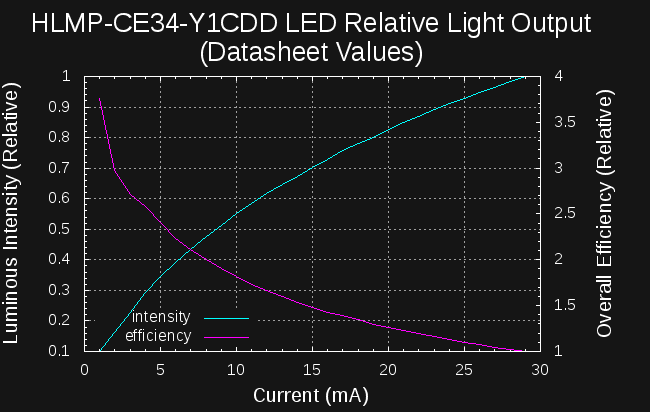
I took screen-shots of the two pertinent graphs from the datasheet, Figure 2 and Figure 3:
![]()
![]()
I used the really nice Engauge Digitizer software to get data points from these images. I had tried similar software in the past, but I like this one the best by far. It was just a few minutes to pull a table of data out of each image. I used a little octave code to invert the IV data and resample onto the same current sample points, then plotted the results:
![]()
The calculated efficiency (using the same formula as before) is indeed greater for smaller currents - the datasheet graphs don't go below 1 mA, so we can't say anything about very low currents, but it's clear from this data that you lose efficiency if you drive this LED with any more than 1mA. The striking thing is that this data suggests an even larger efficiency drop than I measured. Here are the two sets of data on a single plot:
![]()
I normalized the two sets of data so that the curves from the datasheet would match mine at the arbitrary efficiency = 1 point. I'm not sure yet why the datasheet values don't line up better with my measurements - I've never seen a manufacturer's datasheet that didn't exactly match the actual parts before :-)
I does bother me that these curves don't match better, but it would appear to confirm that this LED is most efficient around 1mA.
WTF, LED Manufacturers?
So, why don't manufacturers make the LEDs so that their "normal" operating point (If = 20mA in this case) coincides with the maximum efficiency? Isn't efficiency the whole point of the "LED Revolution"?
When this project was written up on Hackaday, one of the commenters, [rnjacobs] pointed me to this article about LED "droop". The article shows the following plot:
![]() then goes on to say:
then goes on to say:
So why not simply drive the LED at the current density that produces the peak external quantum efficiency? Well, because in order to target the same light output, the area of the chip will have to increase by an order of magnitude, but because the cost of the chip scales with its size − and the chip is a major cost contributor to the device − this would result in more expensive LEDs. So one has to choose between very efficient LEDs at very high costs, or less expensive LEDs with lower efficiency.
OK, so we need to forget about the recommended values in the LED specifications and find the maximum efficiency point for ourselves to design ultra-efficient glow markers. This may also validate my original choice of the Luxeon Z LED, which has a large die area (and correspondingly high cost).Addendum (8/11/16)
I found a bug in my auto-ranging code for the light meter that could produce bad data when changing ranges. I re-ran the experiment after fixing the bug, and obtained the following curves:
![]()
The relative intensity curve now matches much better; the output droop at high current is clearly apparent in the new data. The efficiency curve is also close to that derived from the datasheet, although it's still a bit off. Interestingly, this new data shows about a 2x difference between the efficiency peak (1mA) and that at the recommended current (20mA). The datasheet-derived numbers would indicate a factor over 3x. Some of the difference may be attributable to errors in scraping the data from plots.
-
Microcontrollers 101
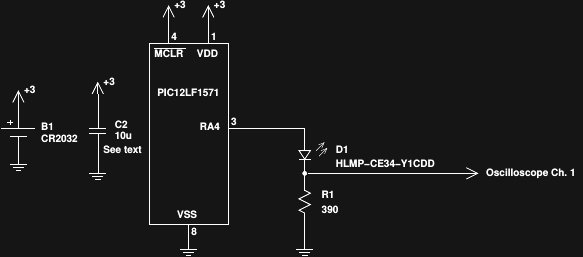
08/07/2016 at 05:13 • 0 commentsBased on the results of measuring the 5mm LEDs, I decided to try a back-to-basics experiment. Here's the PIC equivalent of "Hello, World!":
![]()
I took the hint from Jaromir and used a modern PIC this time. It's a PIC12LF1571 driving probably the first circuit you ever used with a microcontroller: blink an LED with a dropping resistor. Unlike the introductory-course circuit, the resistor here is chosen to drive the LED at its peak efficiency, which I was able to measure last time. The oscilloscope measures 504mV across the resistor during the pulse, equating to 1.29 mA - right at the efficiency peak for this LED.
The PIC runs at 4MHz from its internal oscillator, and wakes every 16ms to generate a pulse. I chose 4MHz to save power - as it turns out, relatively long pulses are required, so super-accurate timing is not necessary.
To test the output, I compared the LED brightness to a DC-driven one right next to it, as Jaromir demonstrated. I found that by darkening the room, then placing a piece of paper over the LED domes, I could more accurately see brightness differences - it's a primitive Joly photometer. I set the DC LED for a number of current settings, then adjusted the pulse width on the PIC until the brightnesses looked equal. Here's what I observed:
DC Current PIC Current Ratio Pulse Width Pulse Current 10 μA 4.6 μA 0.46 8 μs 1.29 mA 20 μA 5.6 μA 0.28 19 μs 1.29 mA 50 μA 12.7 μA 0.254 97 μs 1.29 mA 100 μA 56.1 μA 0.561 662 μs 1.09 mA You really see two different effects here. At the 10uA DC level, the LED is abysmally inefficient, but the PIC version has the microprocessor overhead dragging it down, so you can only save about half the power with the pulsed version. At the 100uA DC level, the LED is starting to become reasonably efficient, so the PIC gain isn't that great - again, you save about 50%. In between the two extremes, at the 50uA DC level, the pulsed version consumes only 25% as much power. If this level of illumination is sufficient for your task, you can gain 4x the run-time.
The pulse current droops a bit during the 662us pulse - long wiring and not enough capacitance on the breadboard. I added a 330uF Al-polymer cap to smooth the supply out for the last test.
At 100uA DC (or 56 with the PIC), these LEDs are pretty bright - more than enough to read by in a dark room:
![]()
This simple circuit does pretty well for itself, as long as the battery stays around 3V. The forward voltage of the LED at 1mA is around 2.5V, so there's not much headroom. Lithium batteries have a fairly flat discharge curve, but CR2032's aren't typically considered "dead" until 2.0V, which wouldn't light these LEDs at all. For that reason, I don't think the simple circuit here is useful as a practical glow marker. Instead, it demonstrates the value of designing for peak LED efficiency. If the same can be done for the other topologies I've been thinking about, then those will probably see a similar improvement.
Just for reference, a CR2032 battery would run a 4.6uA device for over five years. Of course, this circuit would cut out long before then as the voltage dropped, but it's a hint that the run-times might be extended considerably from the 1 year of Version 1.0.
-
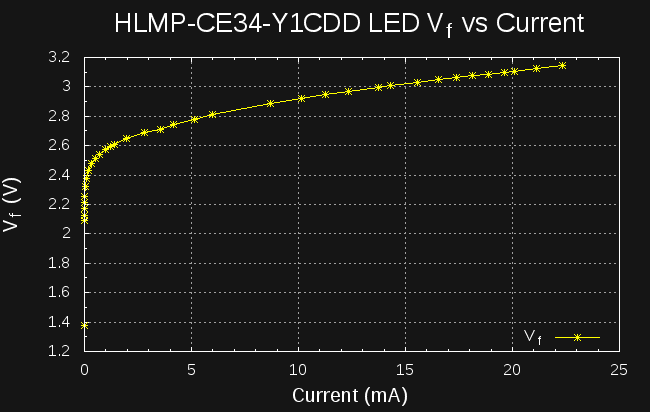
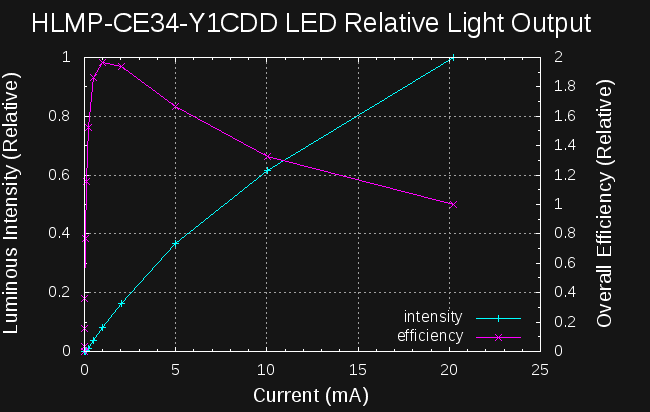
HLMP-CE34-Y1CDD Efficiency
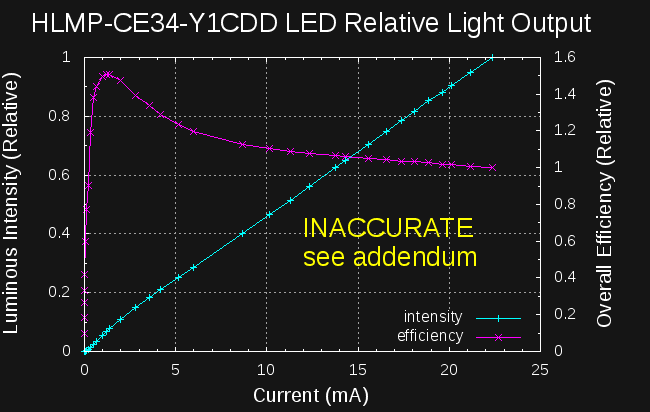
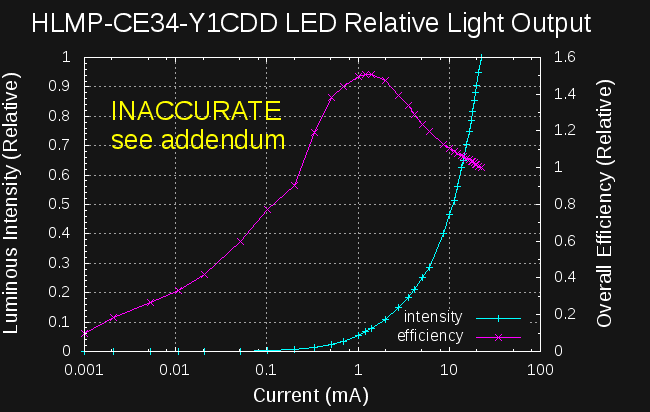
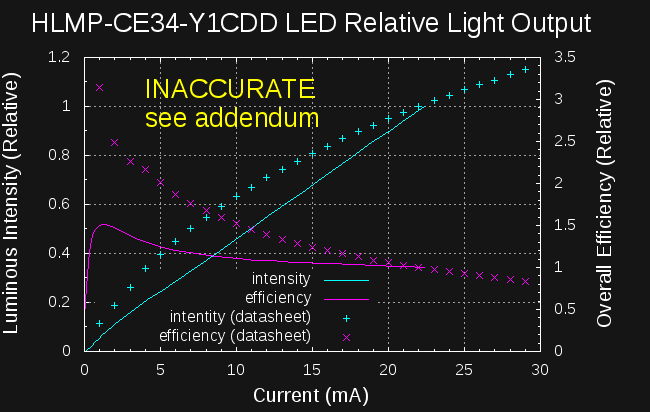
08/06/2016 at 18:03 • 0 commentsUPDATE 8/11/16: I re-ran these measurements and obtained better data: see addendum.
By sheer luck, perhaps, I happen to have some very similar LEDs to those that Jaromir tested in his recent experiments. My version, the HLMP-CE34-Y1CDD, is listed on the same datasheet, and seems to differ mostly in having a 30-degree viewing angle vs the HLMP-CE14's 15-degree angle. This, of course, decreases the mcd rating, since the light is fanned out over a larger area. I believe the dies are identical, however, except for wavelength or output binning. This means that efficiency measurements should translate between the two parts, so I measured one of the eight I have.
I printed a simple coupler to hold the 5mm LED near the sensor, and collected data as I had done for the cyan Luxeon Z LED before:
![]()
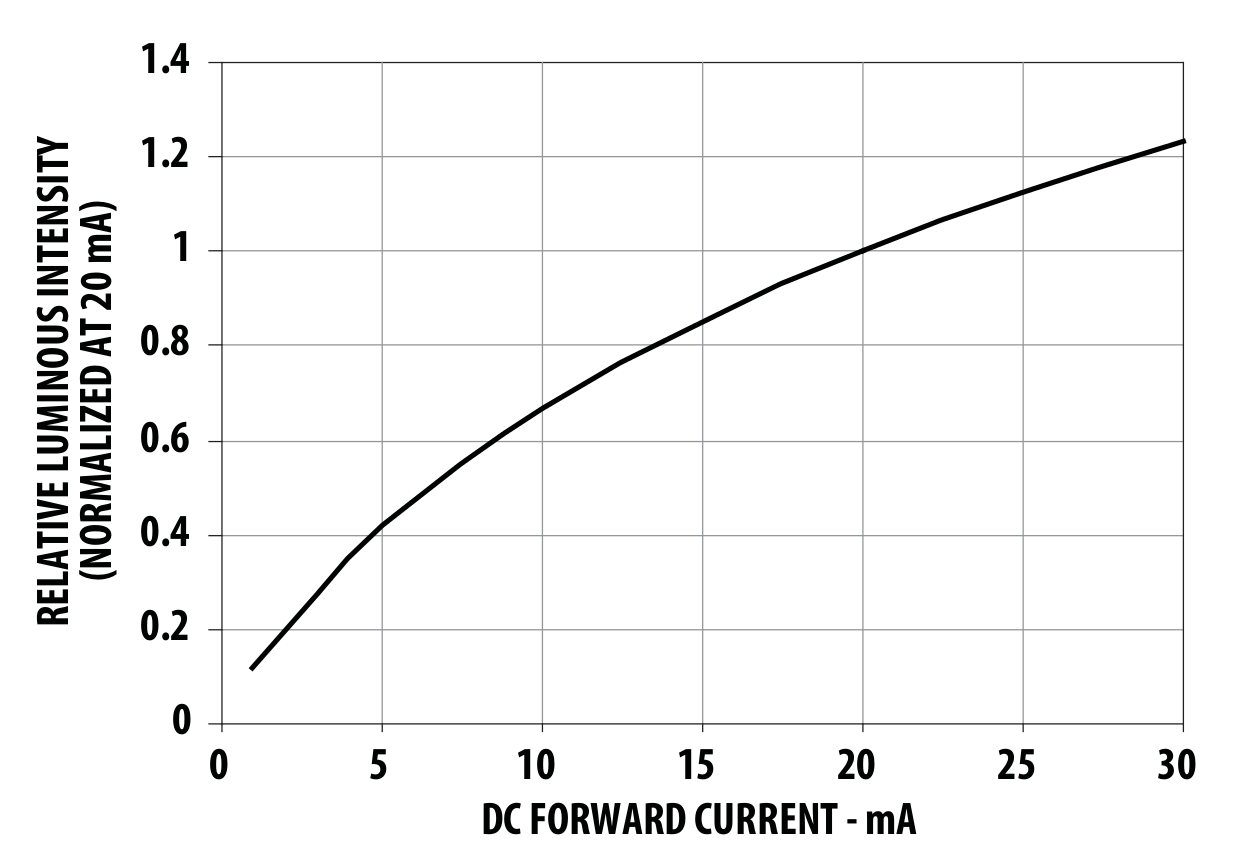
Here's a linear-scale plot of the relative intensity and efficiency. The intensity curve looks pretty linear with current, although you can see a breakpoint in the slope around few mA. It also looks like the peak efficiency is down in the single-mA region:
![]()
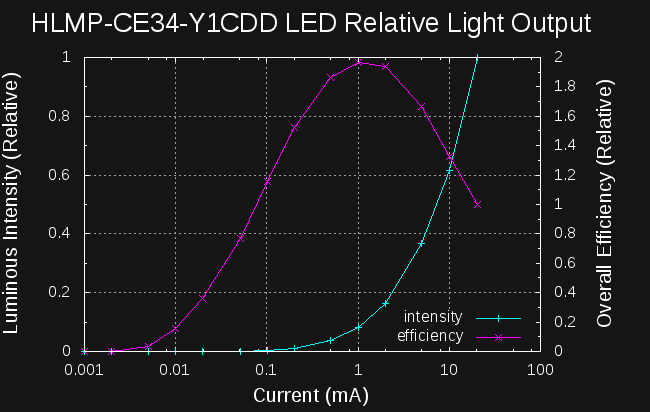
To get a better look, I re-plotted on a logarithmic current scale:
![]()
The efficiency peak near 1mA (probably around 1.25mA looking at the raw data) really jumps out at you in this view. The relative efficiency at 1 mA is around 1.5, while at 10uA it's about 0.3 - the LED is 5x more efficient at 1mA than at 10uA!
I didn't push past 20mA with these measurements, but I don't expect that the curve jumps back up at higher currents.
Something didn't sit right, though. The intensity curve in the first plot looks almost linear with current - why is the efficiency curved like that? It's the Vf increasing with current:
![]()
That's enough to make the difference, since P = VI.
The datasheet has rough graphs of all these values except for relative efficiency. I was able to verify that there's a peak in the few-mA region by choosing a few points off the datasheet graphs and making a similar calculation.
So What?
If this is all true, and you want to get the same output as a 10uA DC-lit LED, you're best off using 1mA pulses at a duty cycle of 1/500. The LED will consume 1/5 the power for the same output. Even without a super-efficient driver circuit, you'll probably come out ahead.
Addendum (8/11/16)
The light meter boards for my automated measurement project came back. While testing them, I discovered a bug in my code that could screw up values when automatically setting the gain and integration times. I've re-run the experiments, and obtained this data:
![]()
![]()
The efficiency peak remains around 1mA, but the output droop at high currents is much more visible in the first (linear) plot.
-
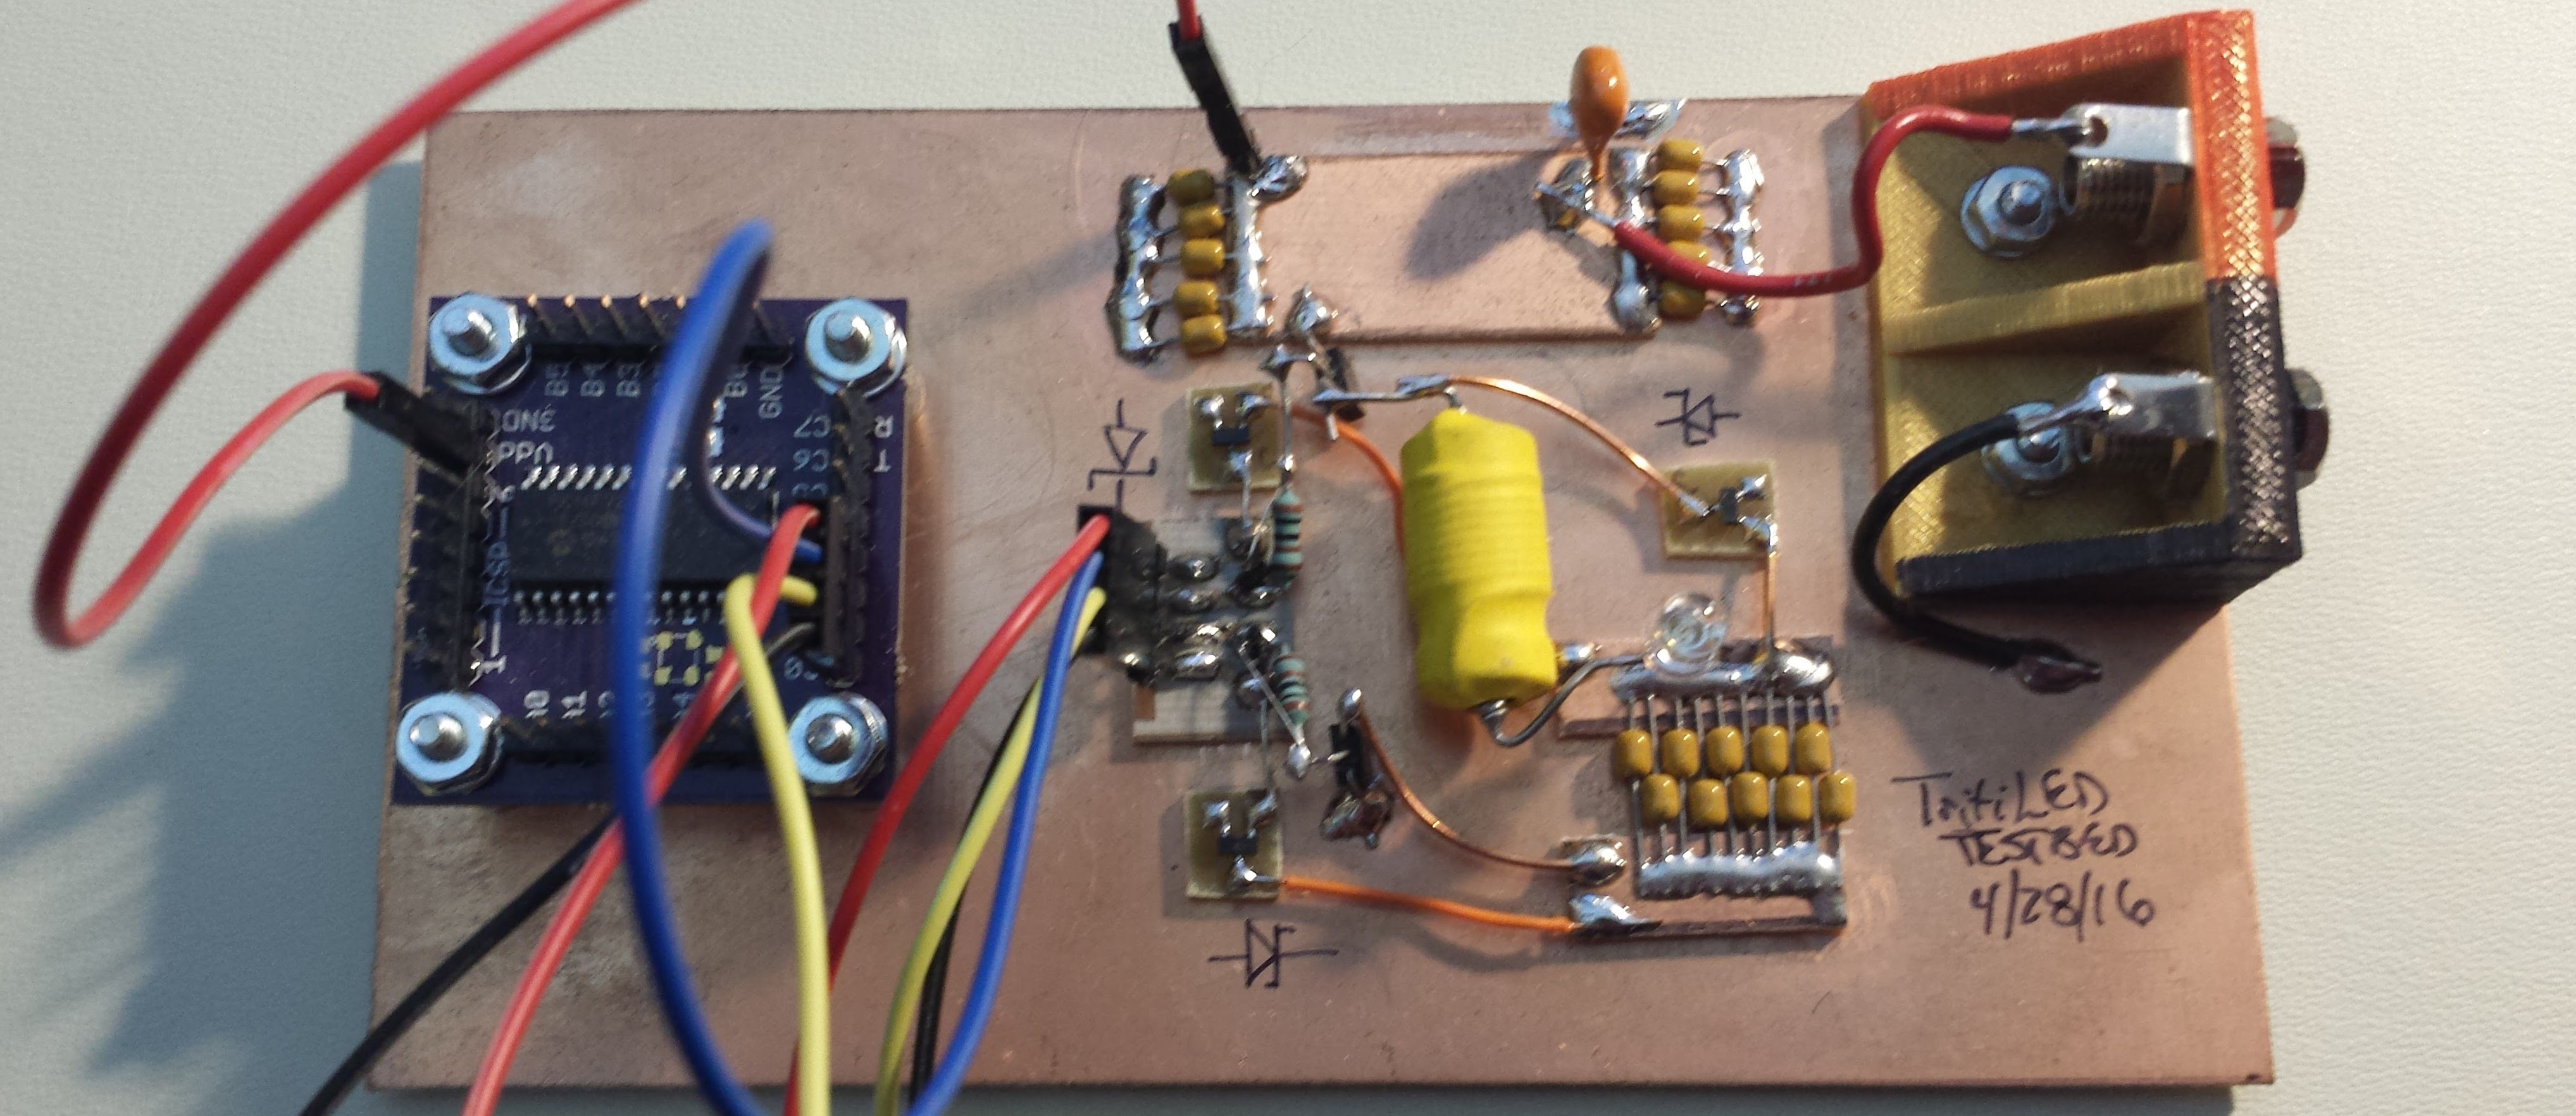
Version 2 Thoughts
08/06/2016 at 05:55 • 4 commentsI actually prototyped a Version 2.0 back in April. I got distracted by some other things - like starting to use hackaday.io - so dropped it for a while. Here's the ugly board:
![]()
As I discussed last time, simply replacing the high and low-side drivers with more efficient MOSFETs is likely to cause more problems than it solves, because the LED current will become difficult to control. But what about replacing the drivers and adding an inductor to regulate the current pulse? Here's the idea (but not what I actually prototyped):
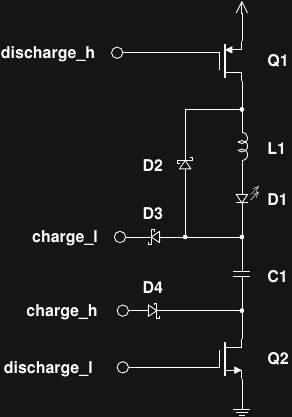
![]()
Q1 and Q2 are low-Rds MOSFETS. L1 and D2 have been added around the LED. While Q1 and Q2 are conducting, current builds through L1 and D1. Once Q1 and Q2 turn off, the inductor current continues to flow through D1 and D2 until the inductor is de-magnetized. The LED current pulse will then be triangular, with the maximum value (and total LED power) a function of the pulse width (assuming the inductor is large enough to stay out of saturation). The integrated LED power is now a function of the square of the pulse width, which might make a variable-output version a little more difficult, but maybe some software on the PIC can handle that.
The four inputs are driven from four PIC output pins. Here are the proposed waveforms:
![]()
During the normal (non-pulse) state, C1 is charged through D3 and D4. Just before a pulse, the charge lines are switched to their respective "off" states to avoid any possibility of shoot-through (imagine what happens if charge_h and discharge_l are both high simultaneously). This "guard" time before the pulse need not be very long. After the guard time, the discharge lines are switched to their "on" states to start energizing L1. Current continues to build through L1 (and D1) until the discharge lines are switched "off" - this forms the first half of the current pulse. At that point, the second half of the pulse consists of the energy in L1 flowing through D1 and D2. A second guard time is shown in the diagram, but it's not strictly necessary, as there's no danger of shoot-through after the pulse.
I called energizing the inductor "charging" and de-energizing it "discharging". Are "magnetizing" and "demagnetizing" the proper words?
Back in April, when I built the prototype, I used ZTX618 and ZTX718 BJTs for the drivers, because I didn't have suitable MOSFETS. The problem with BJTs on both sides is that the base charge storage time stretches the pulse, making it difficult to control the pulse width. I ended up using some Schottky diodes across the base resistors to increase the turn-off speed, but stopped short of implementing full Baker clamps - at that point, it's time to use MOSFETs.
I ended up simulating the BJT circuit in LTspice. Here's how it looks there:
![]()
And the resulting simulated pulse:
![]()
The pulse width is somewhat arbitrarily set in this simulation run, but you can get the idea.
You can download the simulation file for LTSpice here.
I played enough with the prototype to see that it "worked," but not enough to get solid data. I figured that I'd switch to MOSFETs before really evaluating the idea. I have a test PCB with built-in instrumentation mostly designed, but I'm going to revisit it to use some more modern PICs in light of Jaromir's findings about the overall efficiency gain with newer devices. It's time to finish that PCB design and send it out.
TritiLED
Multi-year always-on LED replacements for gaseous tritium light sources
 Of course, I don't know how uniform the output from the backlight is, but I can try it in several orientations and positions to see how similar the generated flat fields are. I also found a 10cm square EL panel on ebay to try. Between the two, and possibly a few more sheets of ground glass, I'm confident I can generate decent flats.
 Piranha / Super-Flux
 then goes on to say: