-
Profiler body testing
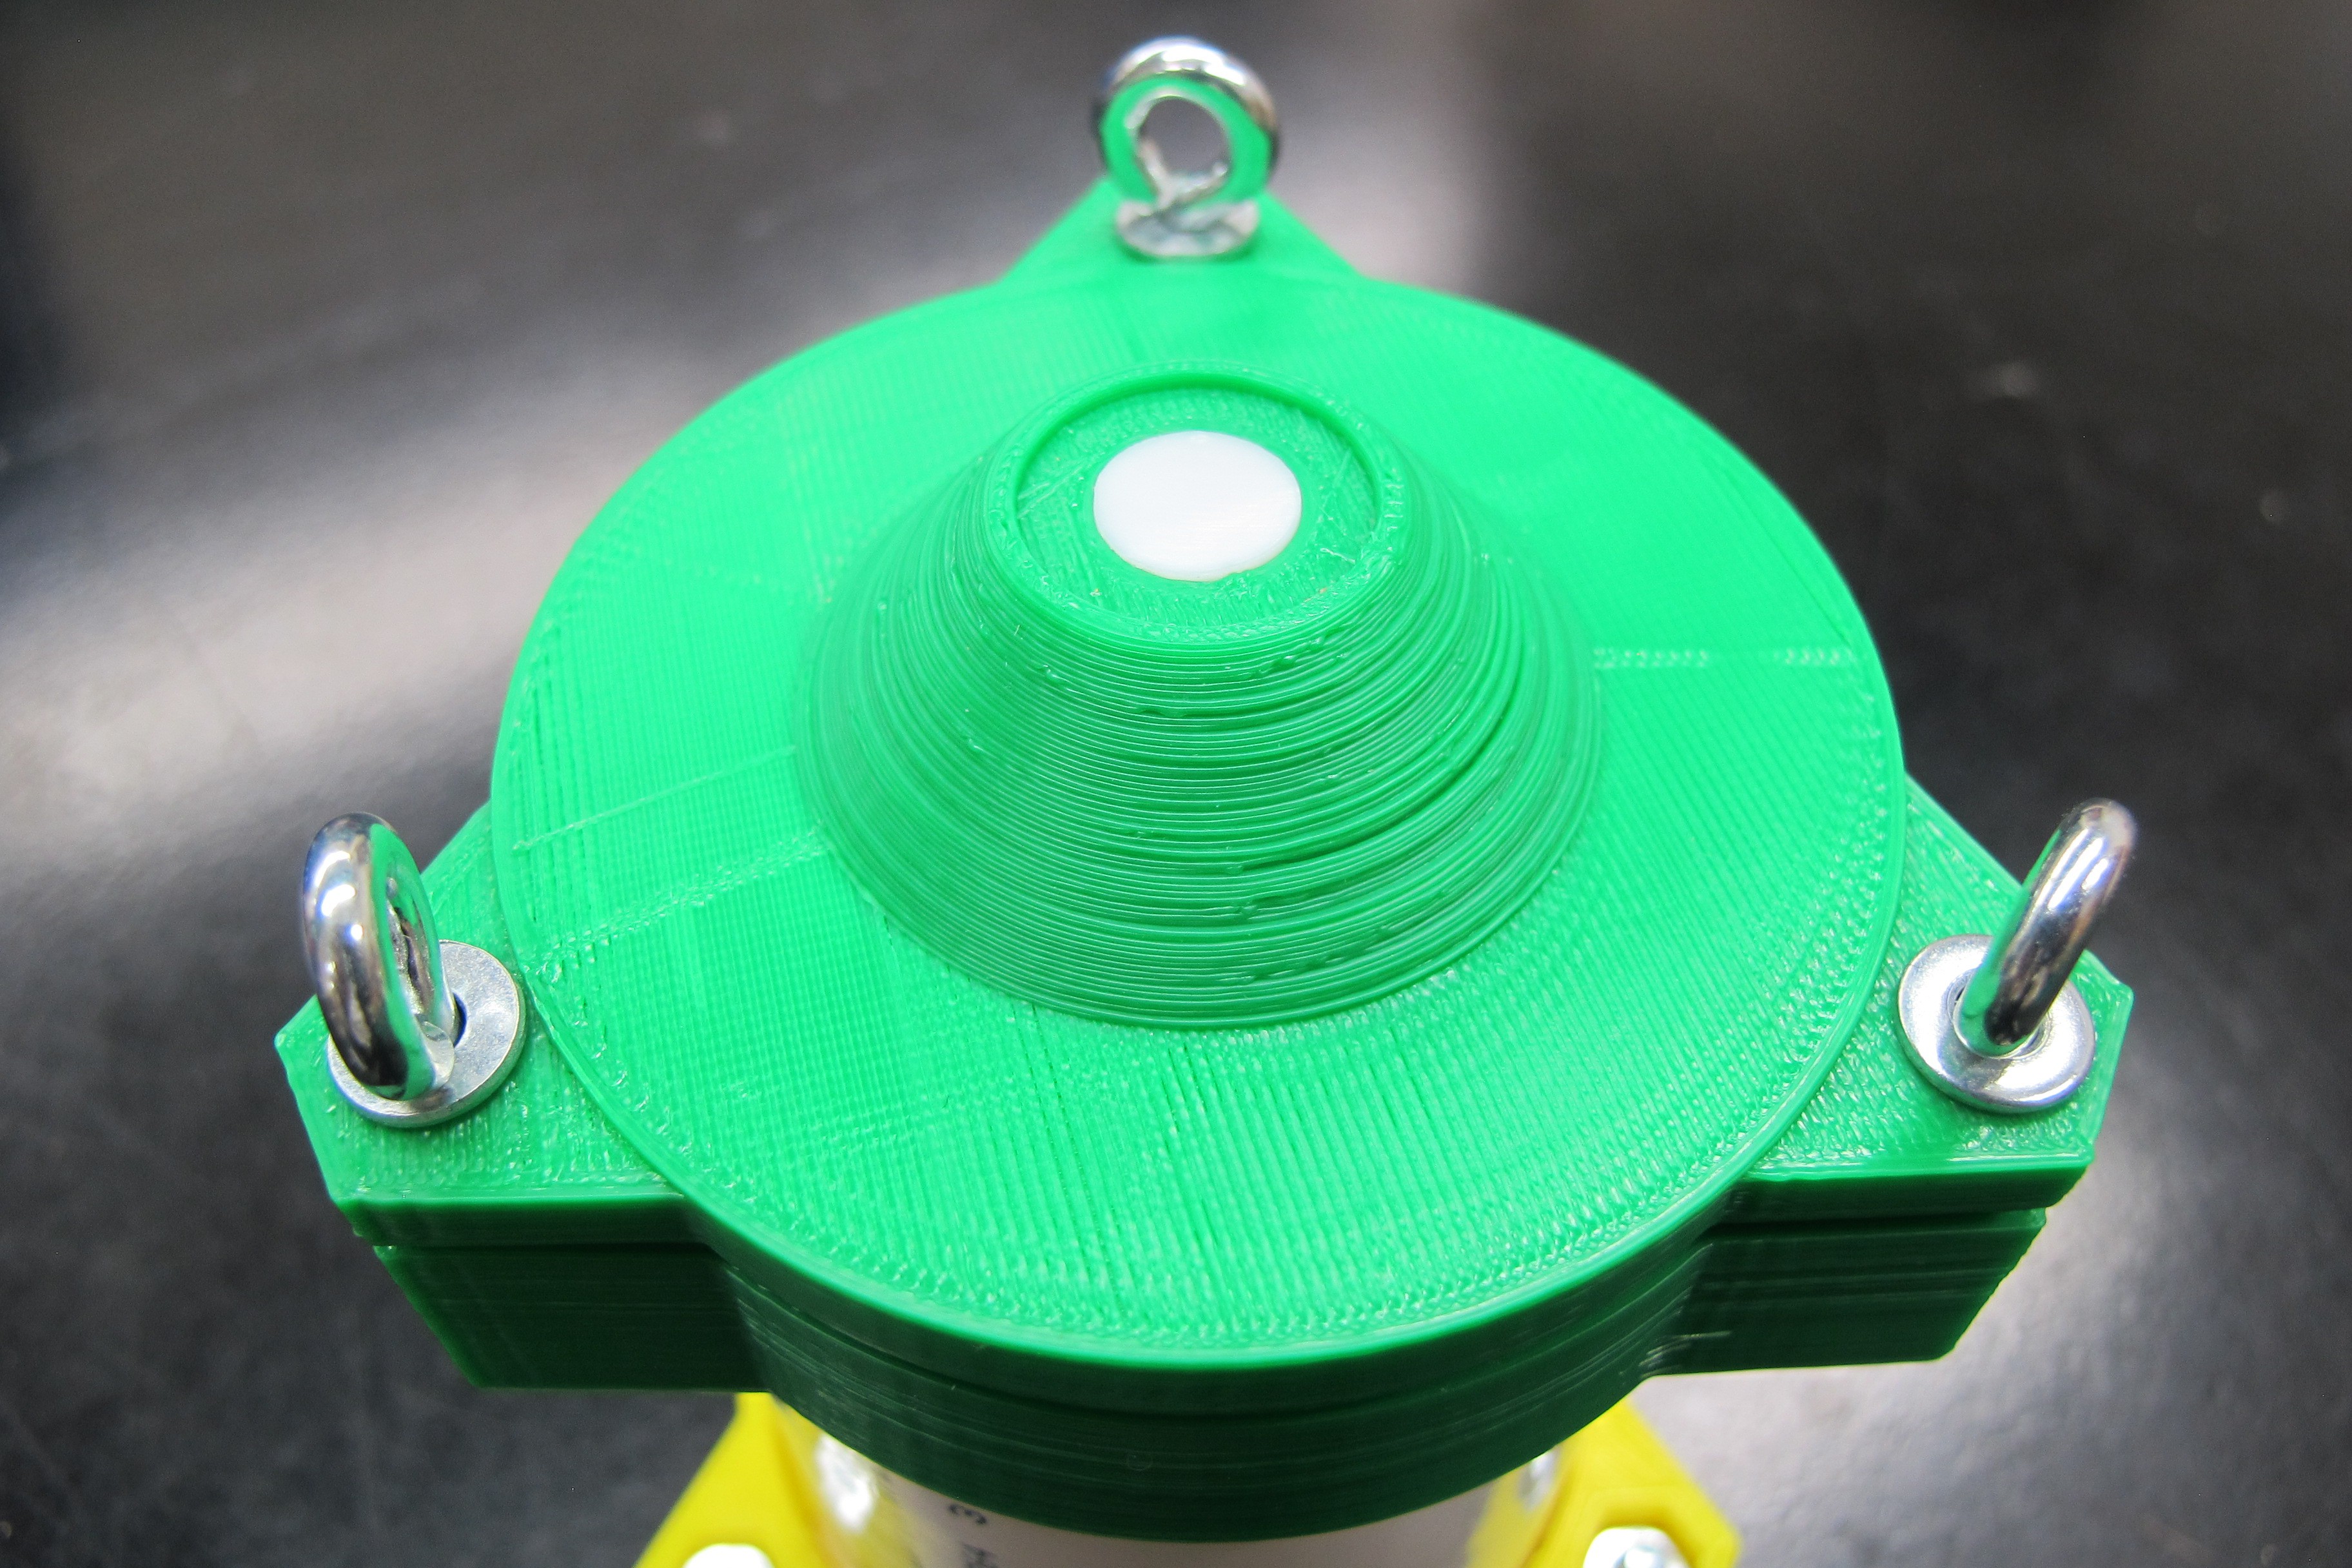
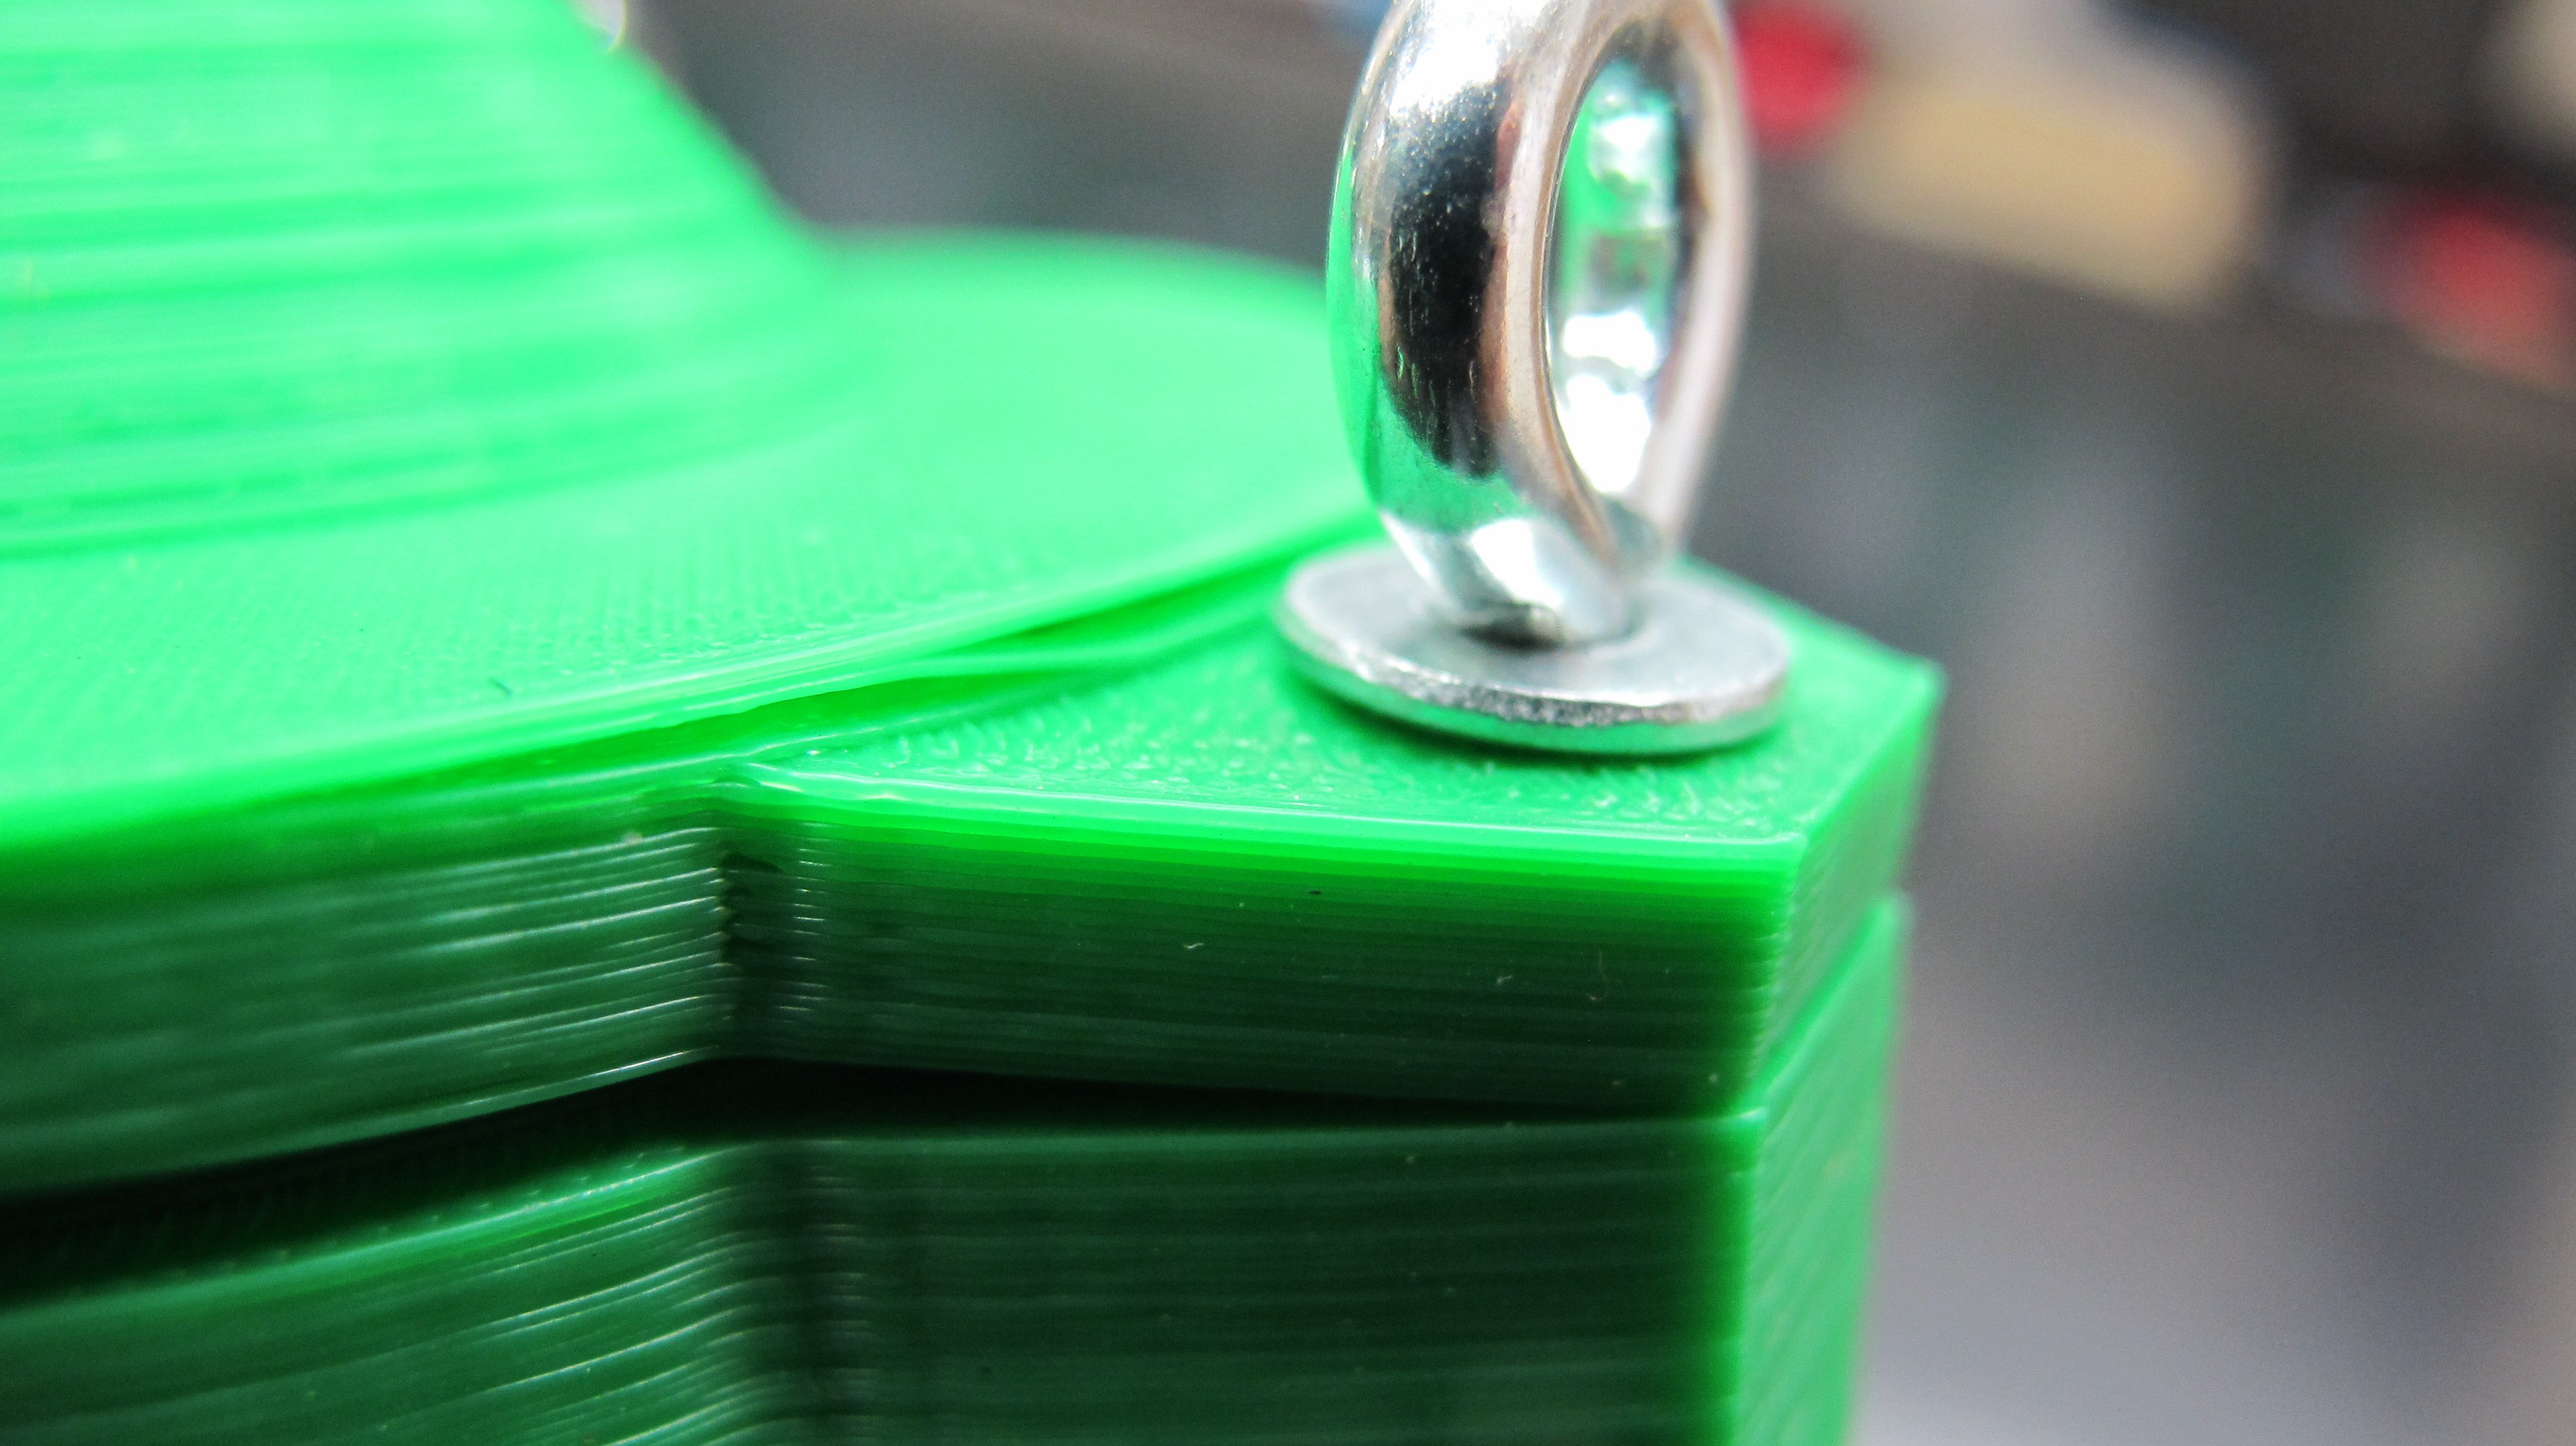
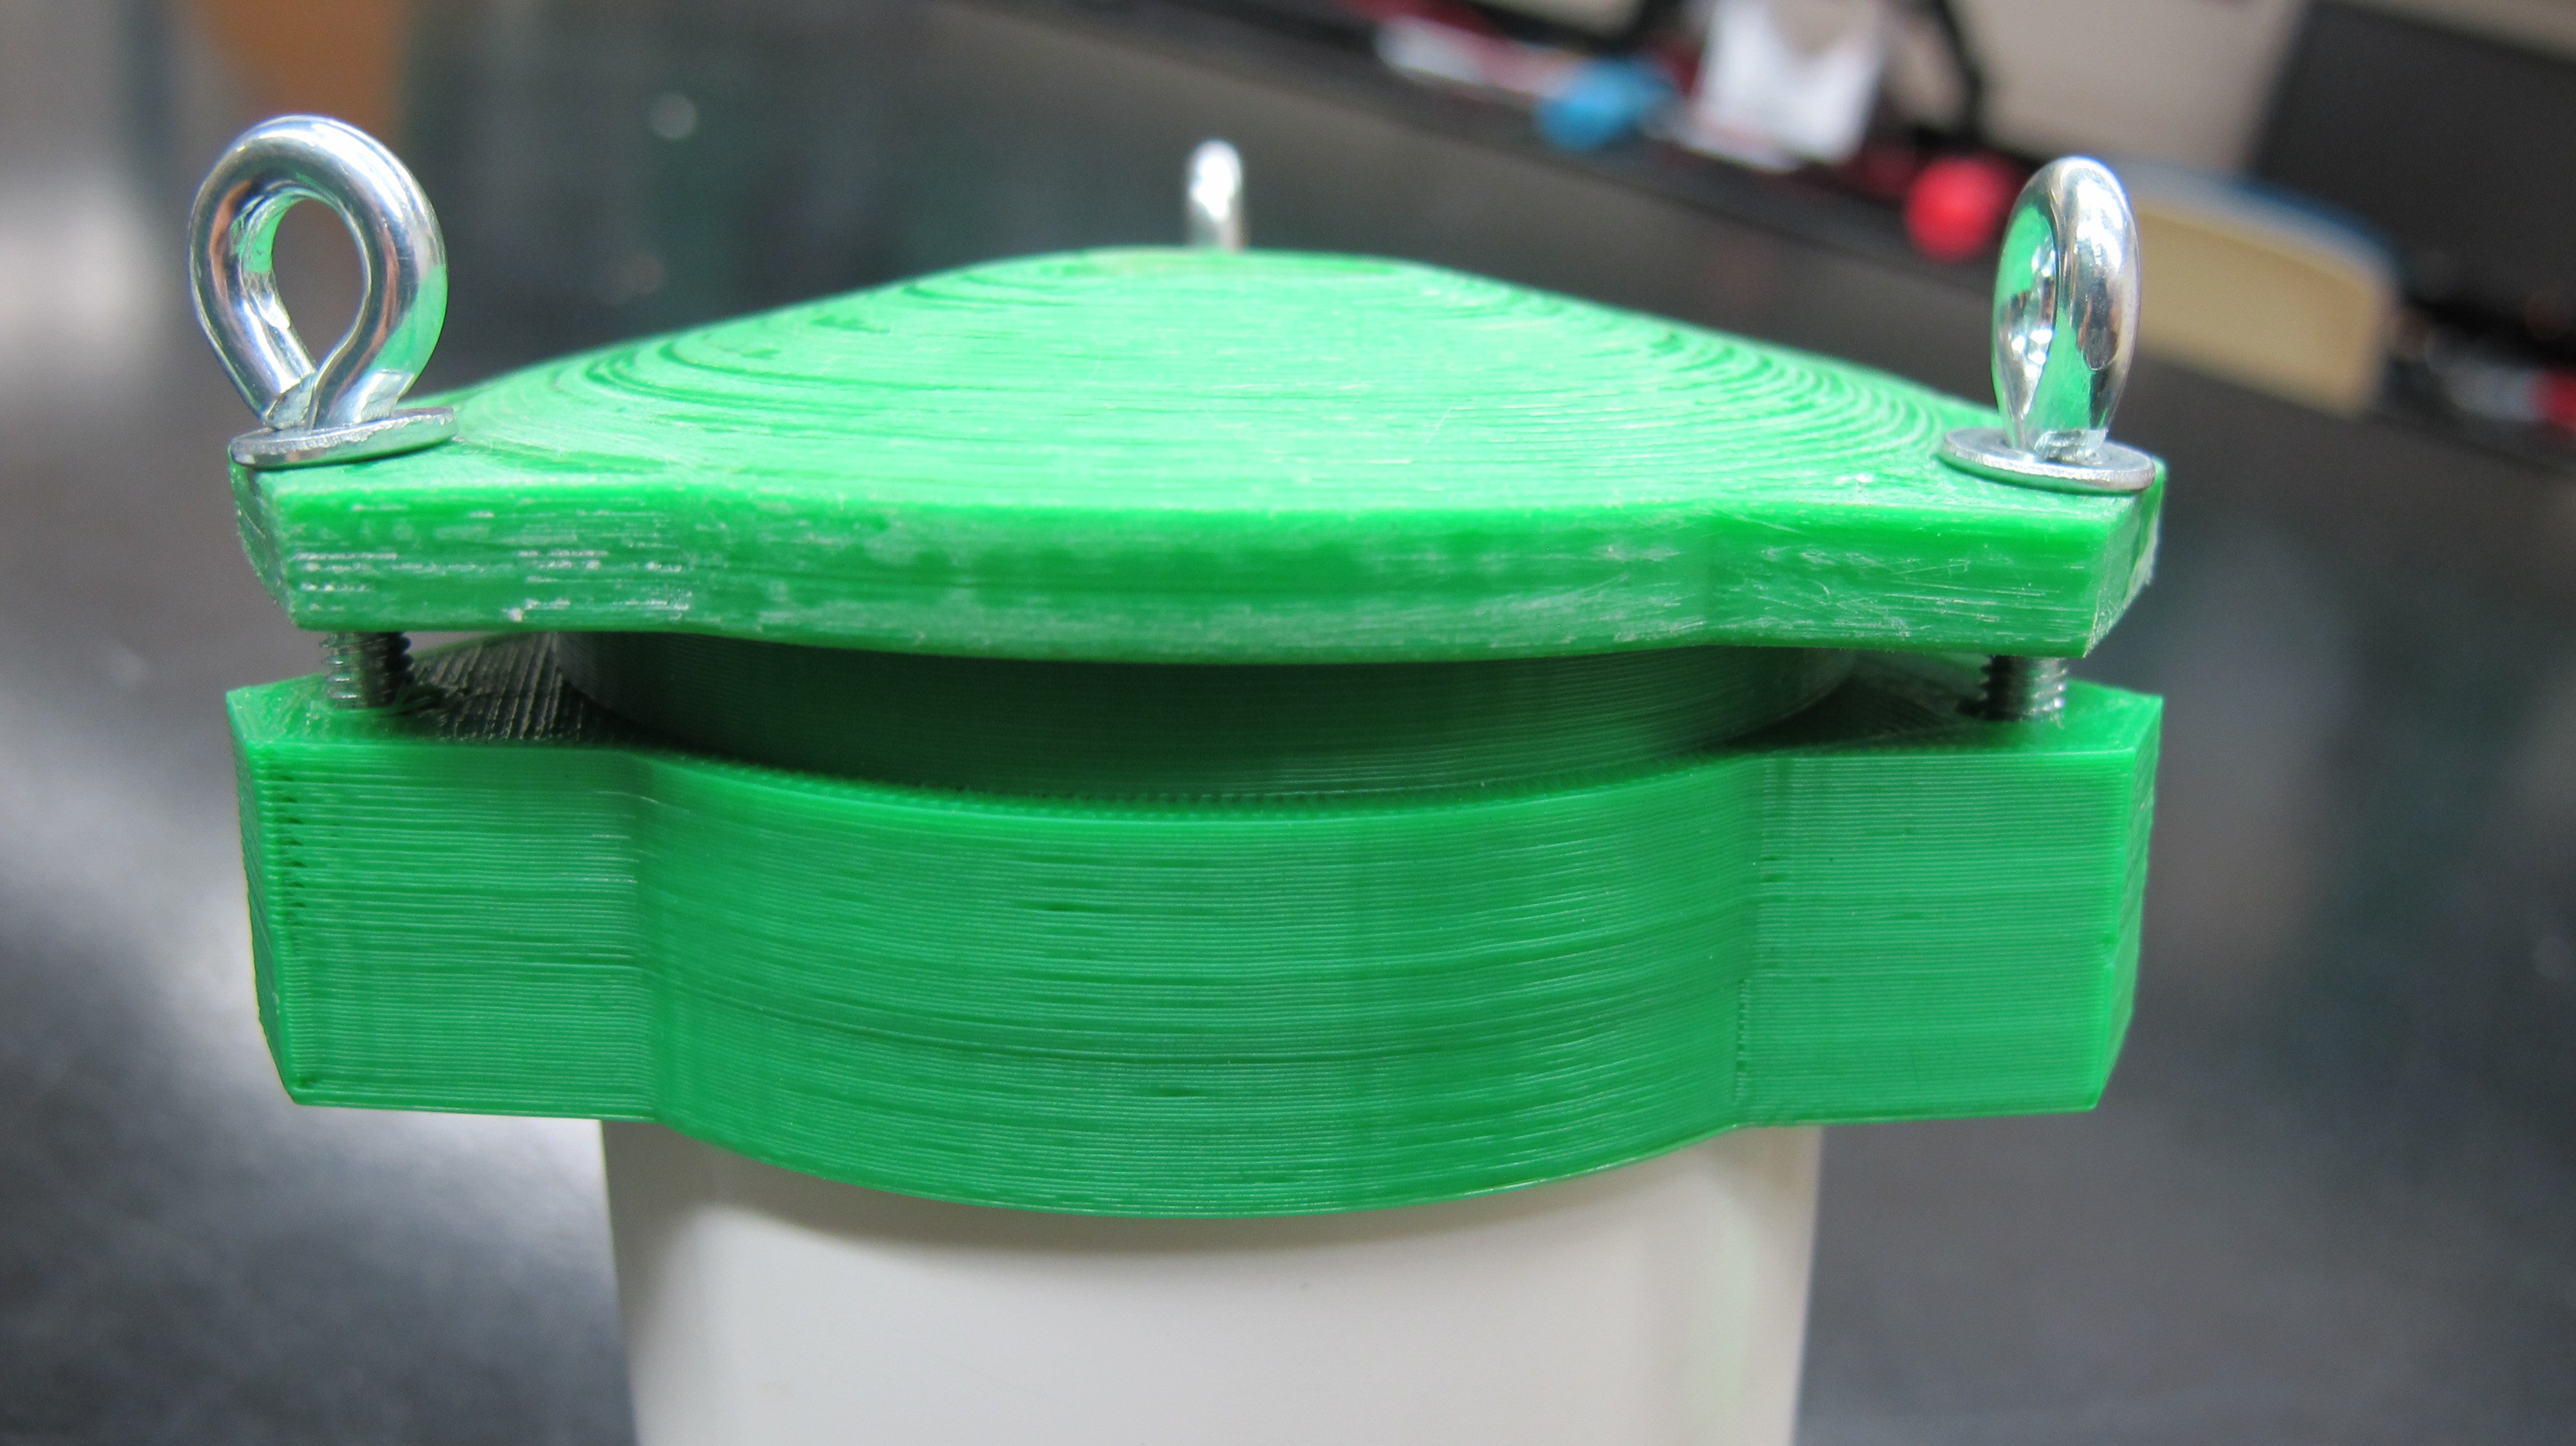
07/13/2016 at 02:38 • 0 commentsShort log here but as I laid out in the project description my plan is is to use 3D printed parts to build the water proof enclosure for the profiler that will contain all the electronics. The base station, which I have not discussed very much will also built with 3D printed parts and needs to be waterproof as well. Several weeks ago I printed some parts using PLA to do some strength and waterproofing tested. The images below show the collar and cap for the top of the profiler which has an opening for the downwelling irradiance sensor.
![]()
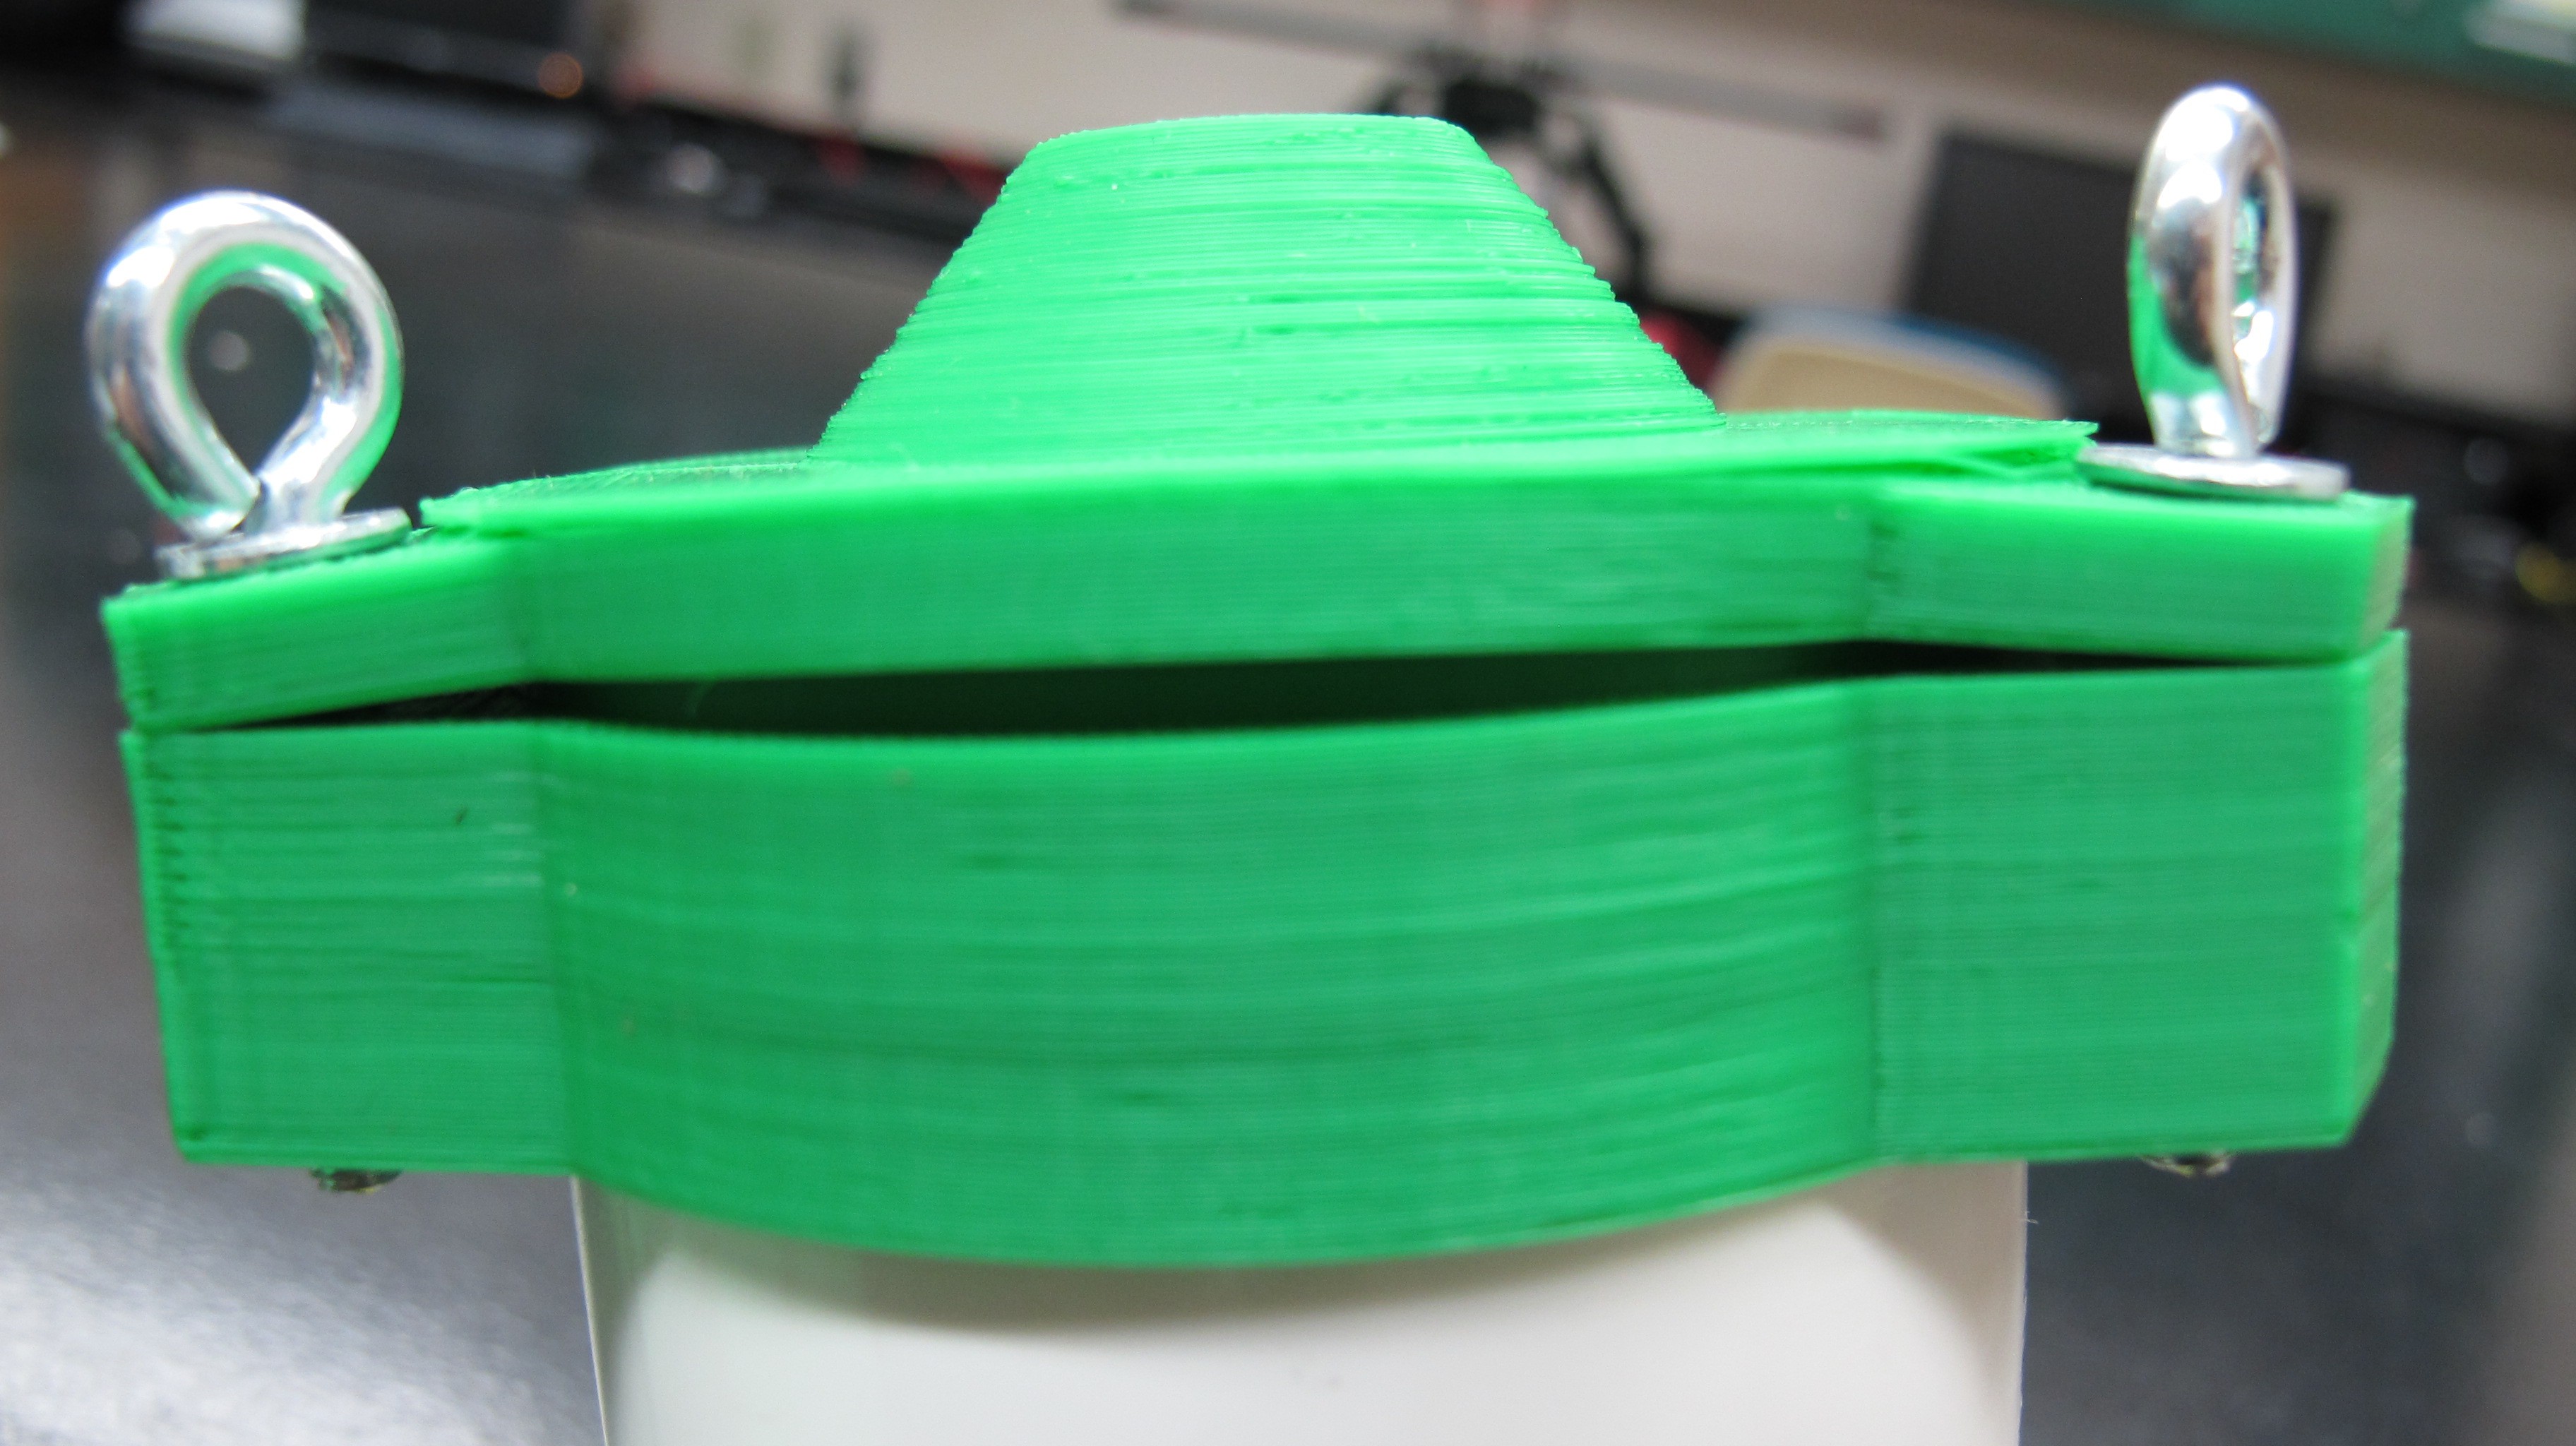
The eye bolts serve two purposes, first to tighten and clamp down against the collar to provide a watertight seal and as tie points for the line used to lower and raise the profiler. As you can seen from the images below the printed part straight off the bed is not strong enough to withstand the force of bolts and washer are putting on it and the layers splits.
![]()
![]()
I then tested out a previous version of the cap that I coated in Bondo epoxy resin. It's impossible to tell from the picture below but the bolts were significantly tighter than from the previous test, in fact is was so tight that the collar, which contains the nut that the bolt threads into and was not coated in resin, begin to split.
![]()
These tests show promise for the resin coated parts in strengthening the the plastic. More updates on this to come as I continue to design the profiler body.
-
Fluorometer testing continued...
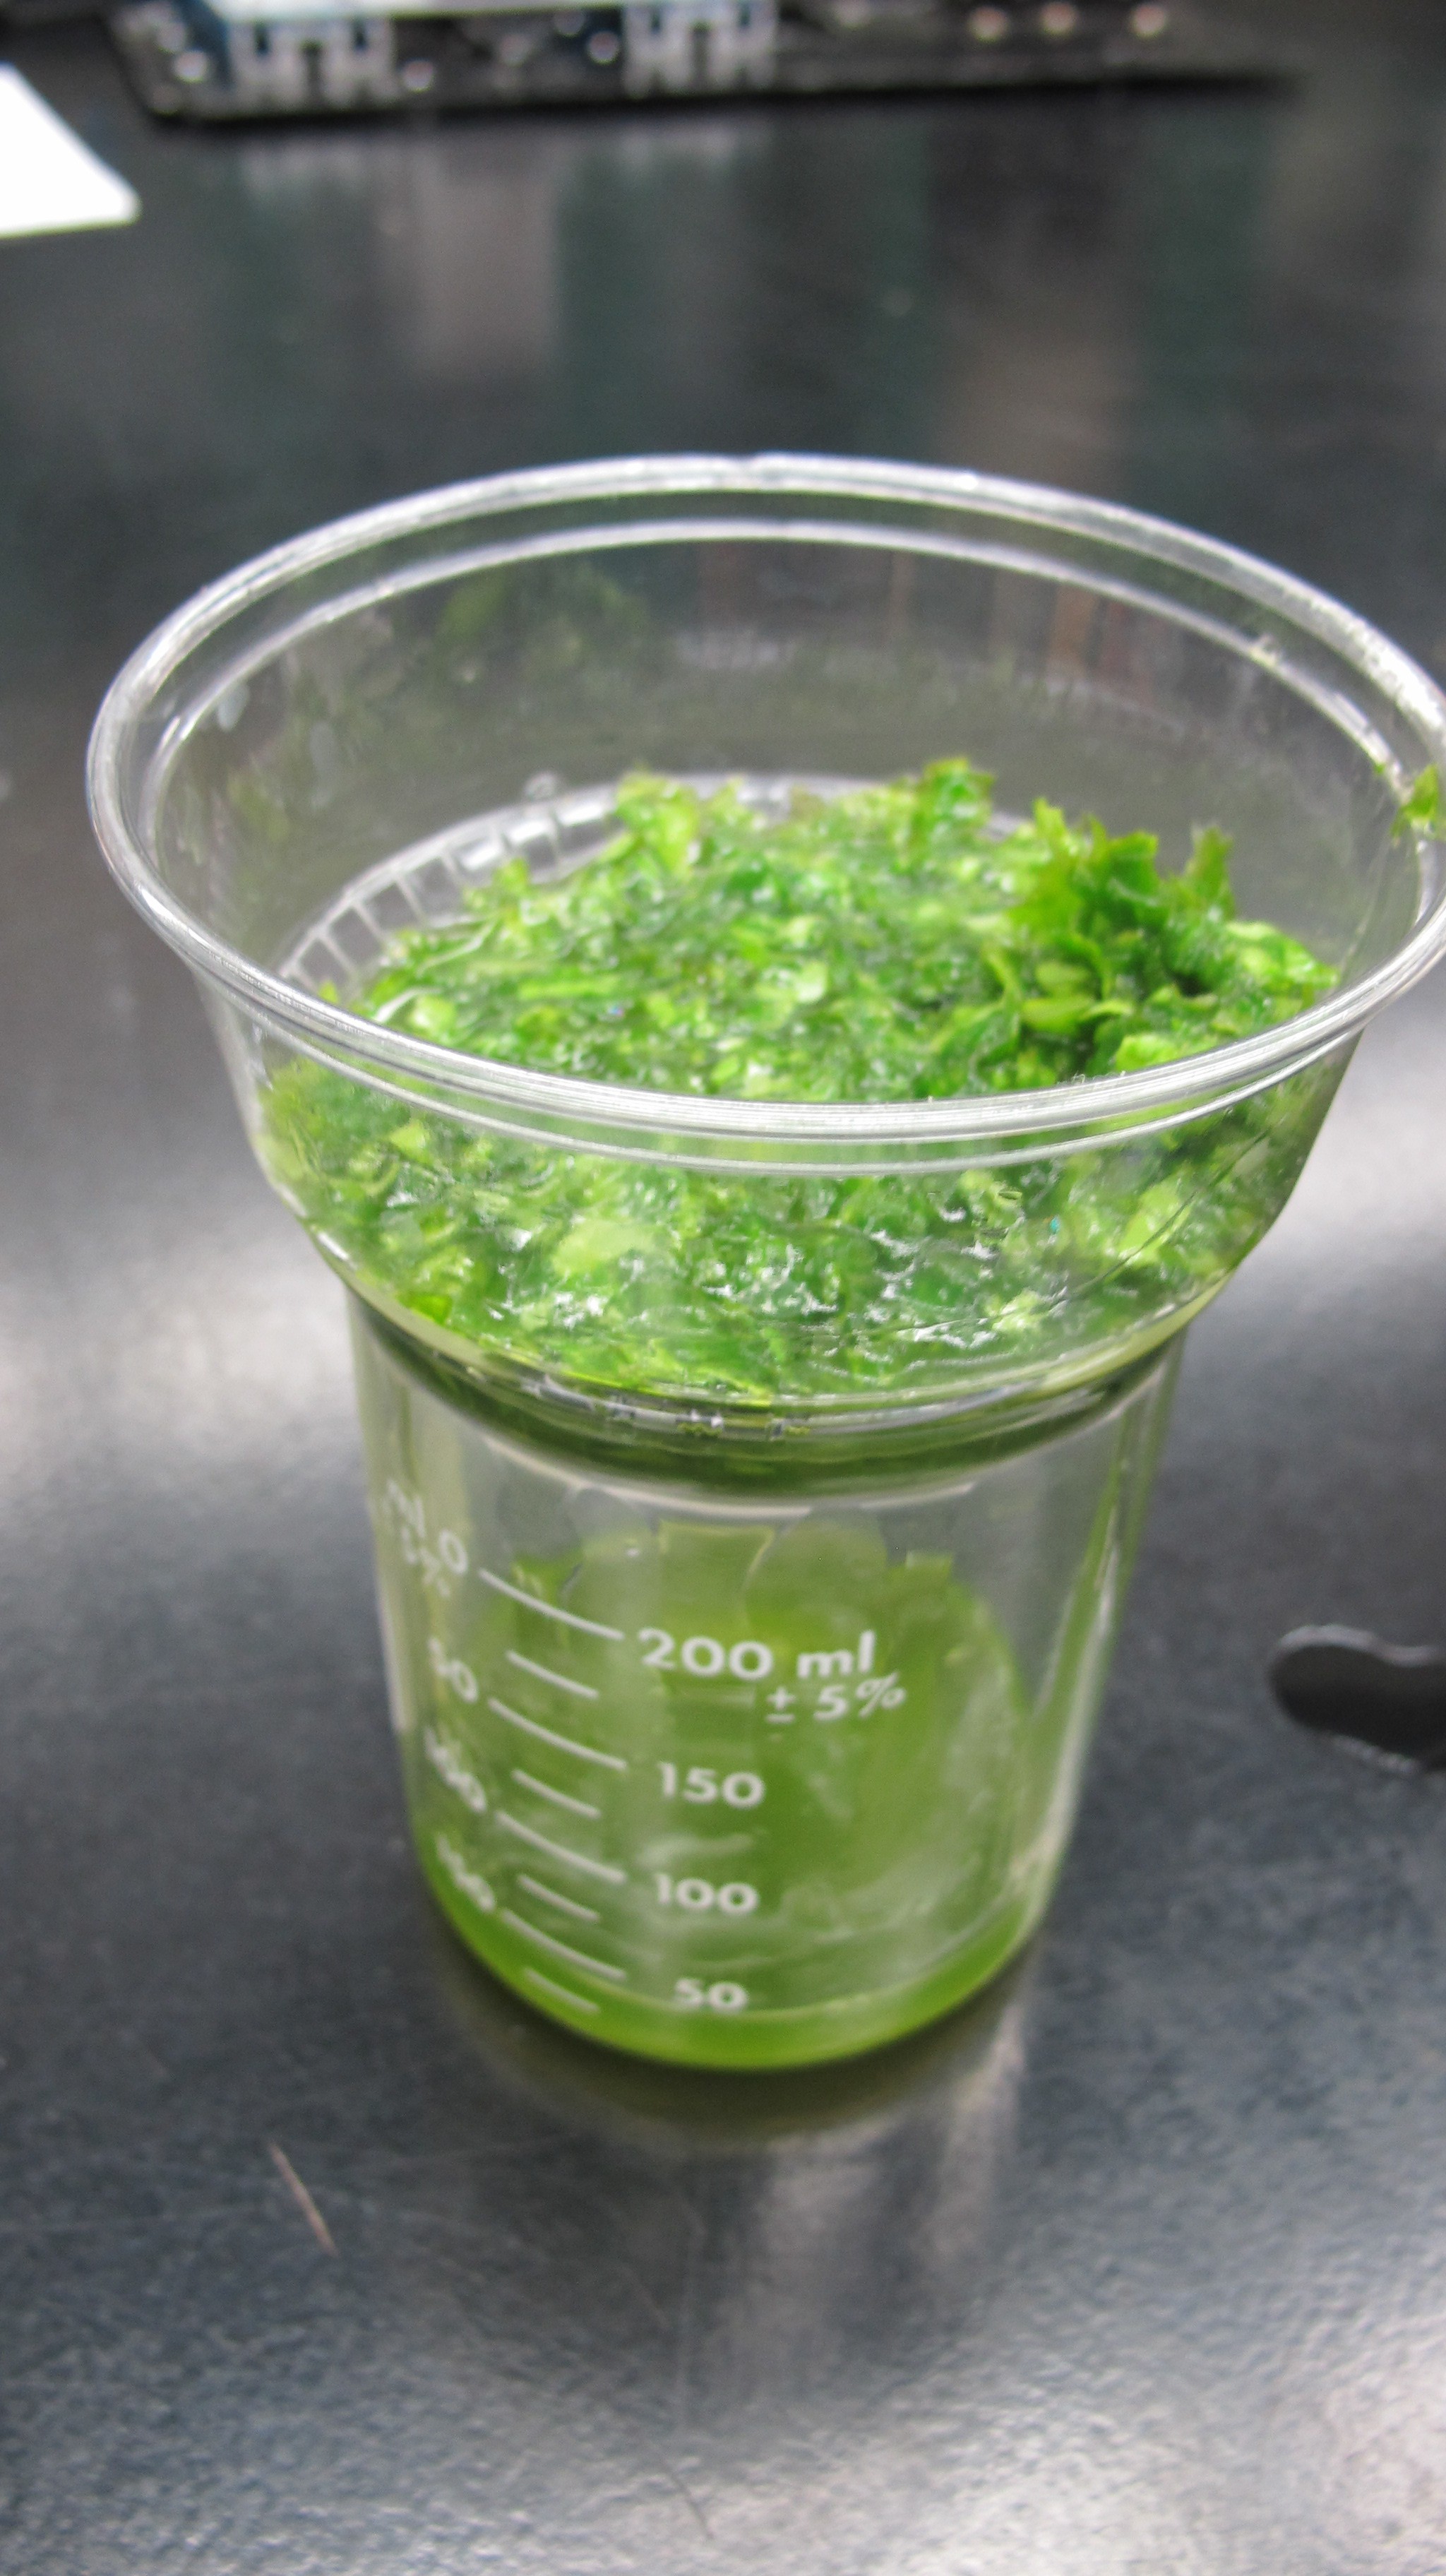
07/05/2016 at 18:19 • 0 commentsBecause I was unable to detect a chlorophyll fluorescence signal last week from the water I sampled from a local lake I decided to try and extract chlorophyll from some leaves to do some testing. I picked some lettuce from my garden and cut it up with scissors and ground the leaves in rubbing alcohol with a mortar and pestle to break down the tissue I filtered the ground up leaves into a vial to remove any solid tissue.
I then “centrifuged” the vial by putting it in a bag and spinning it around for![]()
a minute, I then let the vial sit for about 10min in a fridge to let the rest of the tissue settle out.
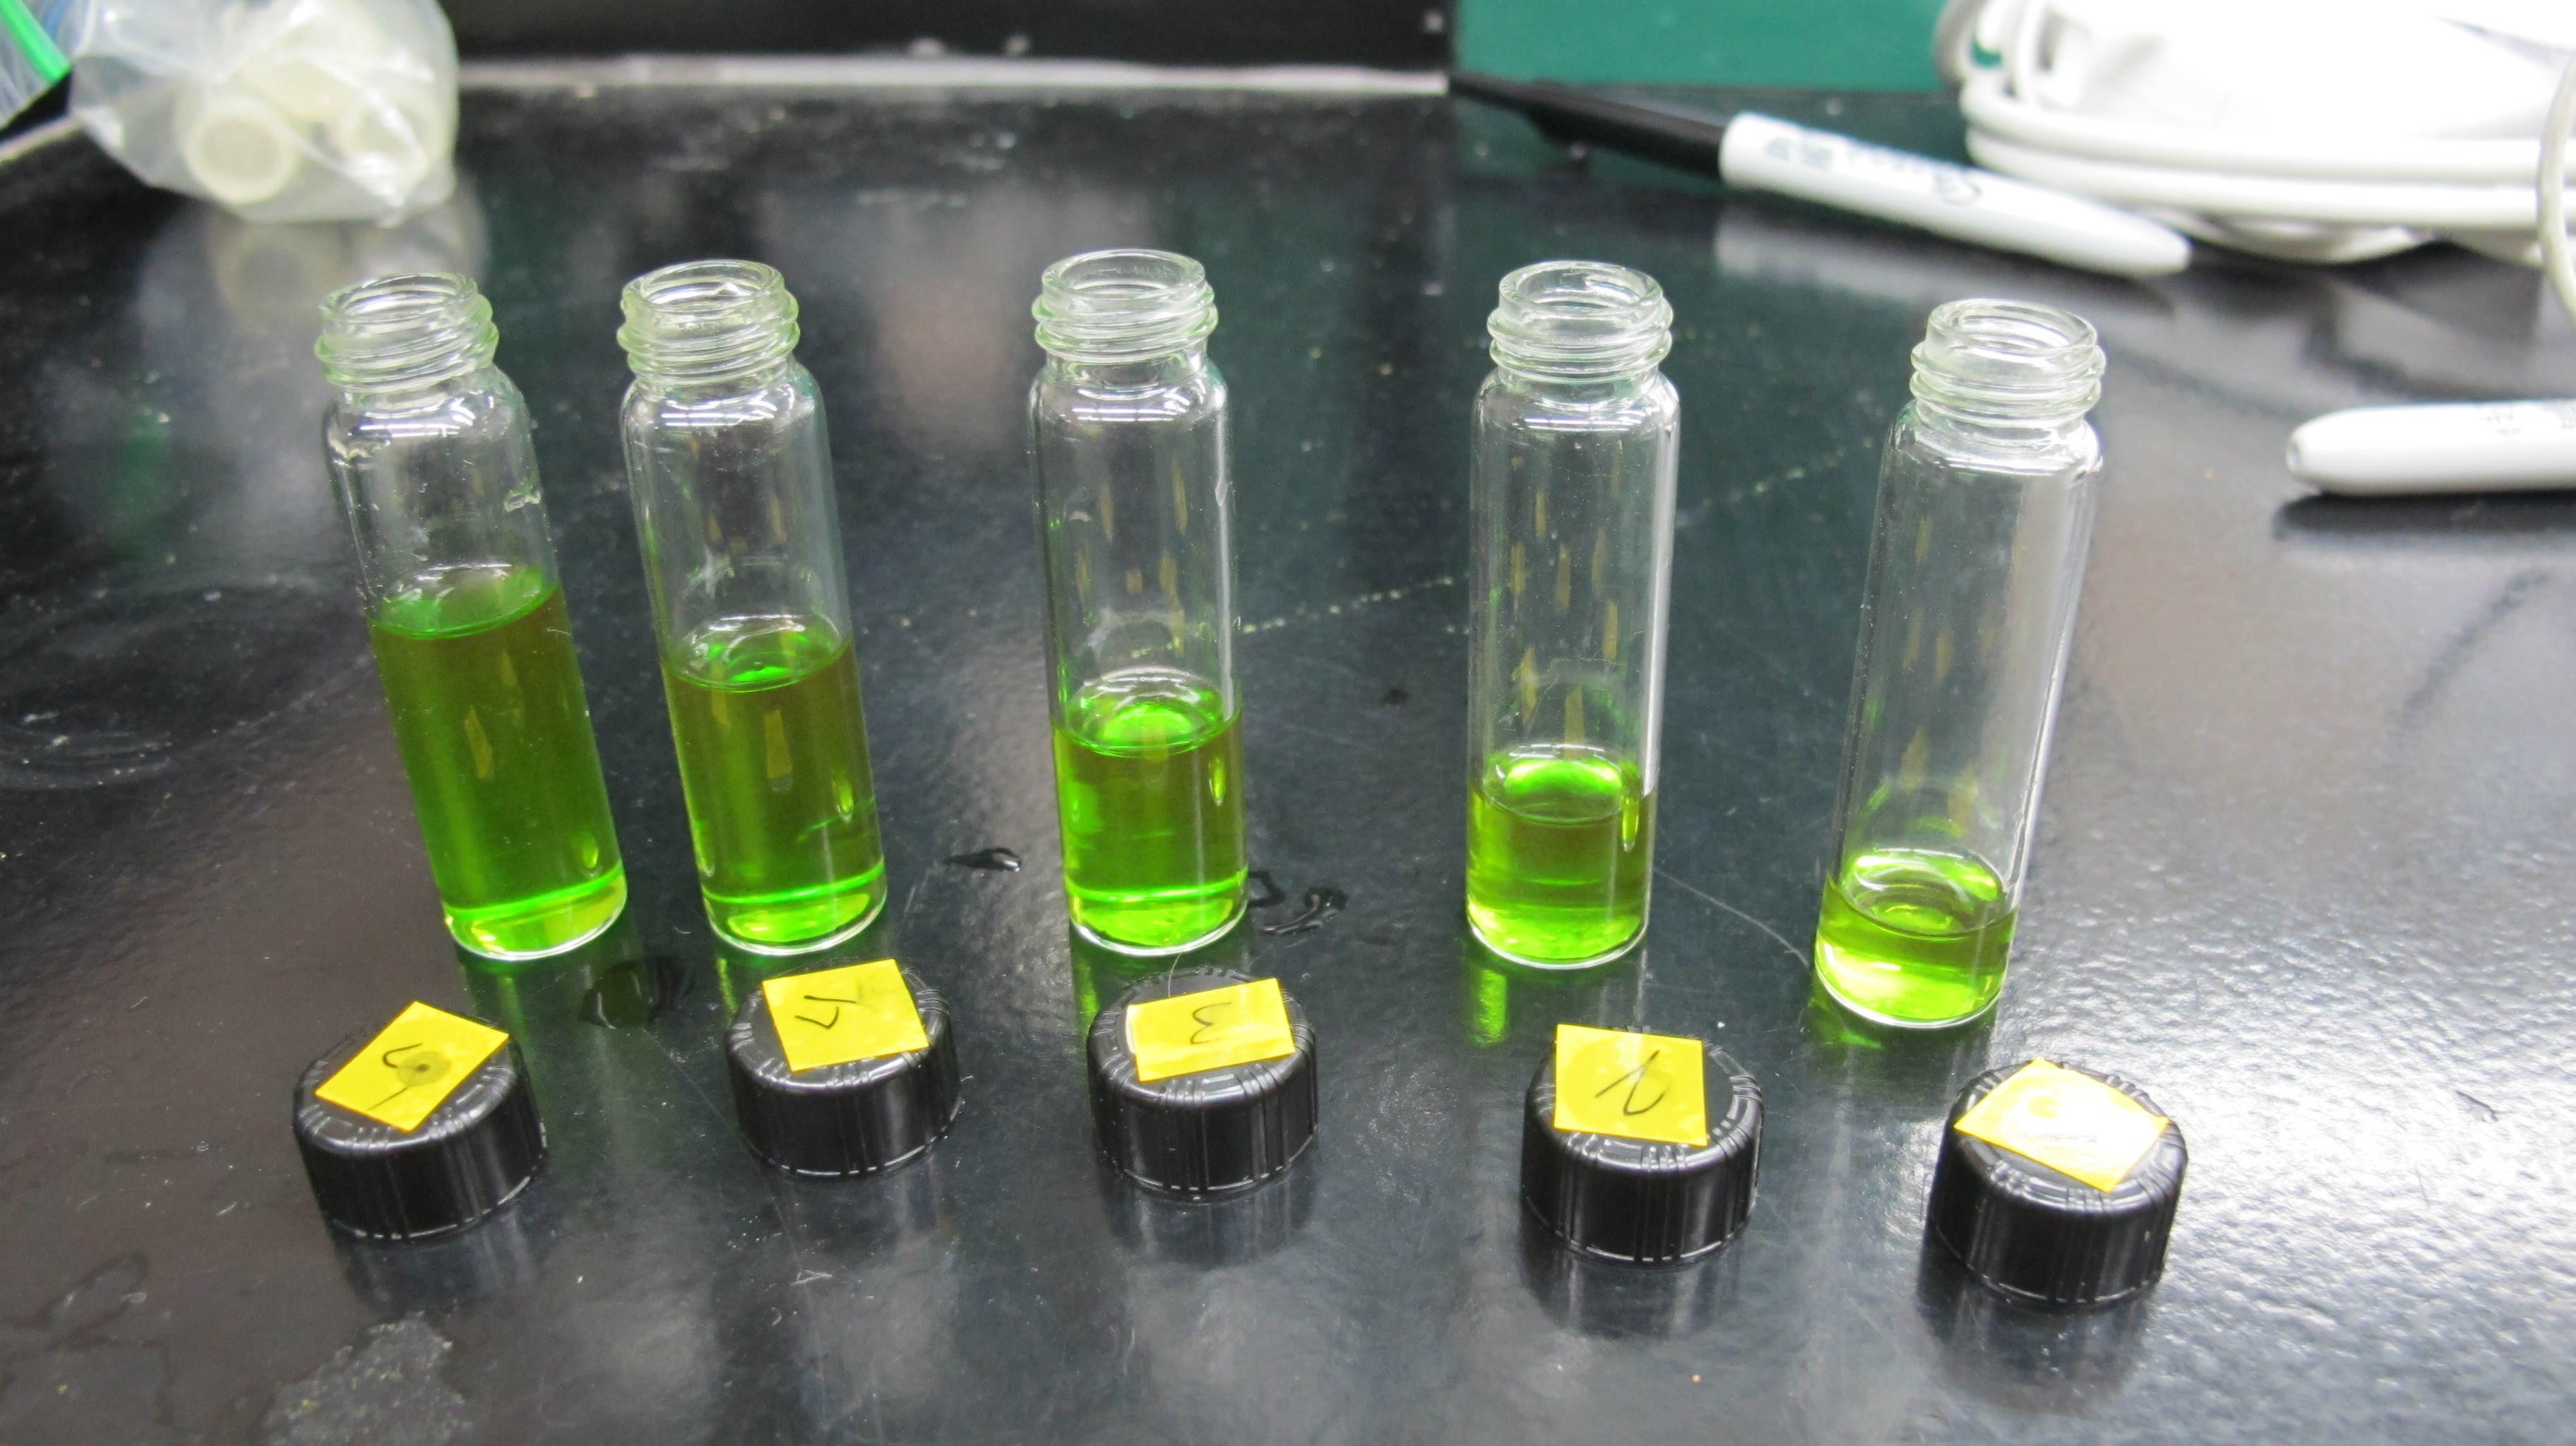
Not only did I want to measure fluorescence but I also wanted to see how the fluorescence signal varied with different concentrations of chlorophyll. An important feature of the profiler is the ability to relate fluorescence magnitude to chlorophyll concentration. Because I did not know the true concentration of chlorophyll I made measurements on different relative concentrations by filling equally sized vials with between 1-5mL of chlorophyll extract and filling the rest of the vials with water.
![]() "Pure" chlorophyll extract
"Pure" chlorophyll extract![]()
Diluted chlorophyll extract
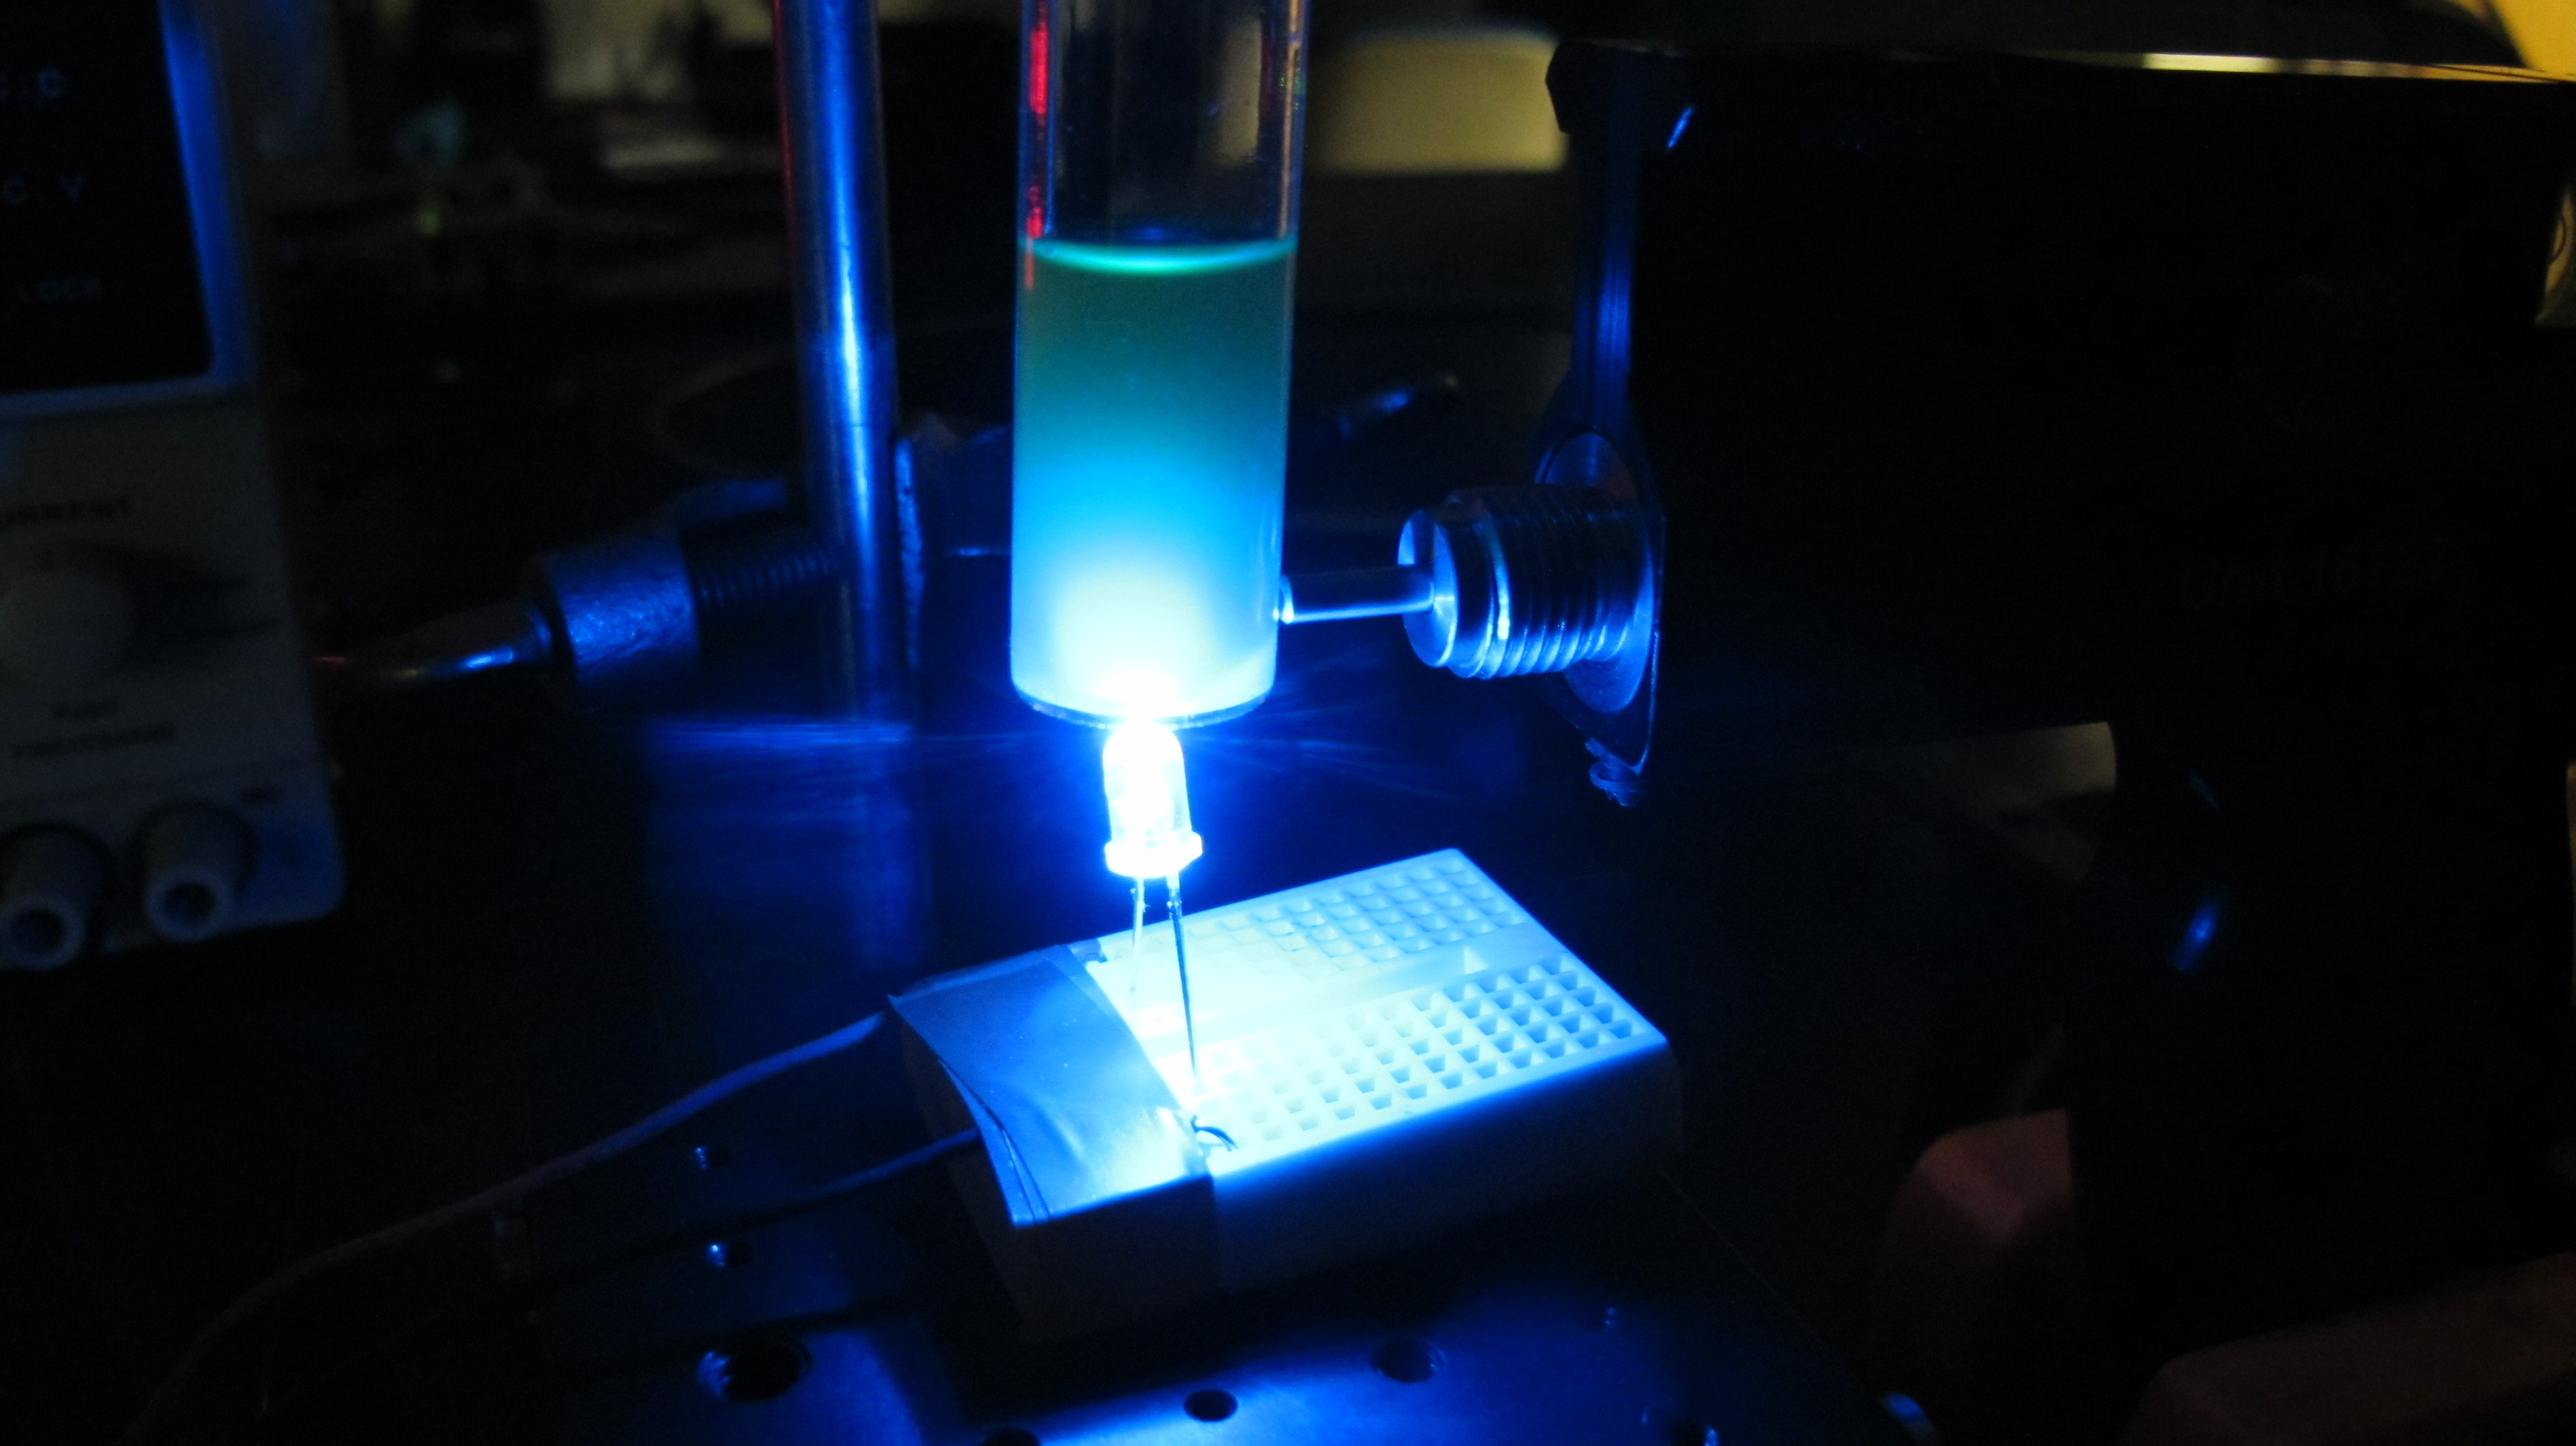
I used a similar set up as last week to illuminate the vials with 470nm LED and measure the water leaving signal using a spectrometer.
![]()
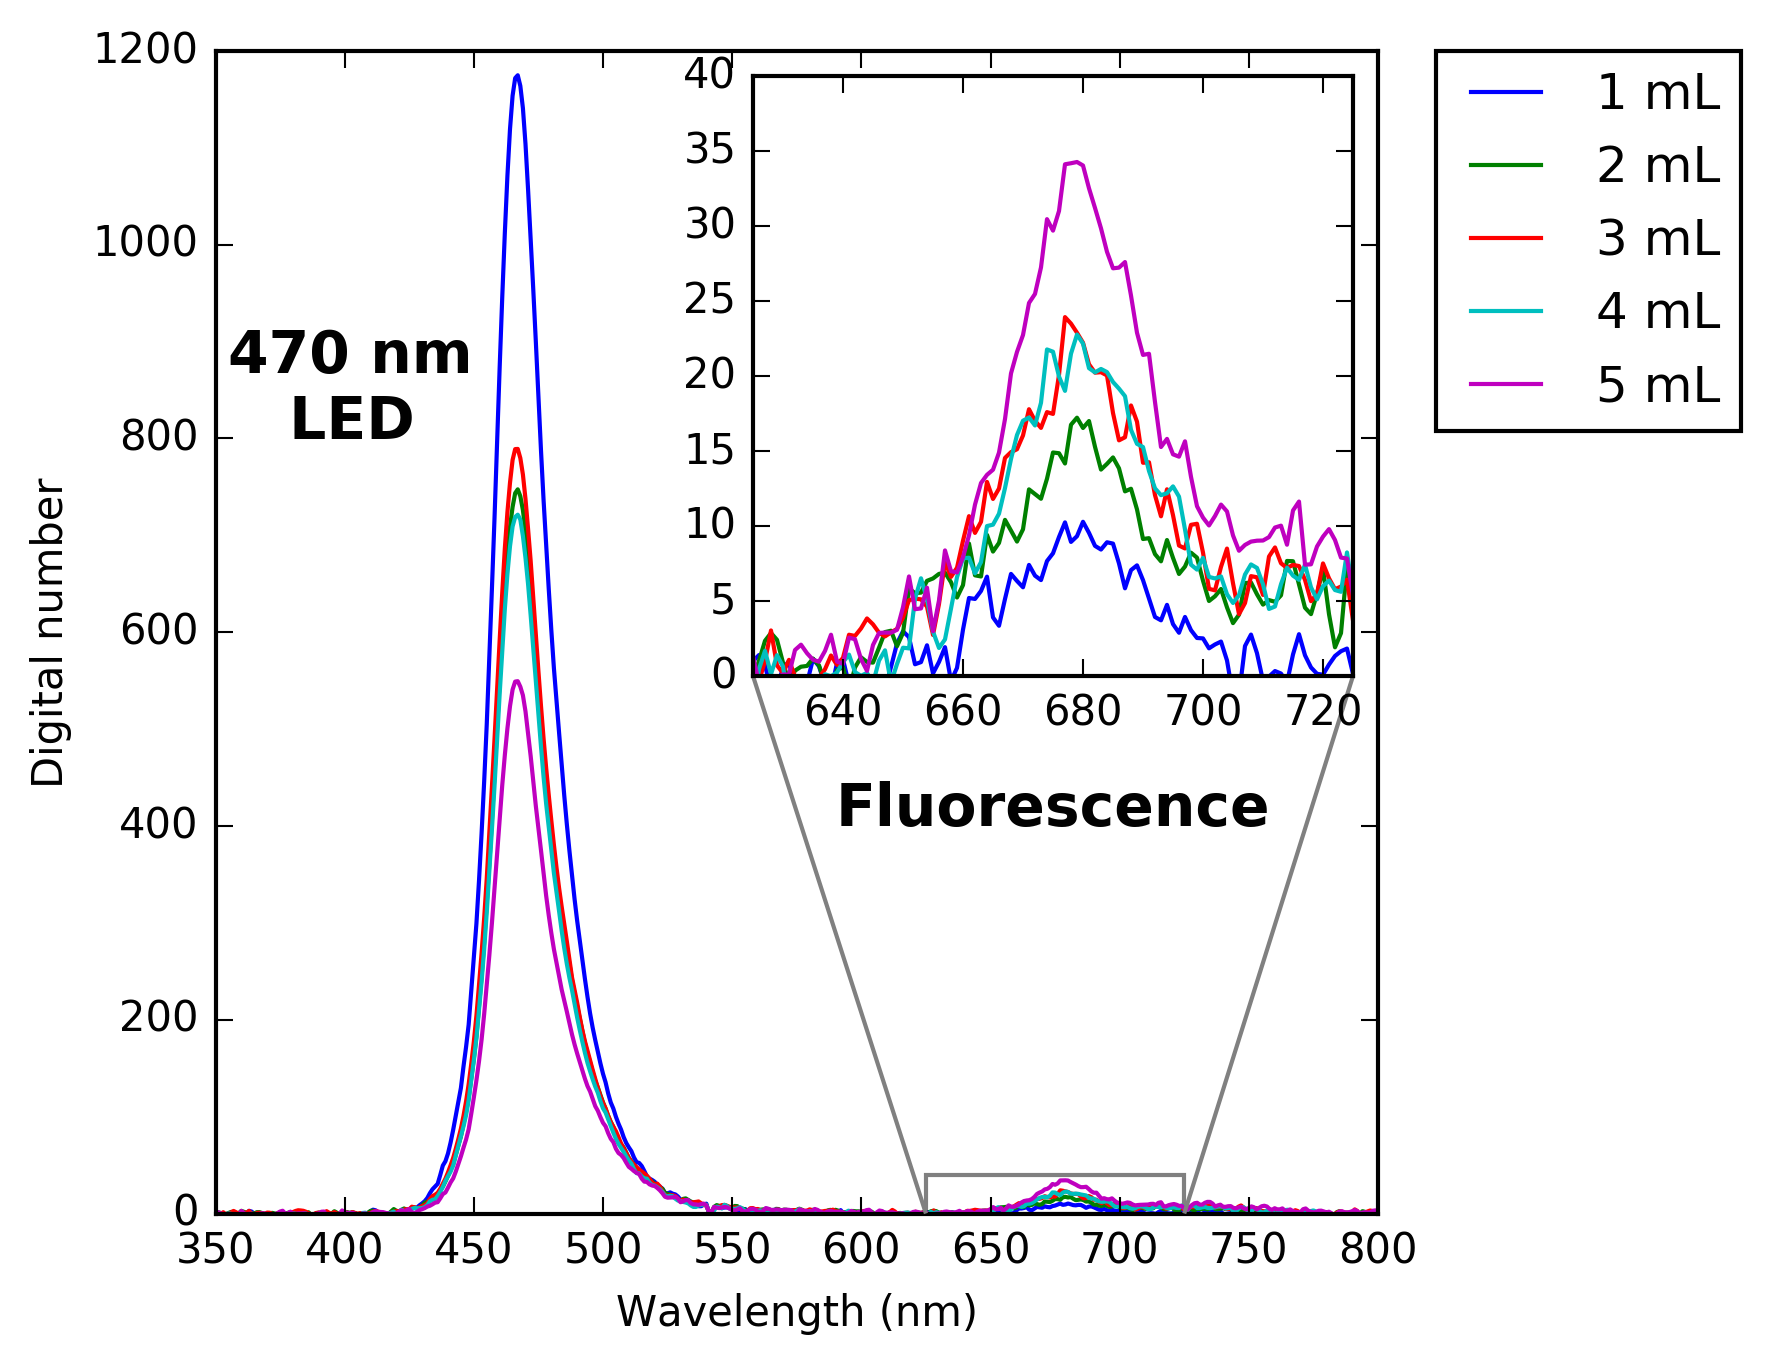
The figure below shows the results. As you can see with increased concentration of chlorophyll extract the fluorescence signal also increases.
![]()
What this shows is that the LED is able to induce fluorescence and that the signal can be measured with a spectrometer, however the true test is whether the signal can be measured using a broadband photodiode.
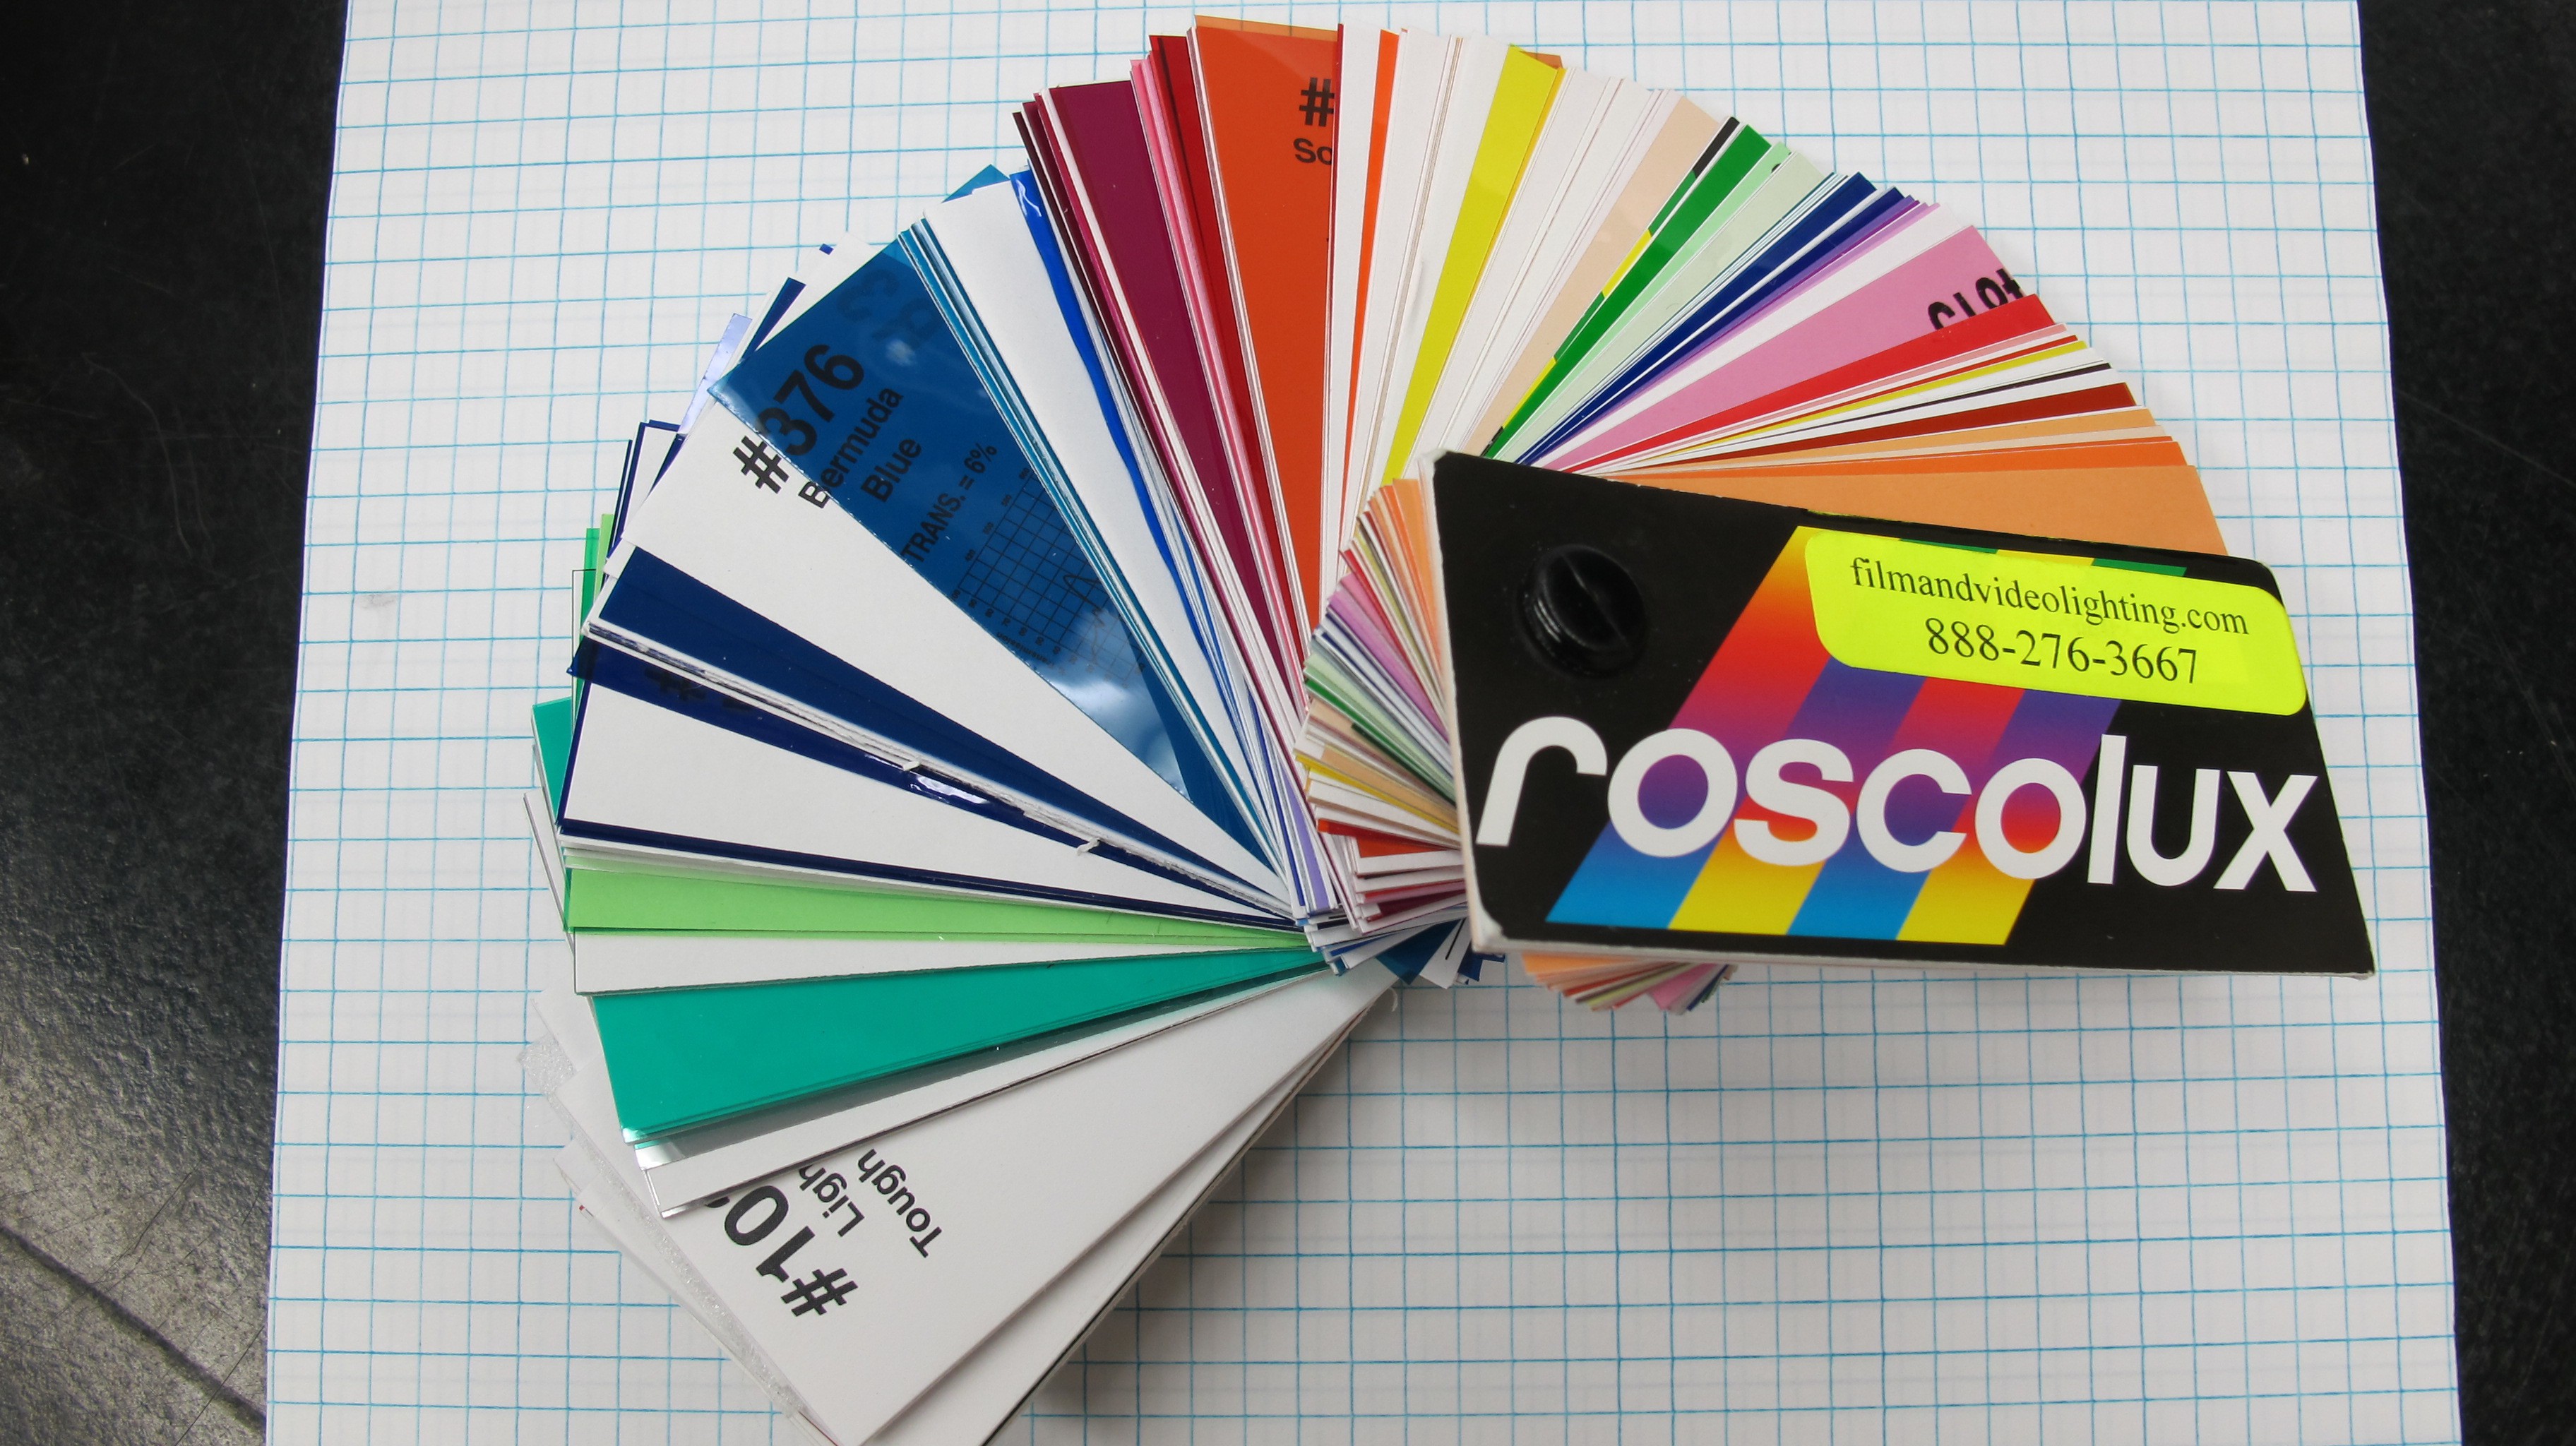
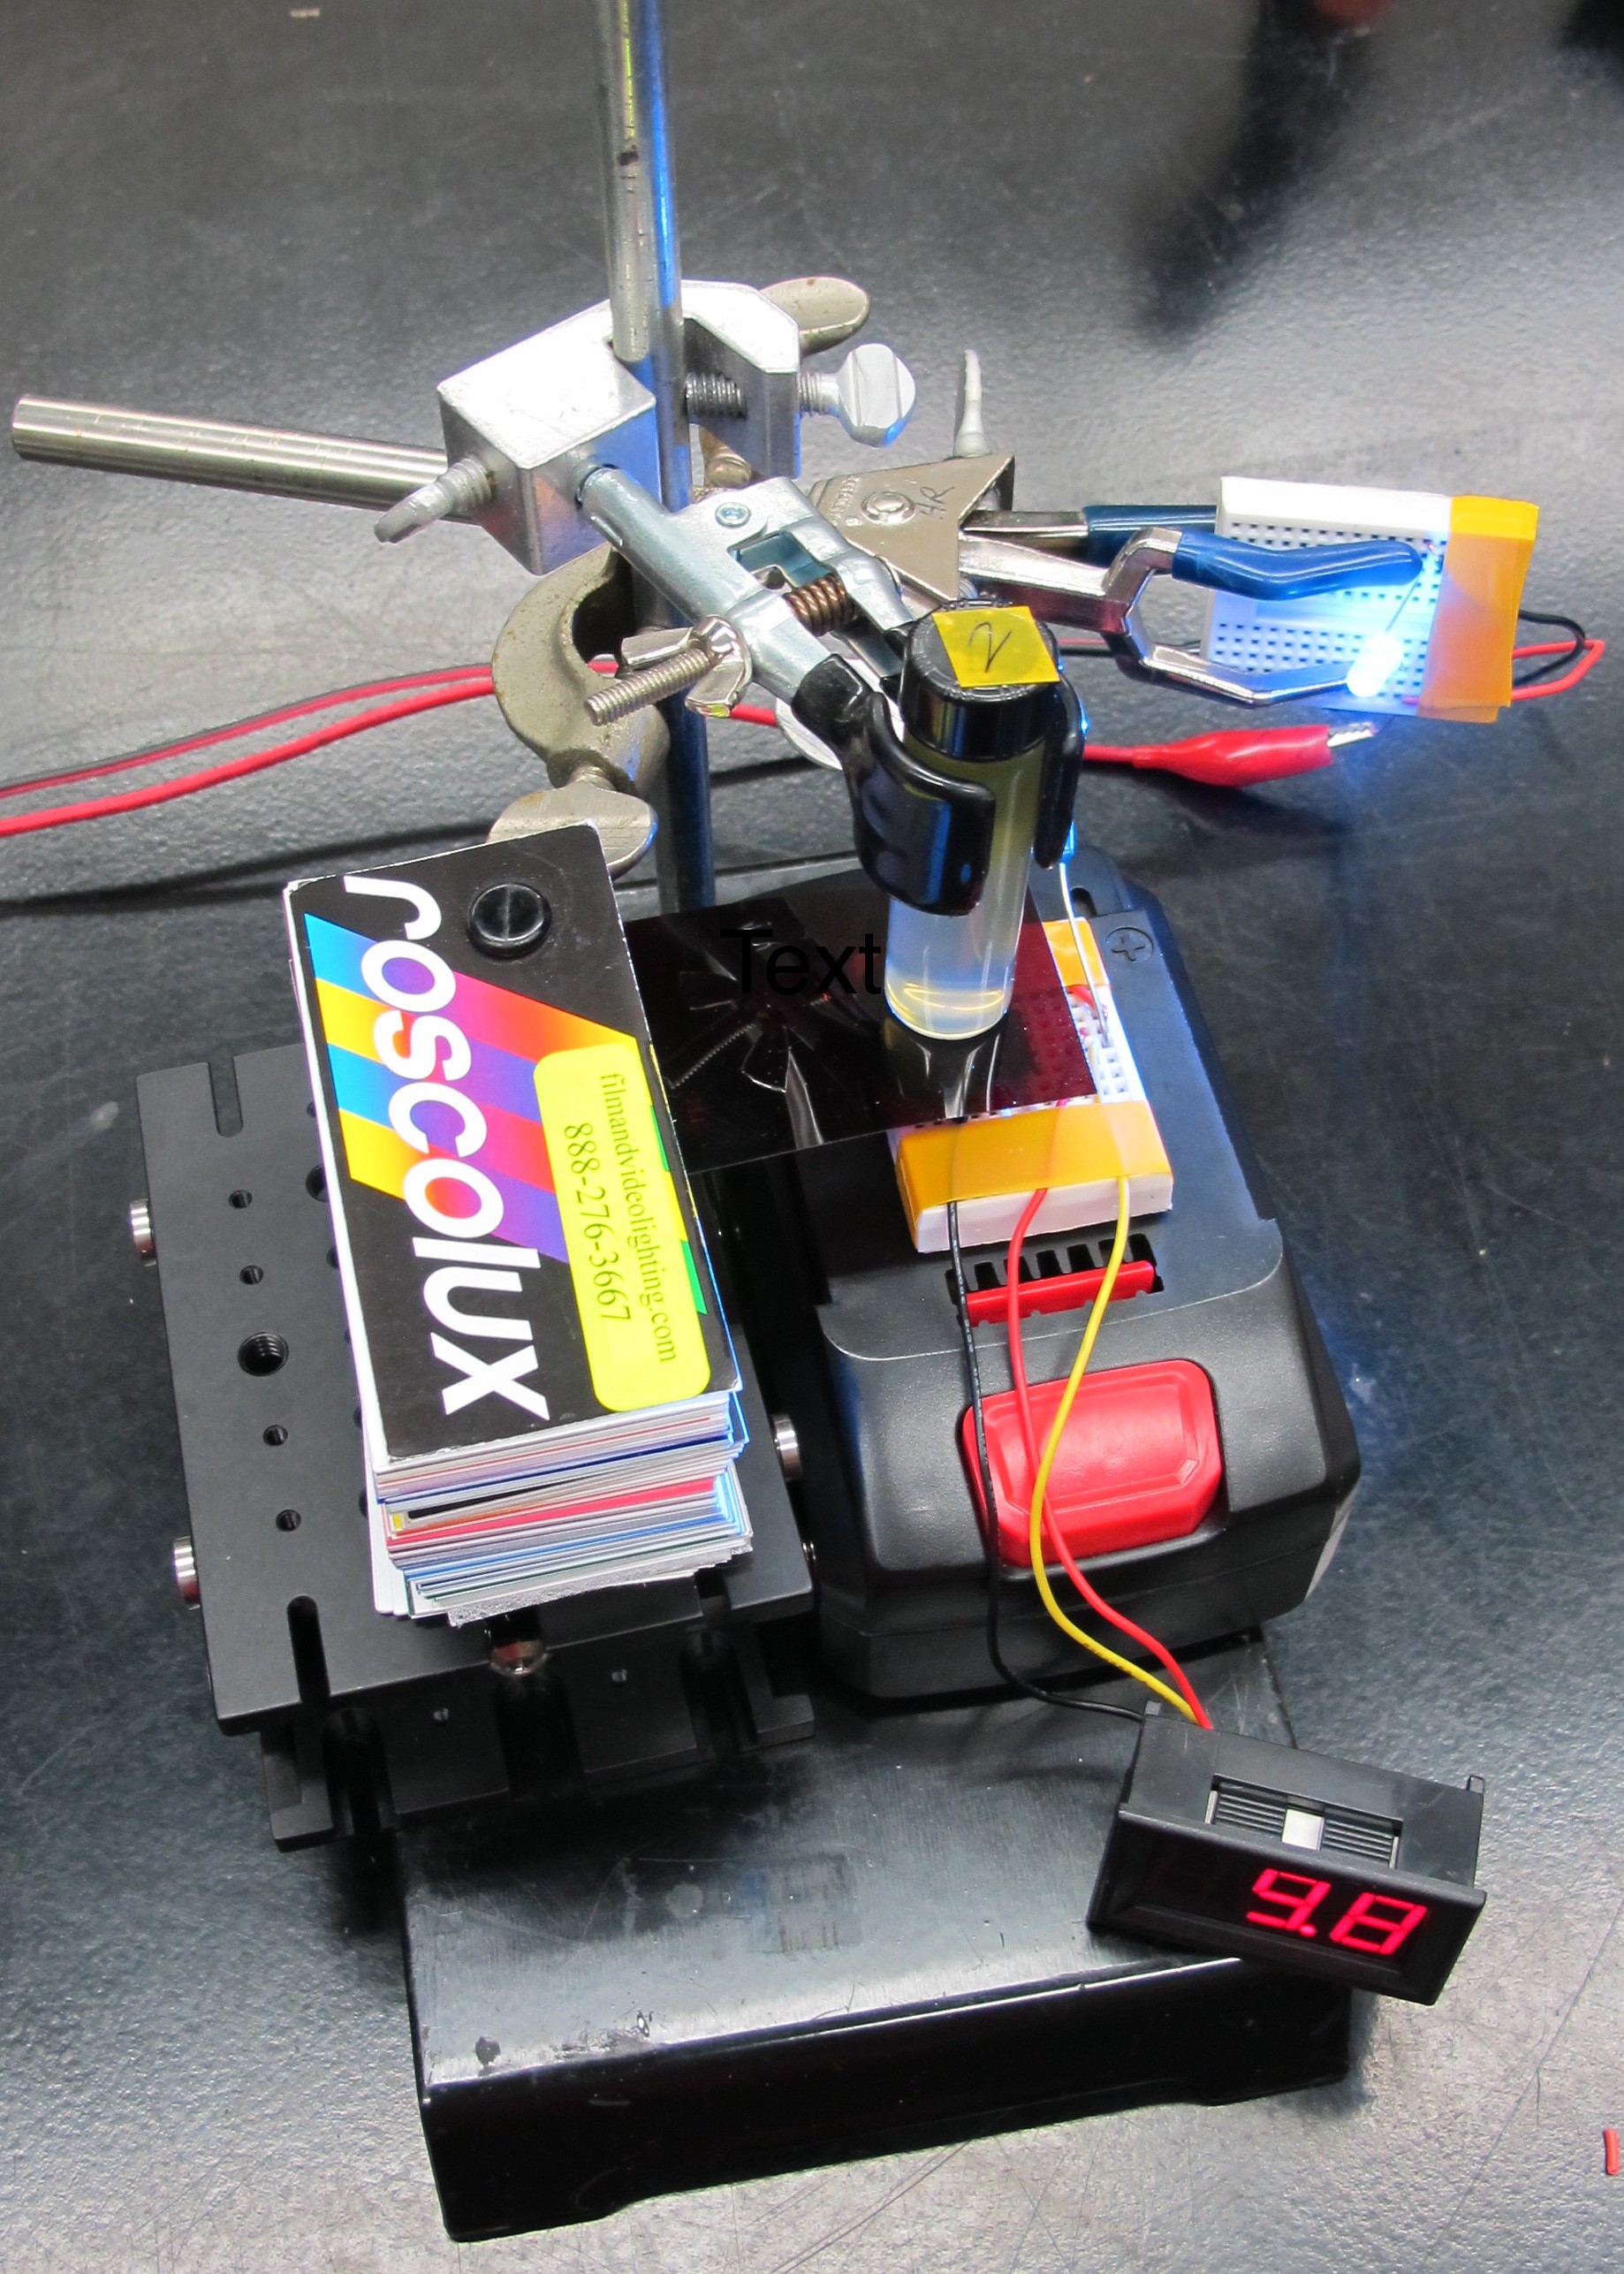
In order to measure the fluorescence signal using a photodiode I needed to block out the light emitted by the LED. I used a cheap Roscolux filter to block out any light with wavelength a less than ~620nm as was done by Leeuw et al. 2016 in their fluorometer.
![]()
They used a # 19 filter in their design while I used the # 25 filter as it has a slightly high cutoff, which is important because the photodiode I am using has a higher emission peak than theirs (470 vs 420nm).
I then went ahead and measured fluorescence signal of each of the vials of chlorophyll extract. I made the measurement 3 times for each vial to get and average value.![]()
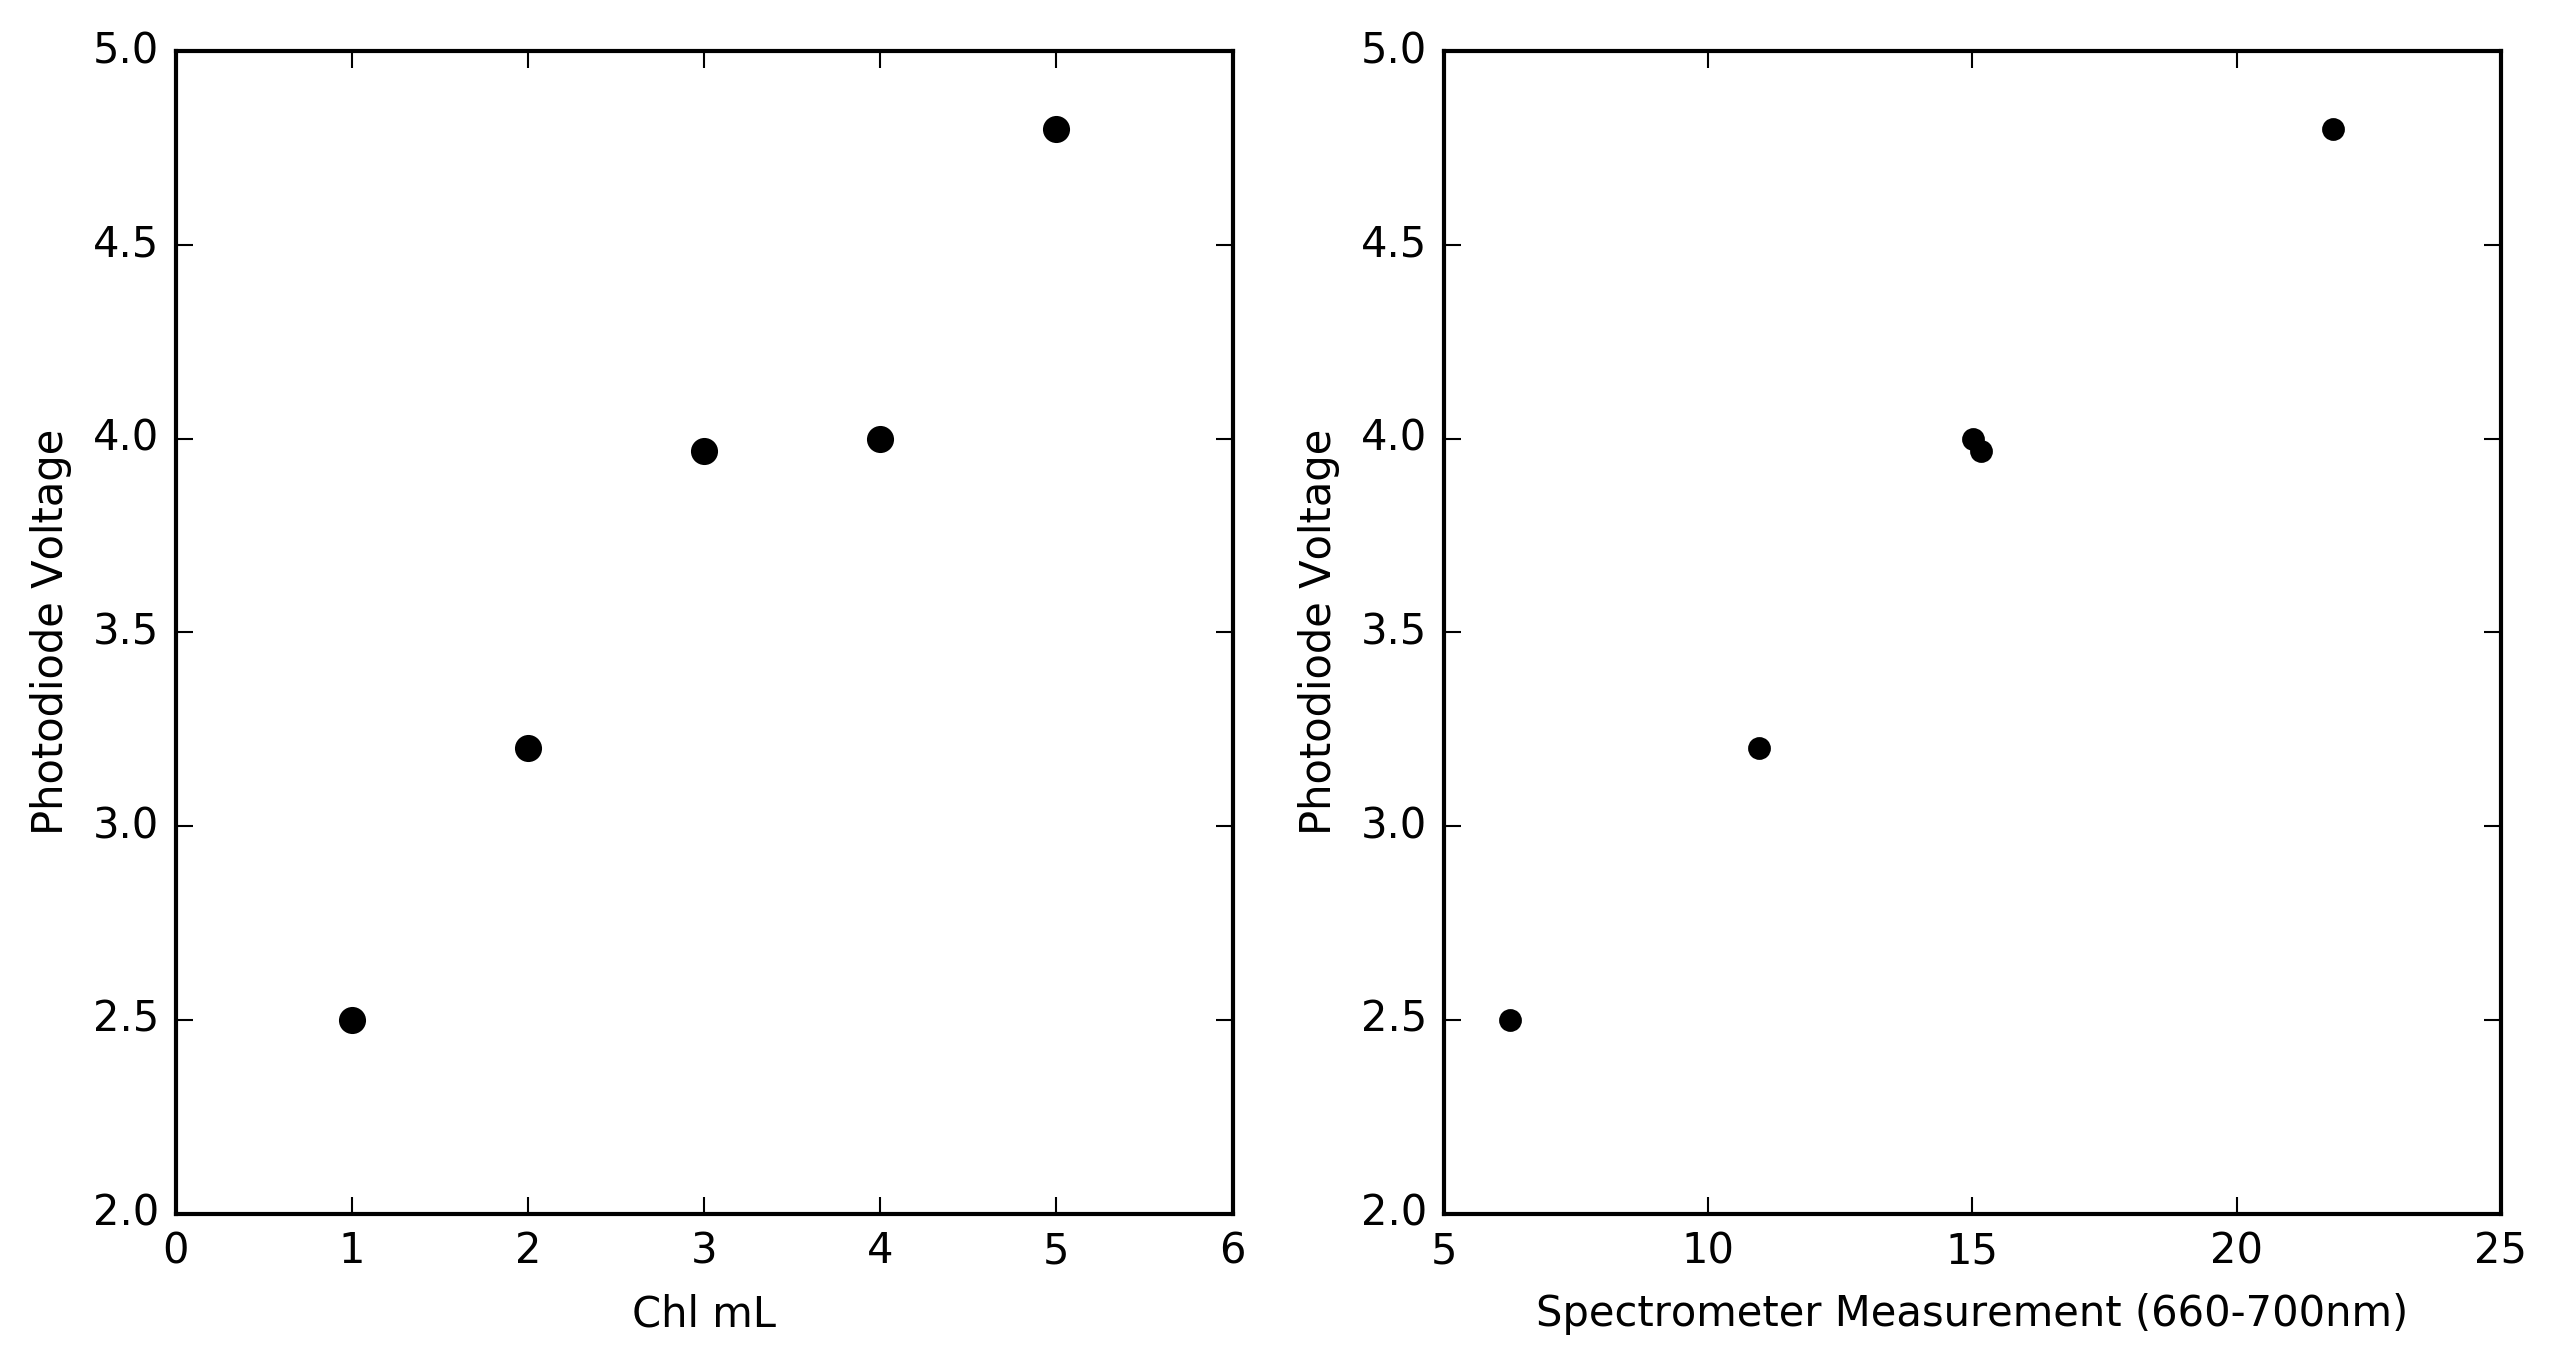
The graphs below show the results of the photodiode fluorescence measurements.
![]()
The graph on the left show the relationship between chlorophyll concentration and voltage from the op-amp circuit. With increasing concentration of extract the fluorescence signal measured by the photodiode increases. However there is an anomaly for the measurement of the 4mL vial where the measured value is not greater than the 3mL vial as would be expected. This was also seen in the measurements made by the spectrometer which leads me to believe that the measurements from both are correct and that when I prepared the vials I made an error. Regardless whats nice is that the measurements from the photodiode are highly correlated to the measurements of the fluorescence signal made by the spectrometer (right graph).
References
Leeuw, T.; Boss, E.S.; Wright, D.L. In situ Measurements of Phytoplankton Fluorescence Using Low Cost Electronics. Sensors 2013, 13, 7872-7883.
-
Fluorometer and backscatter component testing
06/29/2016 at 18:28 • 0 commentsThe LEDs for the fluorometer and backscatter sensor recently arrived and I measured their spectral output to make sure they were as advertised. I ordered the chlorophyll fluorometer LED and backscatter LEDs through Mouser so I was pretty confident that the specs were accurate. In my original design had had only included one NIR LED for backscatter measurement but I decided to add a second at a different wavelength because it might be able to provide information about particle size distribution. The CDOM LED, which has a peak at about 370nm, I got from eBay and was less confident about its spectral output.
I made the measurements using a small spectrometer with the LED pointing at a diffuse white panel and measured the reflected light.
![]()
The figure below shows the normalized outputs for each of the LEDs.
![]()
You can see that for the most part the spectral emittances of the LEDs are accurate. However, there is some emitted light in the visible spectrum by the UV LED. I have a suspicion that output in the range ~500-600nm is caused by fluoresence induced by the UV signal. Knowing this is important because this is close to the wavelength band were CDOM fluoresces, 460nm, and may result in over estimation of CDOM concentration. To account for this I plan on placing a filter in front of the UV LED to block visible light emmision.
After testing the LEDs I decided to collect some water from a local lake and see if I could induce chlorophyll or CDOM fluorescence and measure backscattered light.
![]()
We recently had a large thunderstorm and there is a lot of suspended sediment in the water.
I placed the water in small vials and illuminated them from below with an LED and pointed a fiber optic cable connected to a spectrometer at the side of the vial. In the profiler the light will be measured with a photodiode, but for testing purposes using a spectrometer is valuable because it provides information about the spectral response of the emitted light.
![]()
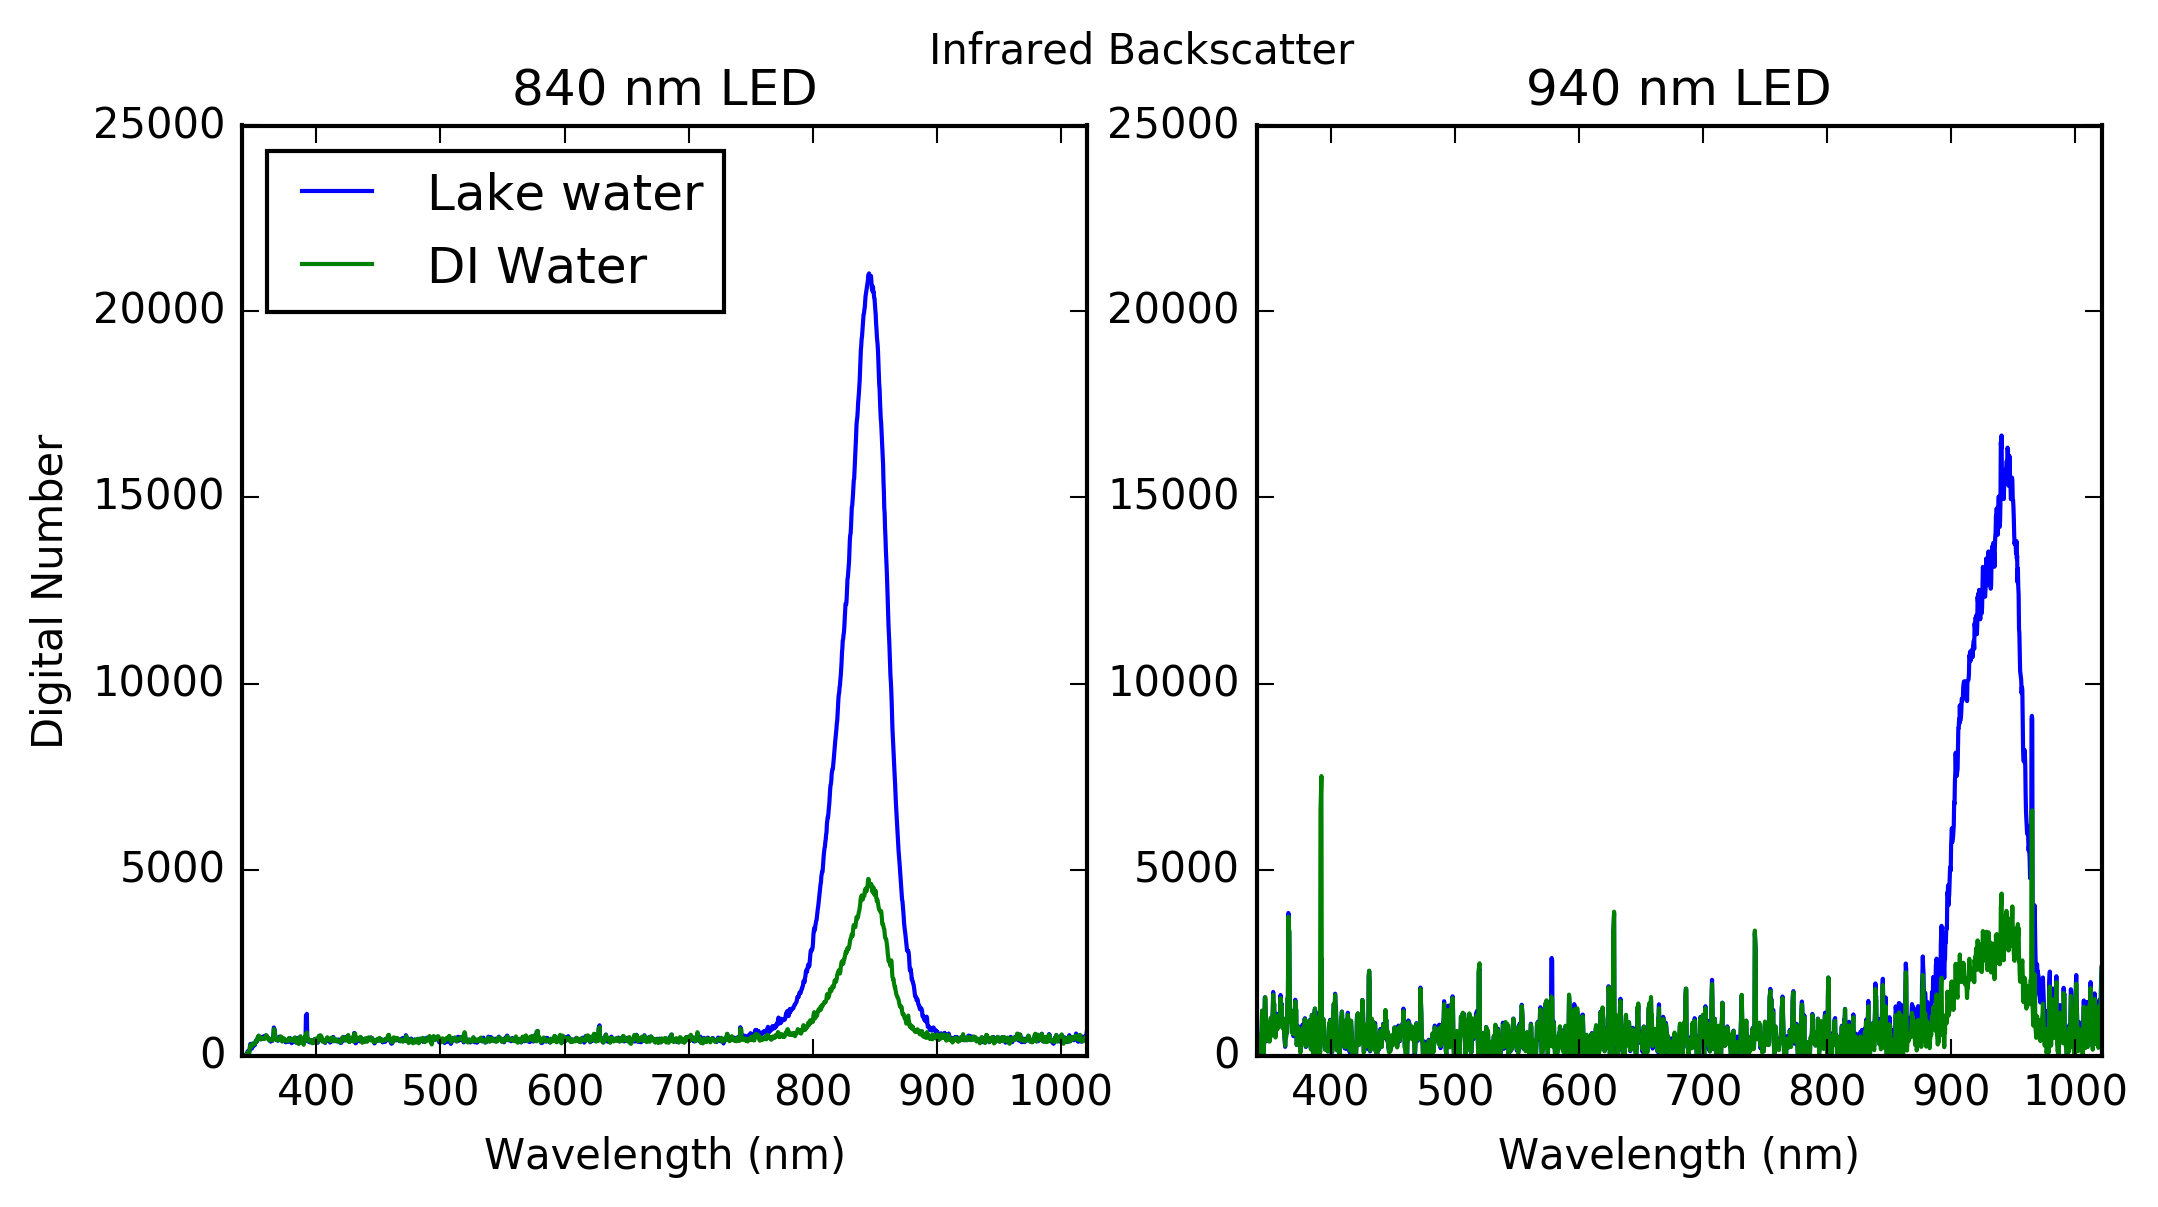
As a comparison I also filled a vial with distilled water and recorded spectra while illuminated with the LEDS to get baseline measurements. The figure below shows the results from the infrared LED measurements.
![]()
As expected the magnitude of radiation measured by the spectrometer is much greater in the lake water compared to the baseline DI water due to scattering of light by the suspended sediment. One thing to note is that the power output of the 940nm LED is lower than the 840nm LED causing a lower SNR, which is evident in the graph.
The results from the UV and blue fluorescence LEDs showed similar trends indicating that light measured by the spectrometer was just light scattered by the suspended sediments and not light fluoresced at a longer wavelengths from chlorophyll or CDOM. What this means is that water I collected likely contained very little to no chlorophyll and/or CDOM. Next week I plan on either extracting chlorophyll and CDOM or finding water bodies with higher levels of both to test the abilities of the LEDs to induce fluorescence.
-
PAR Sensor Circuit Testing
06/20/2016 at 19:22 • 0 commentsTo test whether the variable gain circuit was working properly I placed the PAR sensor under a light and programmed the Arduino to continuously cycle through the each of the feedback resistors and read the resultant voltage. I did this under different light levels by moving the lamp progressively closer to the sensor. At each light level I recorded the DN associated with each feedback resistor. If the circuit is working correctly then the ratio of the outputs from two differently valued feedback resistors should be the same as the ratio of their resistances. Ex. The output of a 1 MOhm feedback resistor should be 1/10th of the output using a 10 MOhm resistor, +/- their tolerances.
![]()
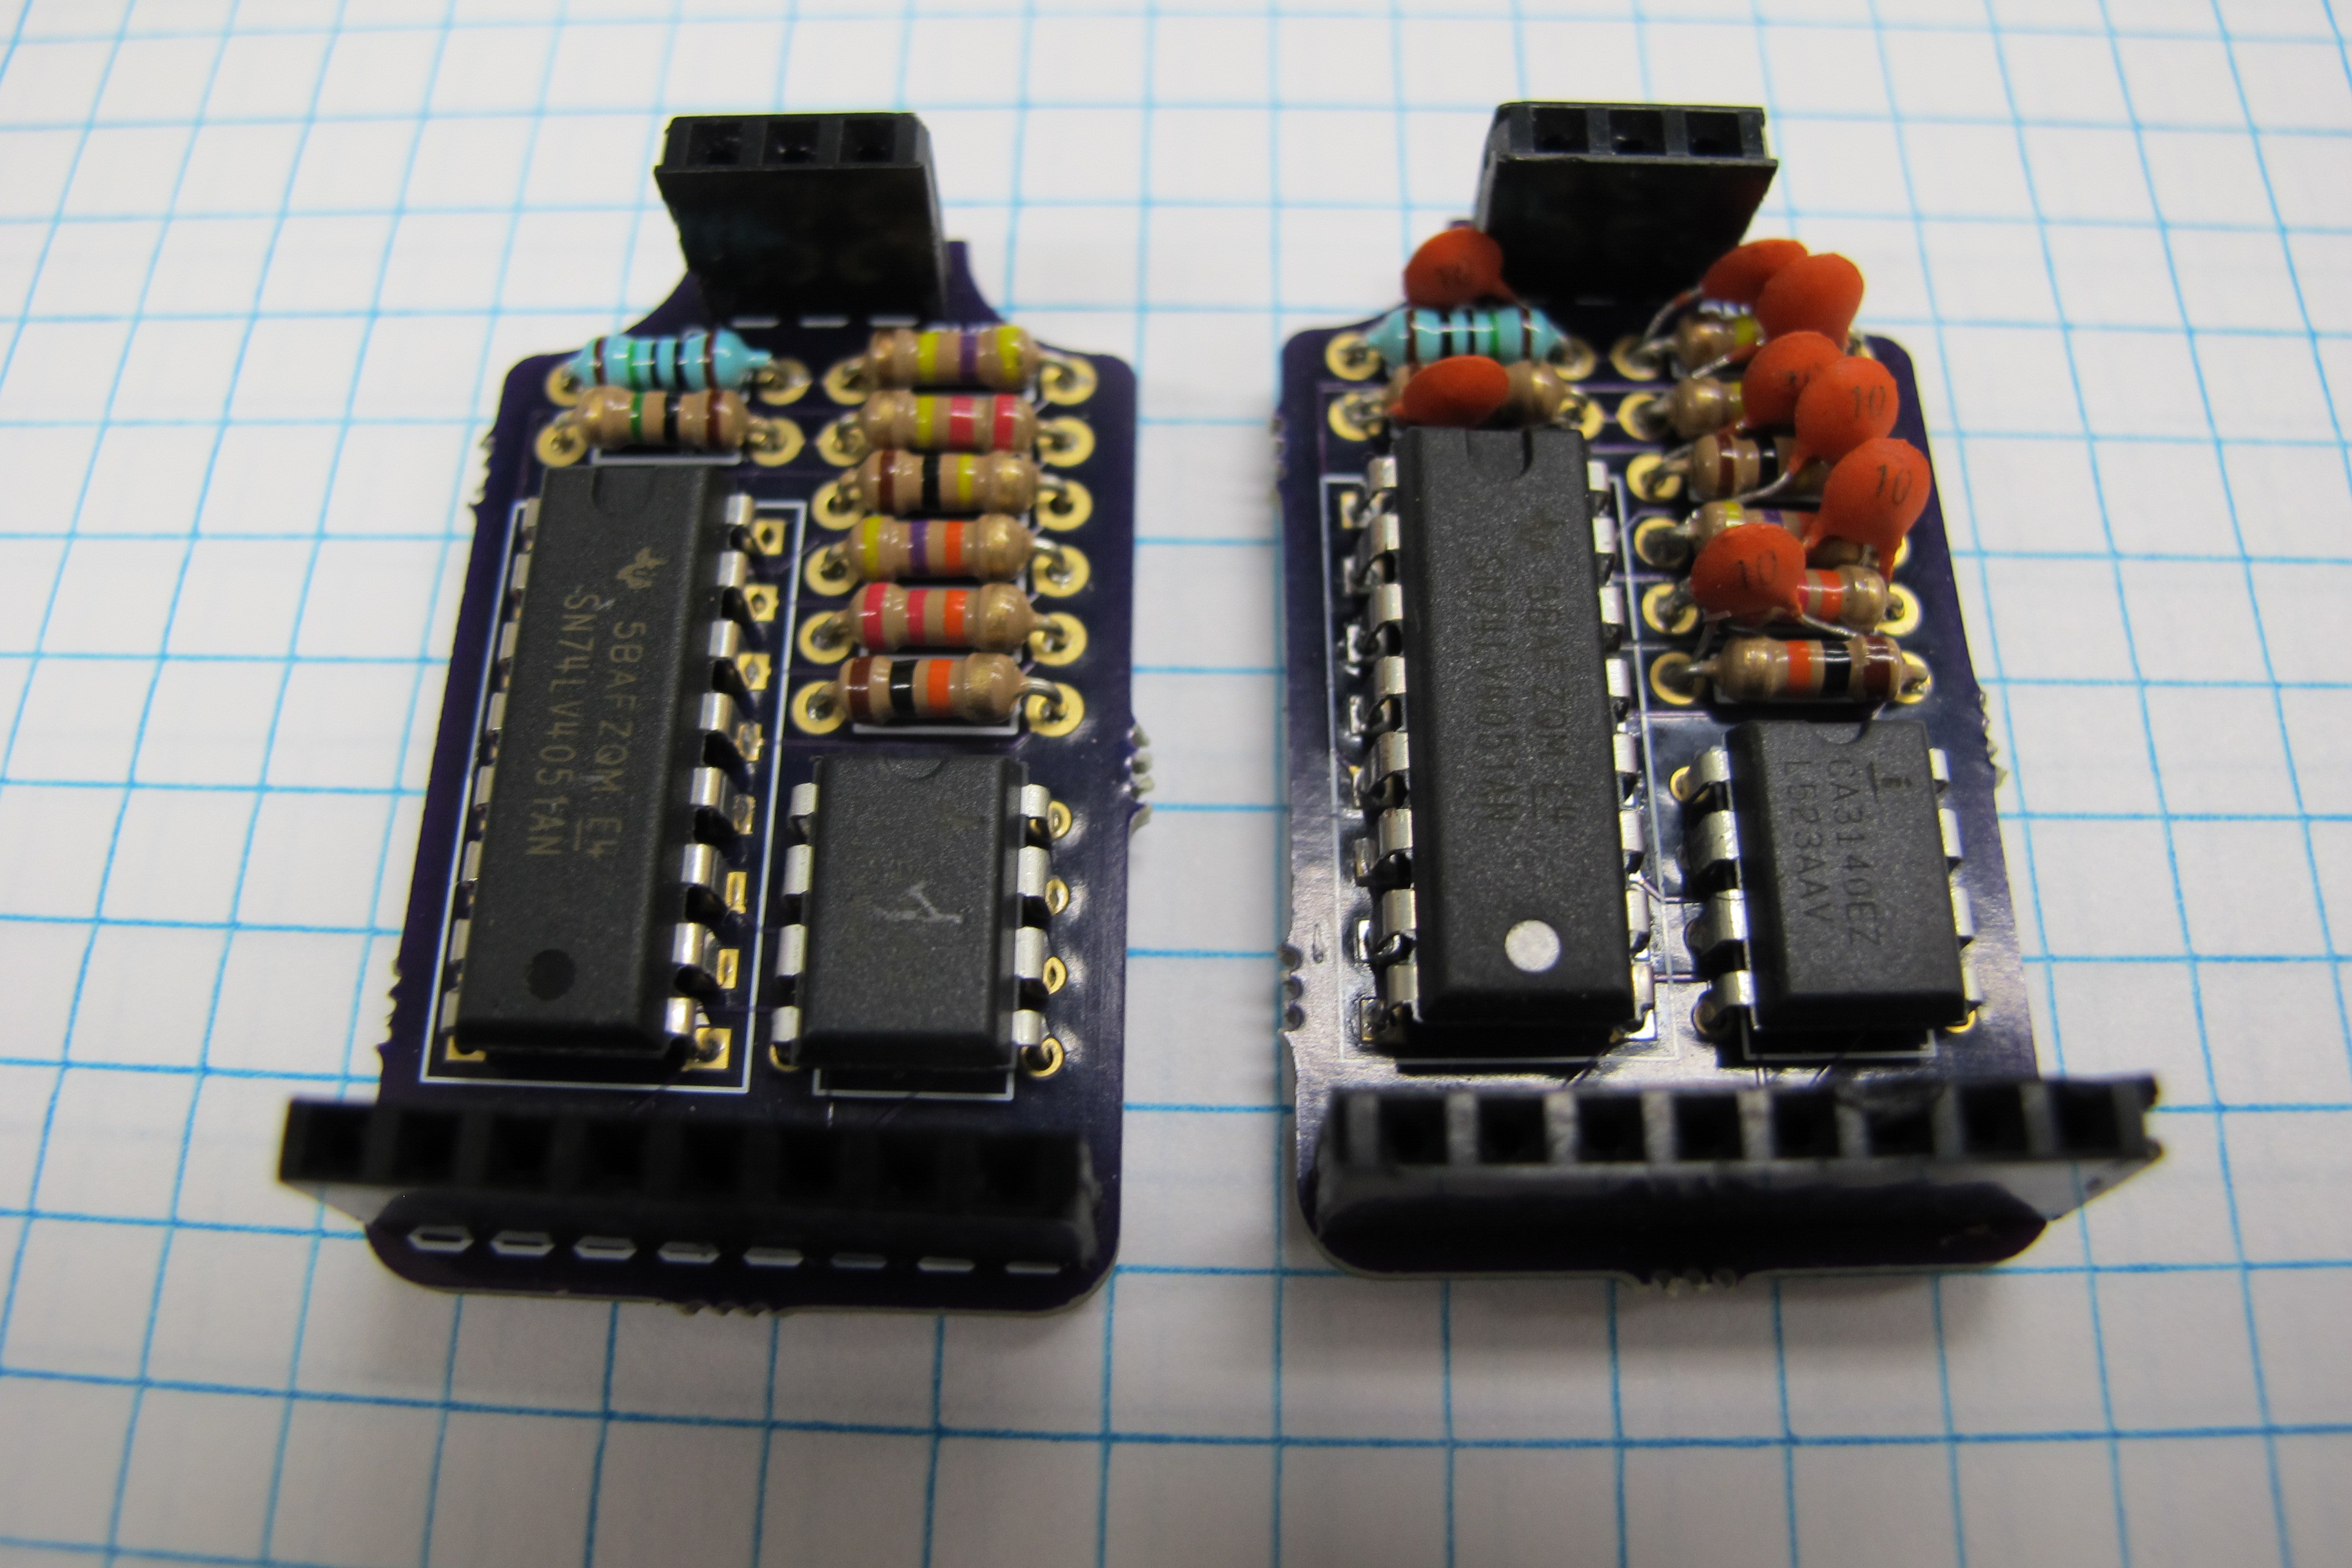
I did the initial set of tests on the op amp circuit without feedback capacitors and found that at high light levels the large feedback resistors (10 and 1 MOhms) resulted in wildly oscillating values. To try and remedy this I went ahead and soldered up another board this time with a 10 pF capacitor in parallel with each of the feedback resistors, which seemed to solve the problem. The picture below shows a both mux circuits with and without the feedback capacitors.
![]()
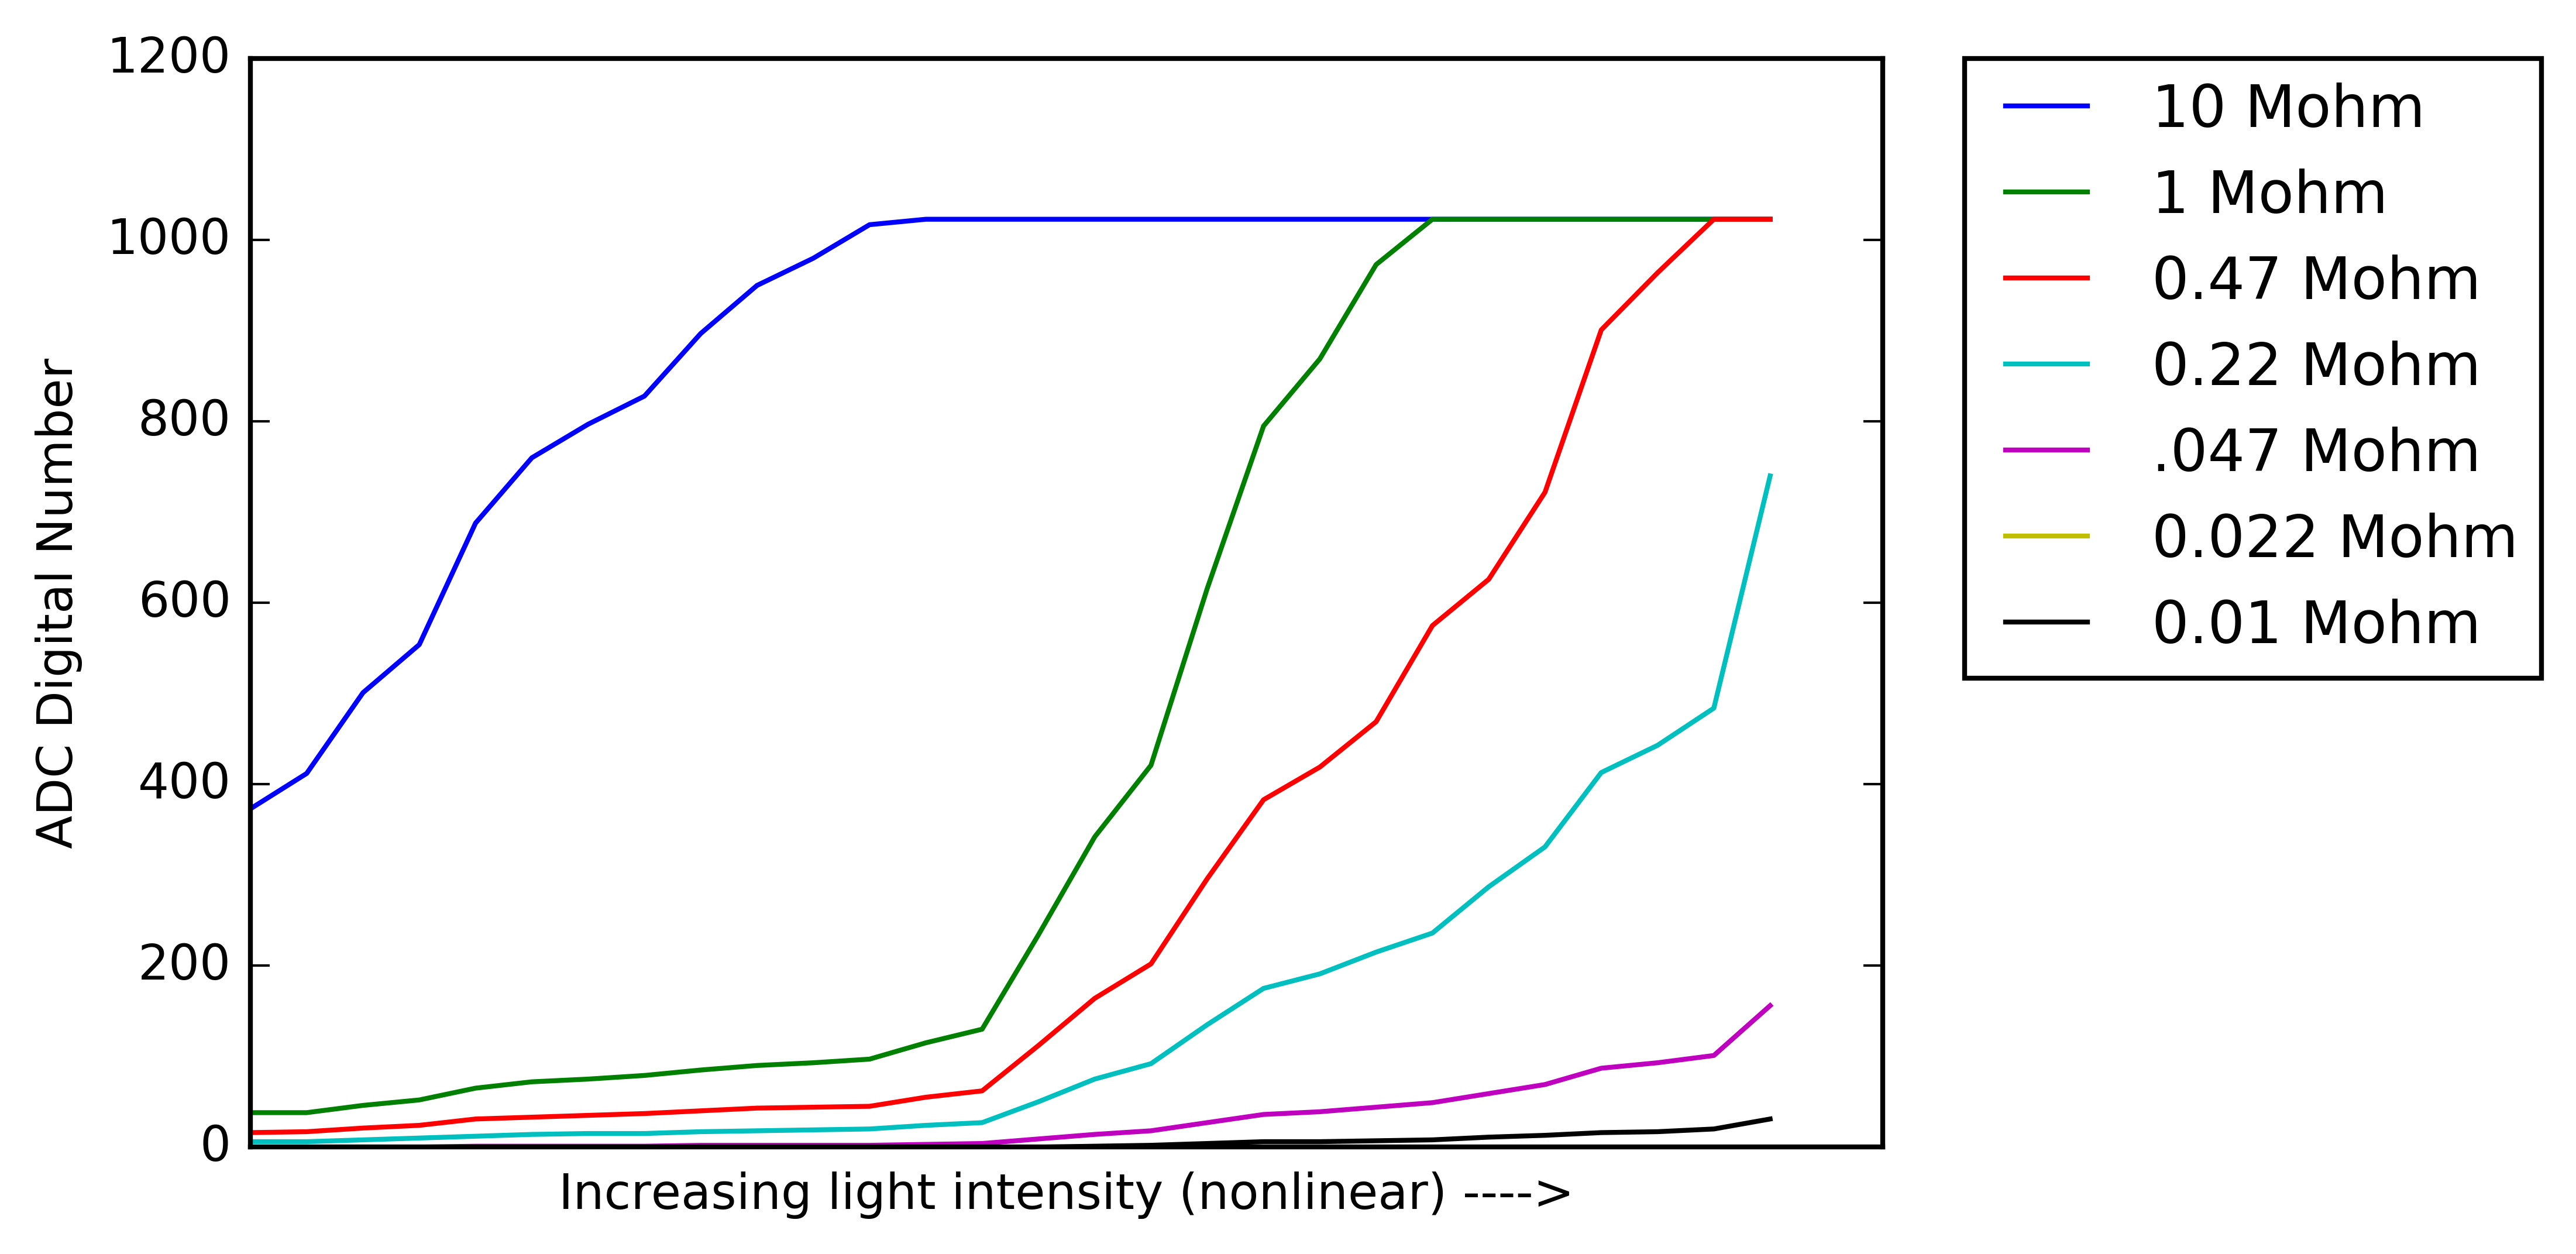
The figure below shows the output of the op-amp for each of the feedback resistors along the light level gradient. One thing to note is that for the 22kOhm resistor there is no data, for some reason it wasn't working correctly I think I messed the resistor up or the mux pin connected to it while soldering the circuit. You can seen that after a certain light intensity the feedback resistors saturate which makes having multiple resistors very valuable, same for the opposite effect at low light levels where there is no/very little response.
![]()
-
PAR Sensor Circuit
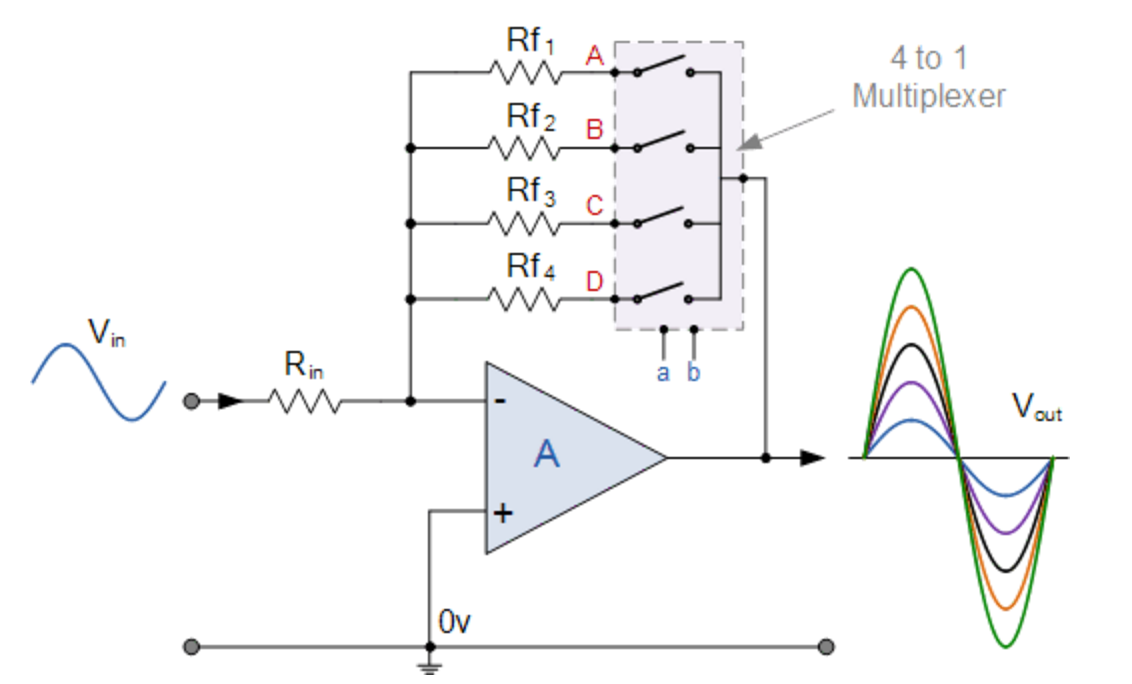
06/14/2016 at 03:19 • 0 commentsI haven’t yet gone over the design of the circuit for the profiler yet but hope to get to it in a few days. Generally, it’ll be based around and Arduino Uno with a custom shield that will contain components to drive the LEDs, amplify the signal from the photodiodes, and so forth. One of the components is the op amp that will be used to convert the current generated by the photodiode to a voltage. Because the light levels will be variable at both the surface and throughout the water column I need to be able to adjust the gain of the sensor without actually changing the feedback resistor. I initially considered using a digital potentiometer to adjust the gain but found that the high resistance values needed for the op-amp (Mohm – Gohm range) made this challenging as most digital pots max out at around 1 Mohm, furthermore the tolerances are generally unacceptably high (~30%). I came across an op amp circuit here where a multiplexer was used to switch between different feedback resistors and decided to give it a try.
Source: http://www.electronics-tutorials.ws/combination/comb_2.html![]()
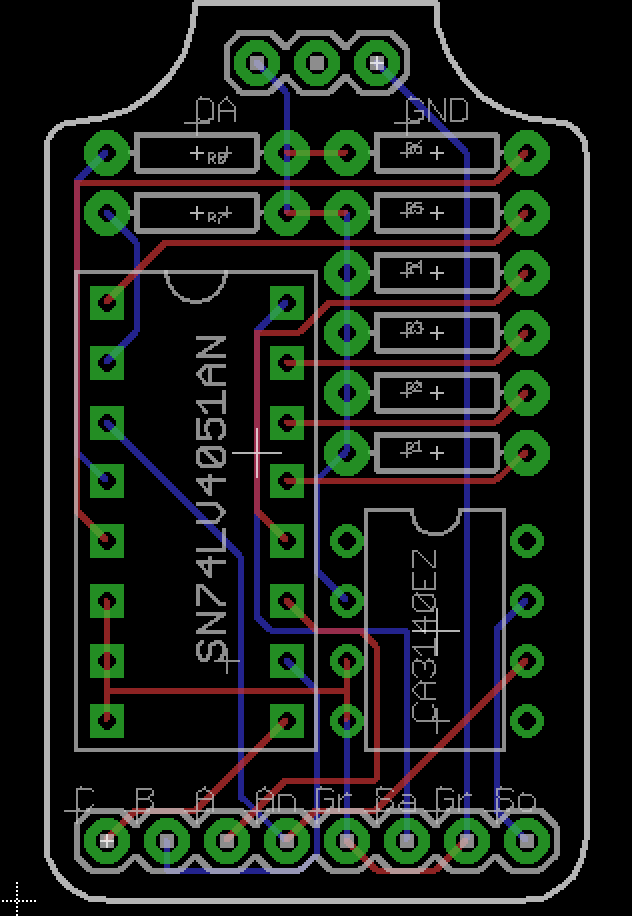
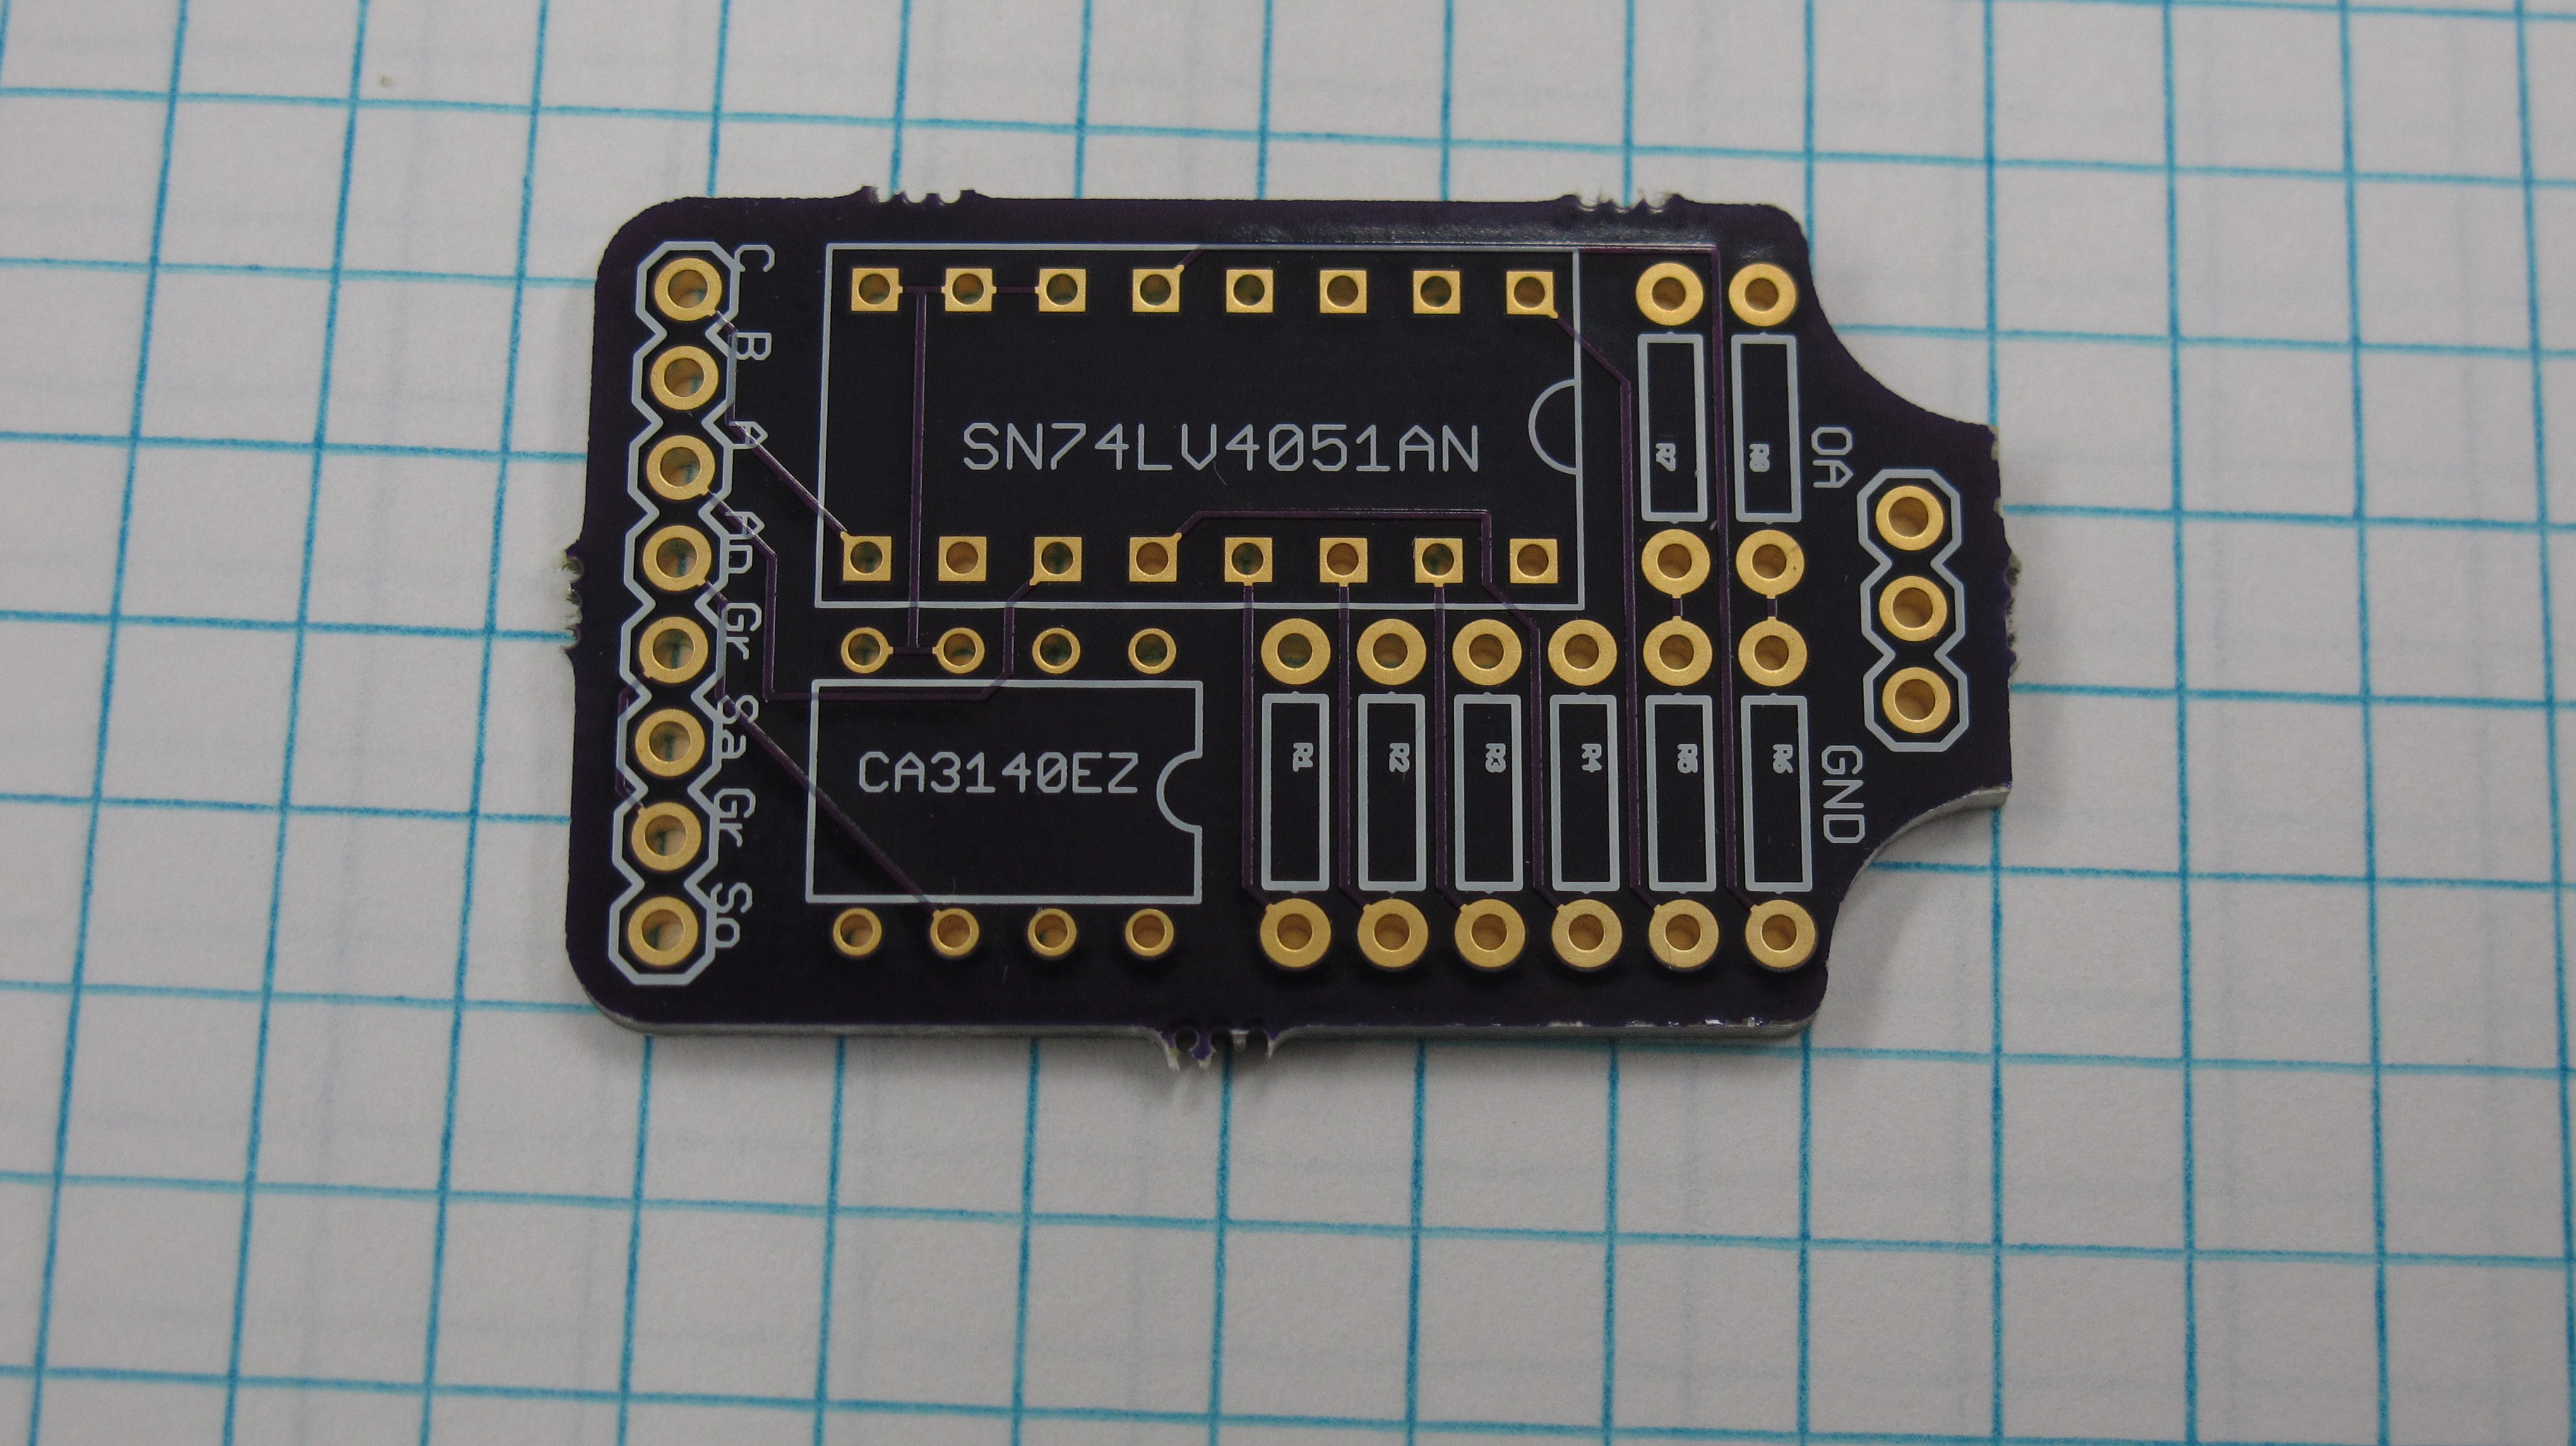
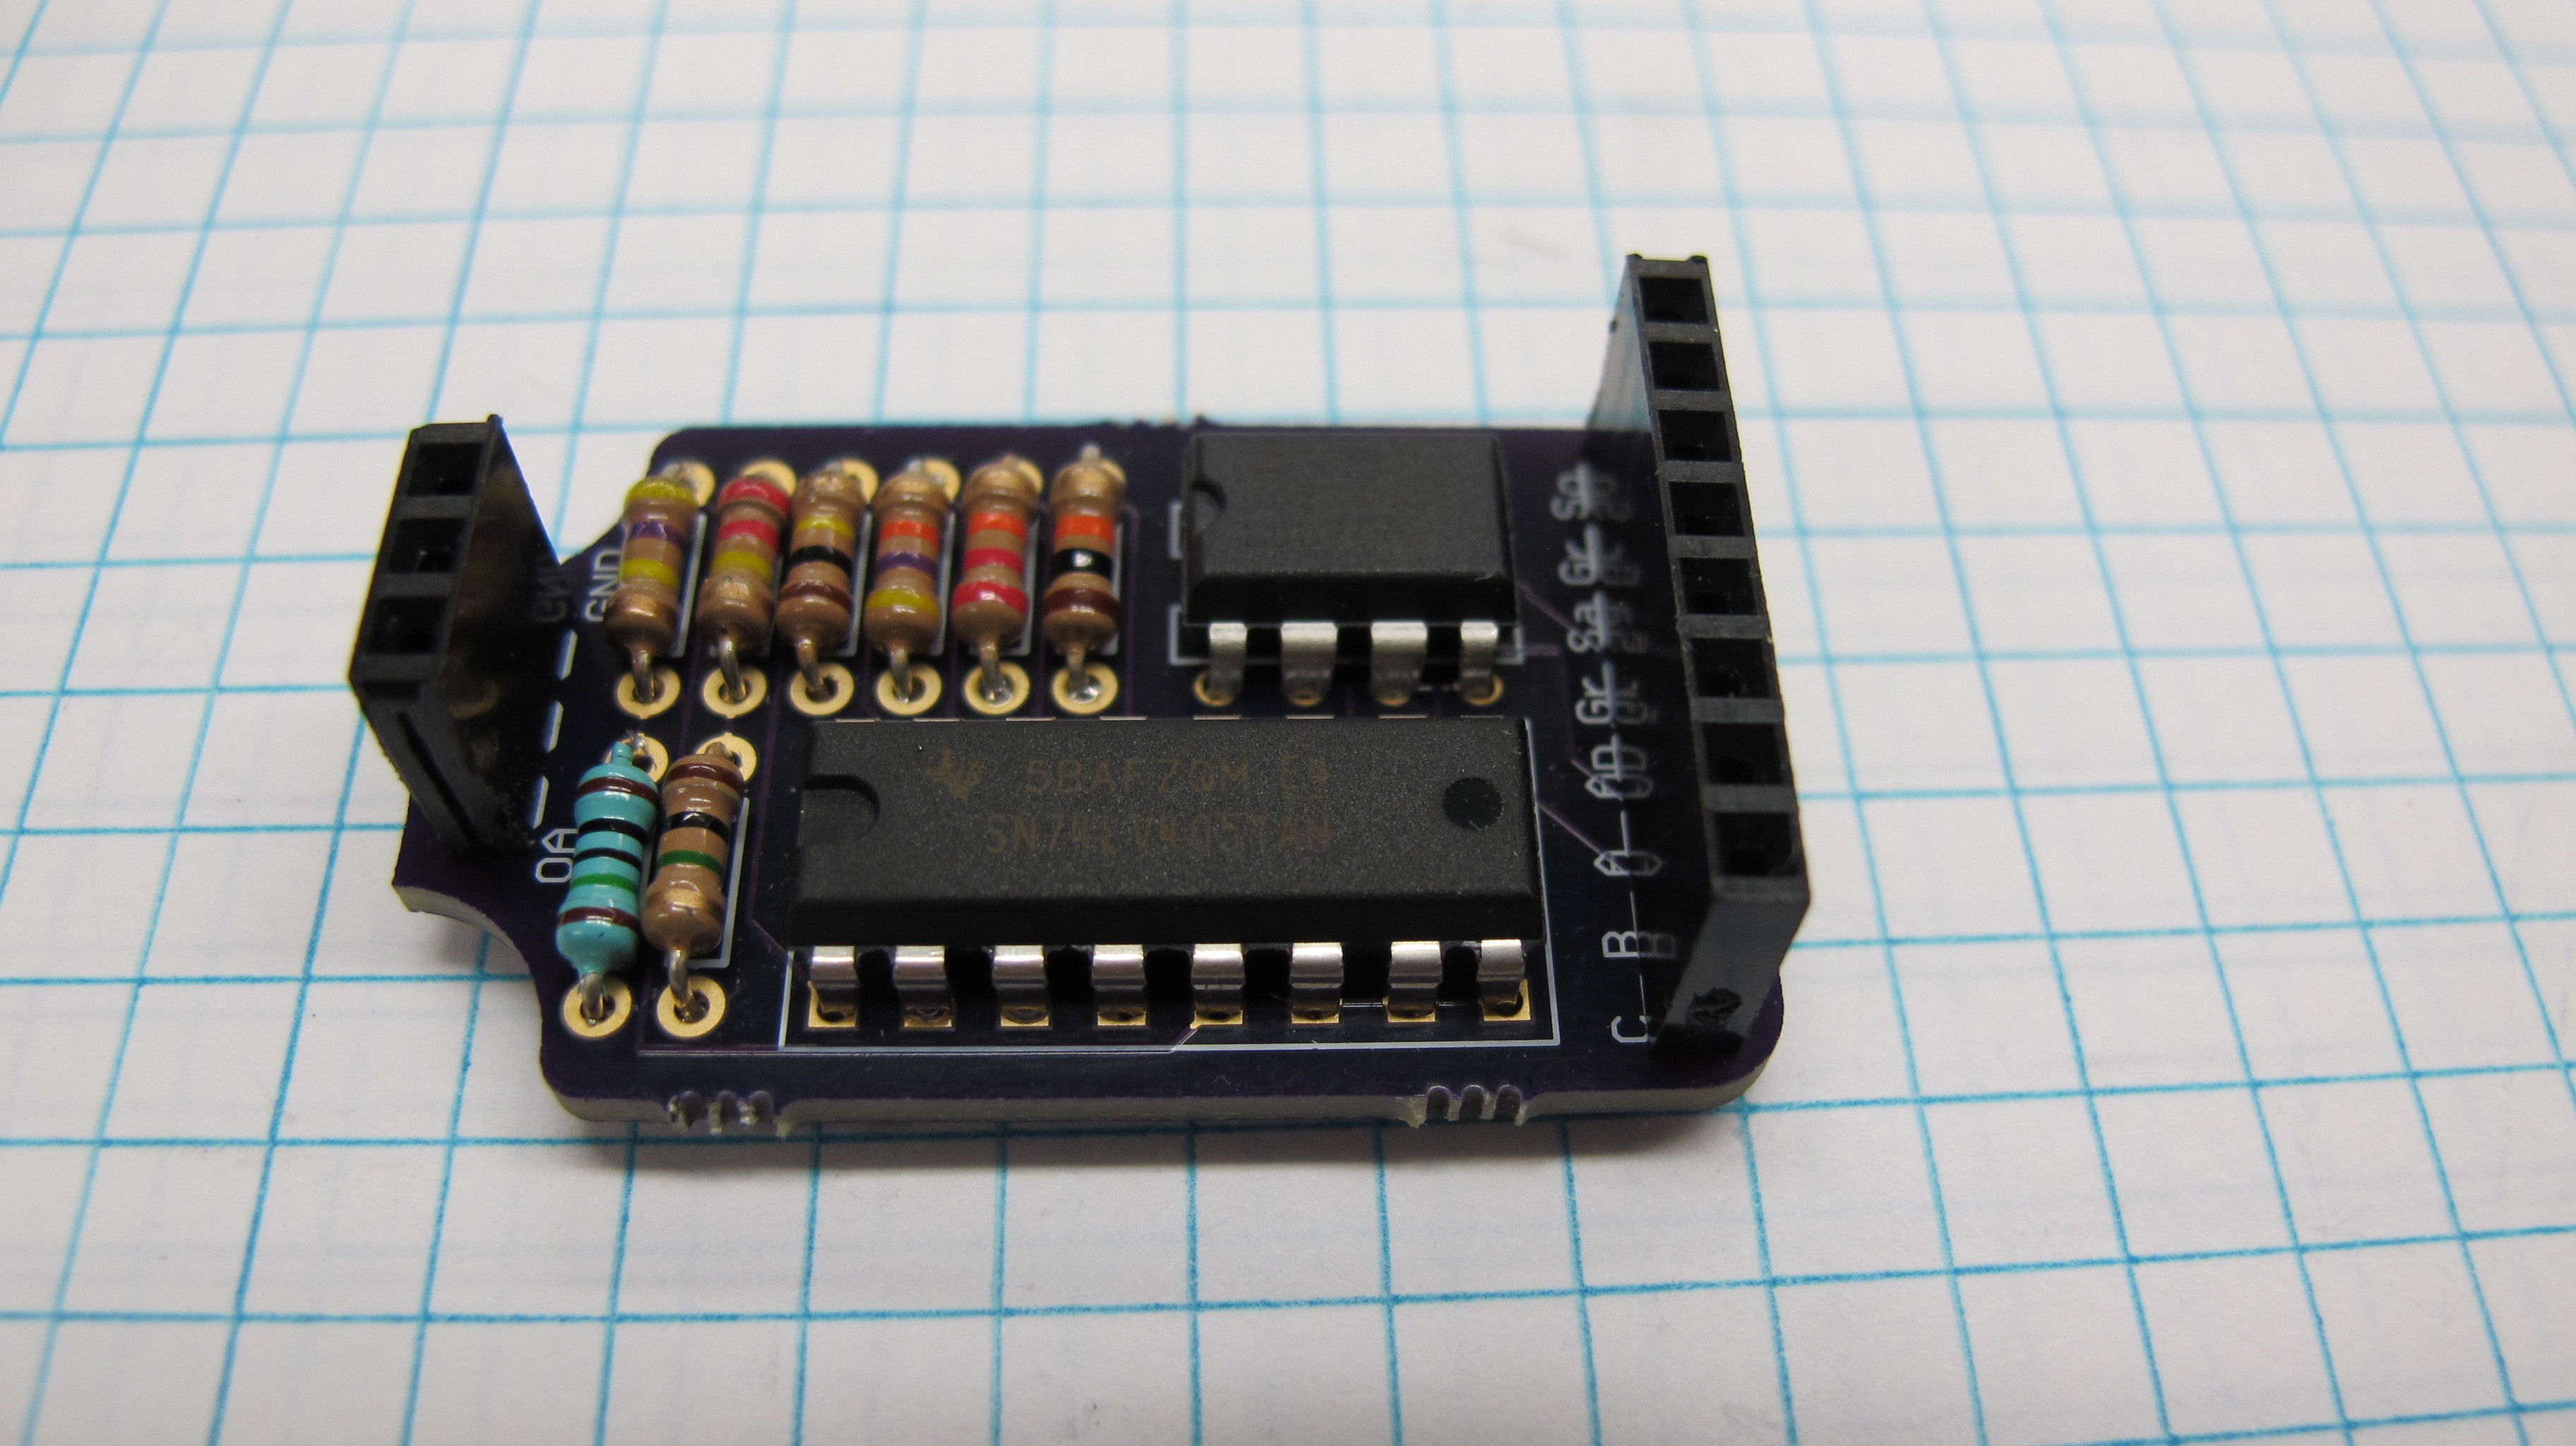
After initial success on a breadboard I designed a PCB in Eagle to do some further testing. The circuit uses an 8 channel SN74LV4051AN mux and a CA3140EZ op-amp giving me 8 different gain values. The mux is powered by the 5v line from the Arduino, while the op amp is powered by an external power source. The 3 pins at the top of the circuits are for a header to connect the photodiode, the photodiode only has two leads while the header was designed to accommodate the space between them. Pins A-C connect to the selector line of the mux and are set by 3 digital pins on the Arduino.
![]()
![]()
![]()
Currently I don't have any feedback capacitors in the circuit and didn't specifically design it to accommodate them but I will need them and figure for the time being I can just solder them in parallel with the resistors as the holes are large enough to fit both the capacitor and resistor pins. One of the reasons I have not done so yet is that I am unsure of the values to use, and for testing purposes now the circuit seems to work reasonably well.
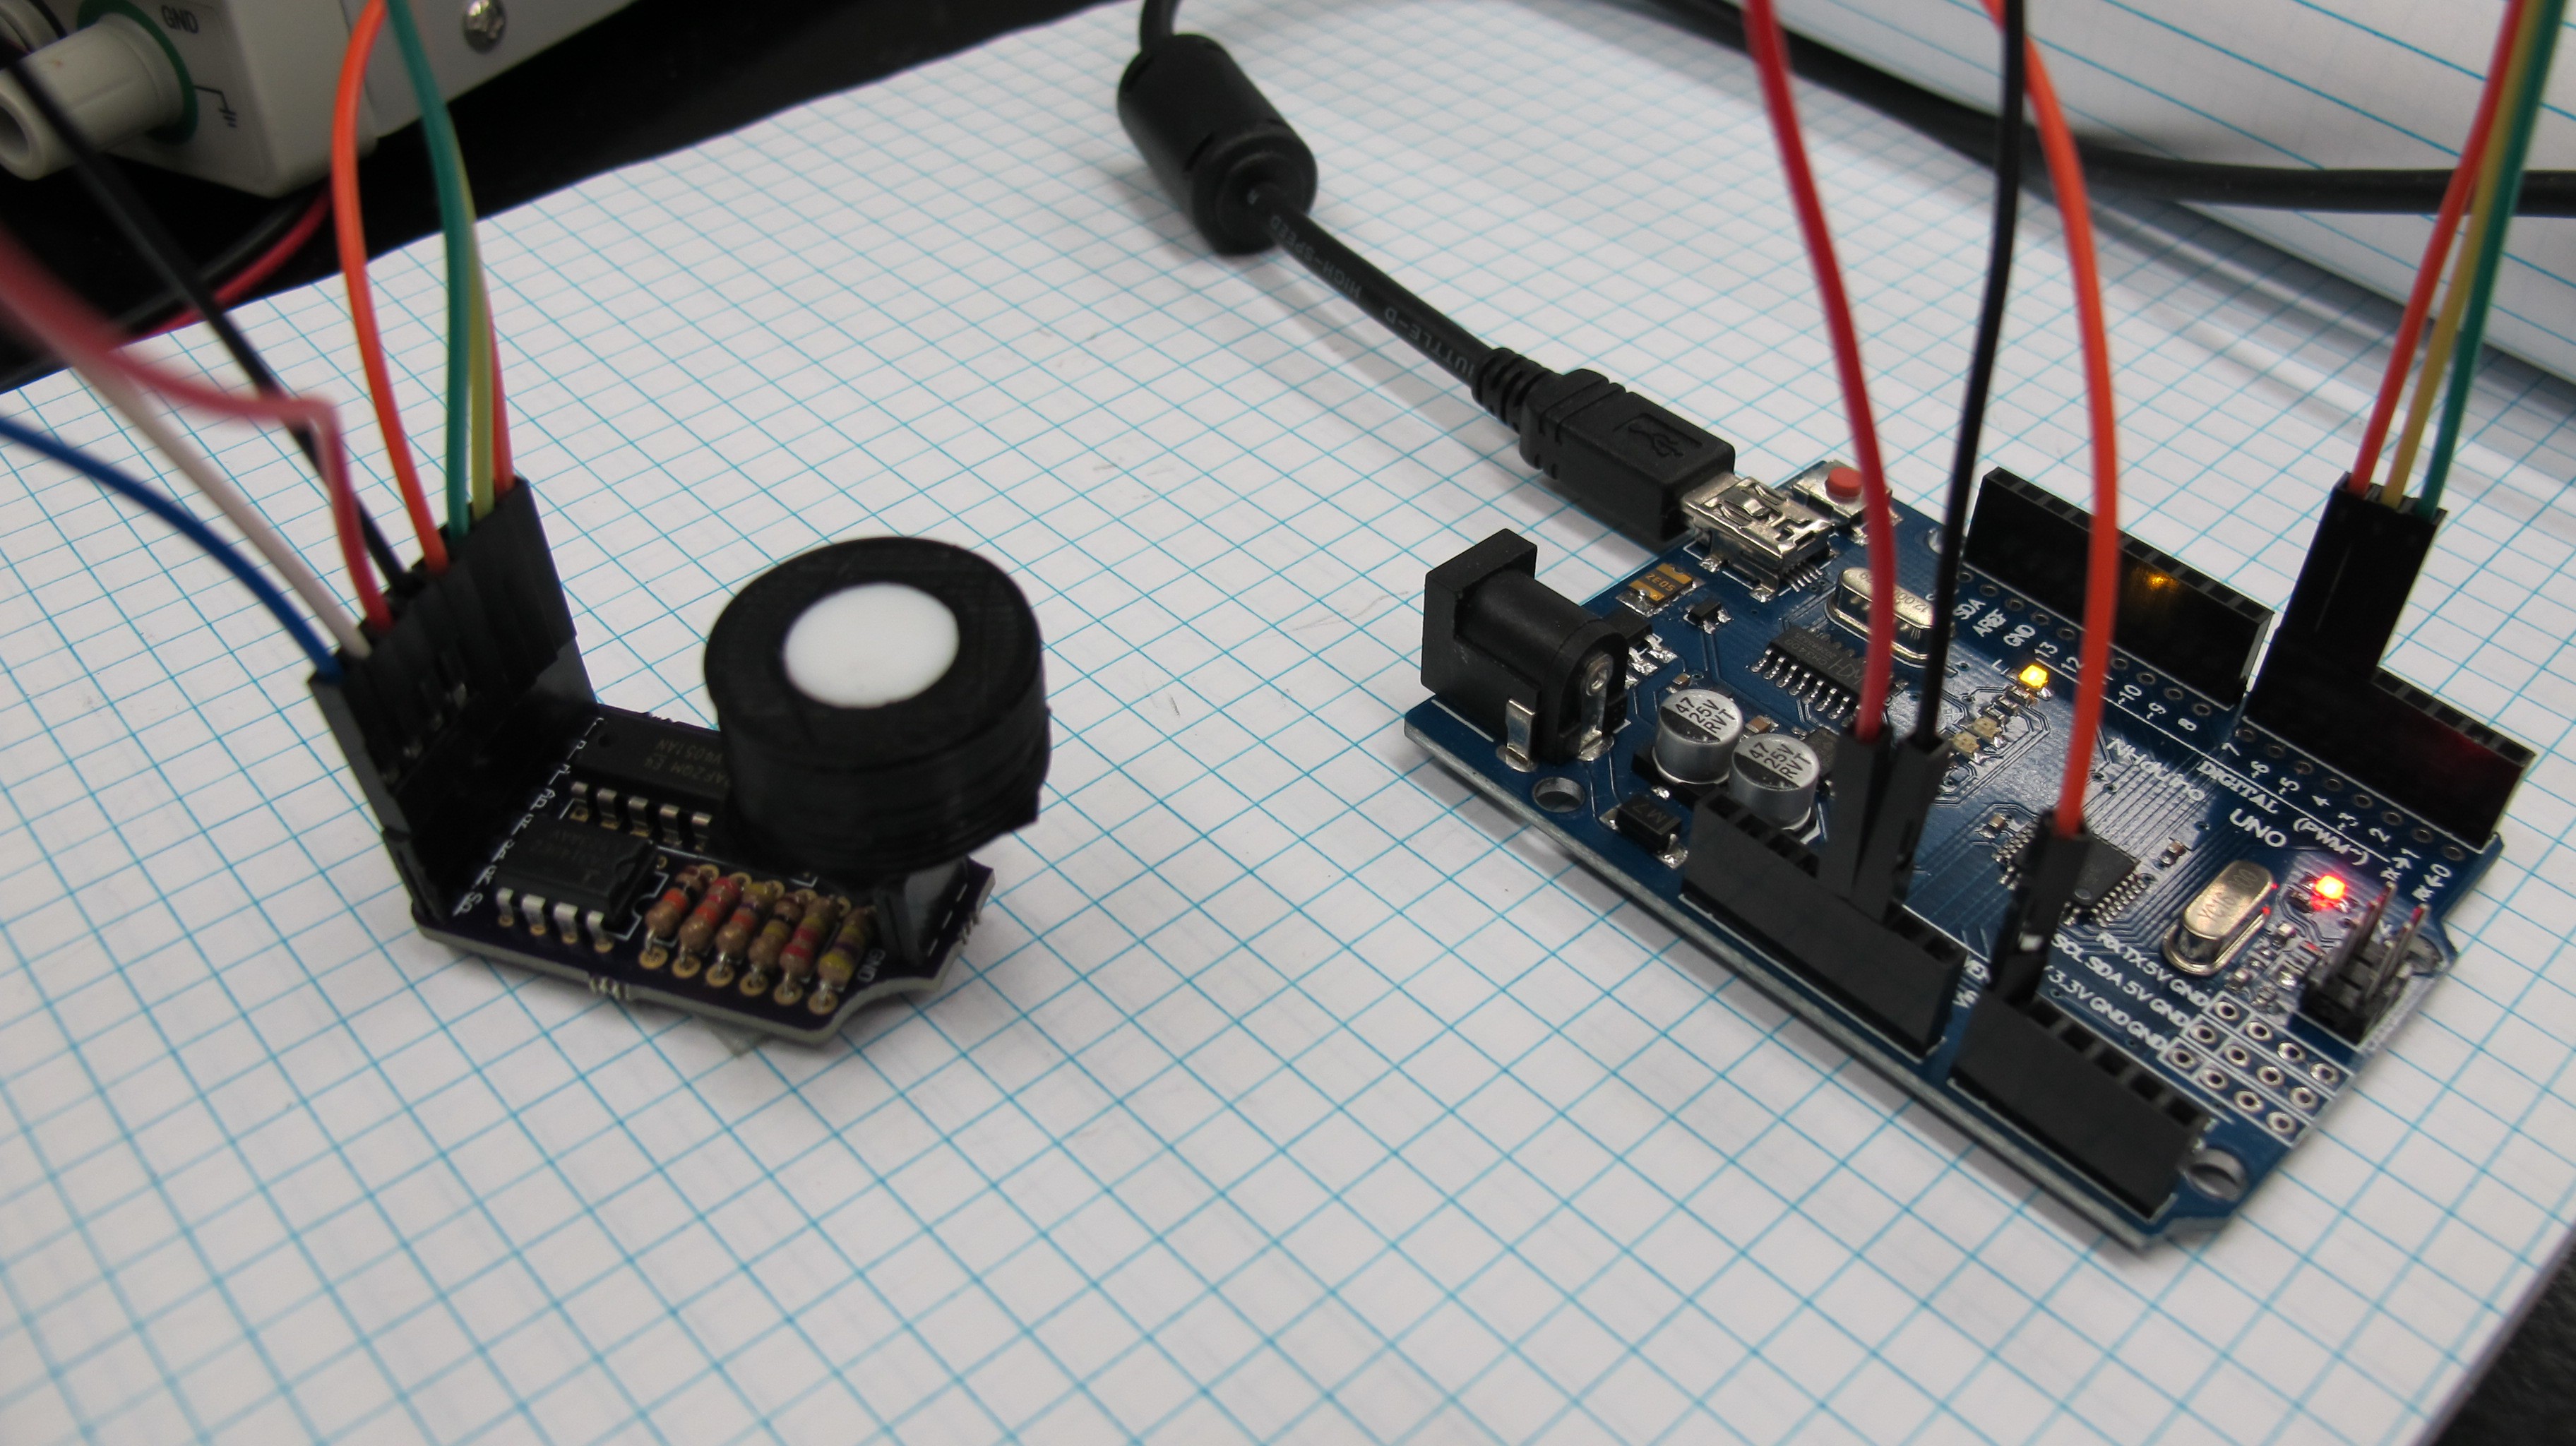
Testing
![]()
More to come.........
-
Design and testing of the PAR sensor
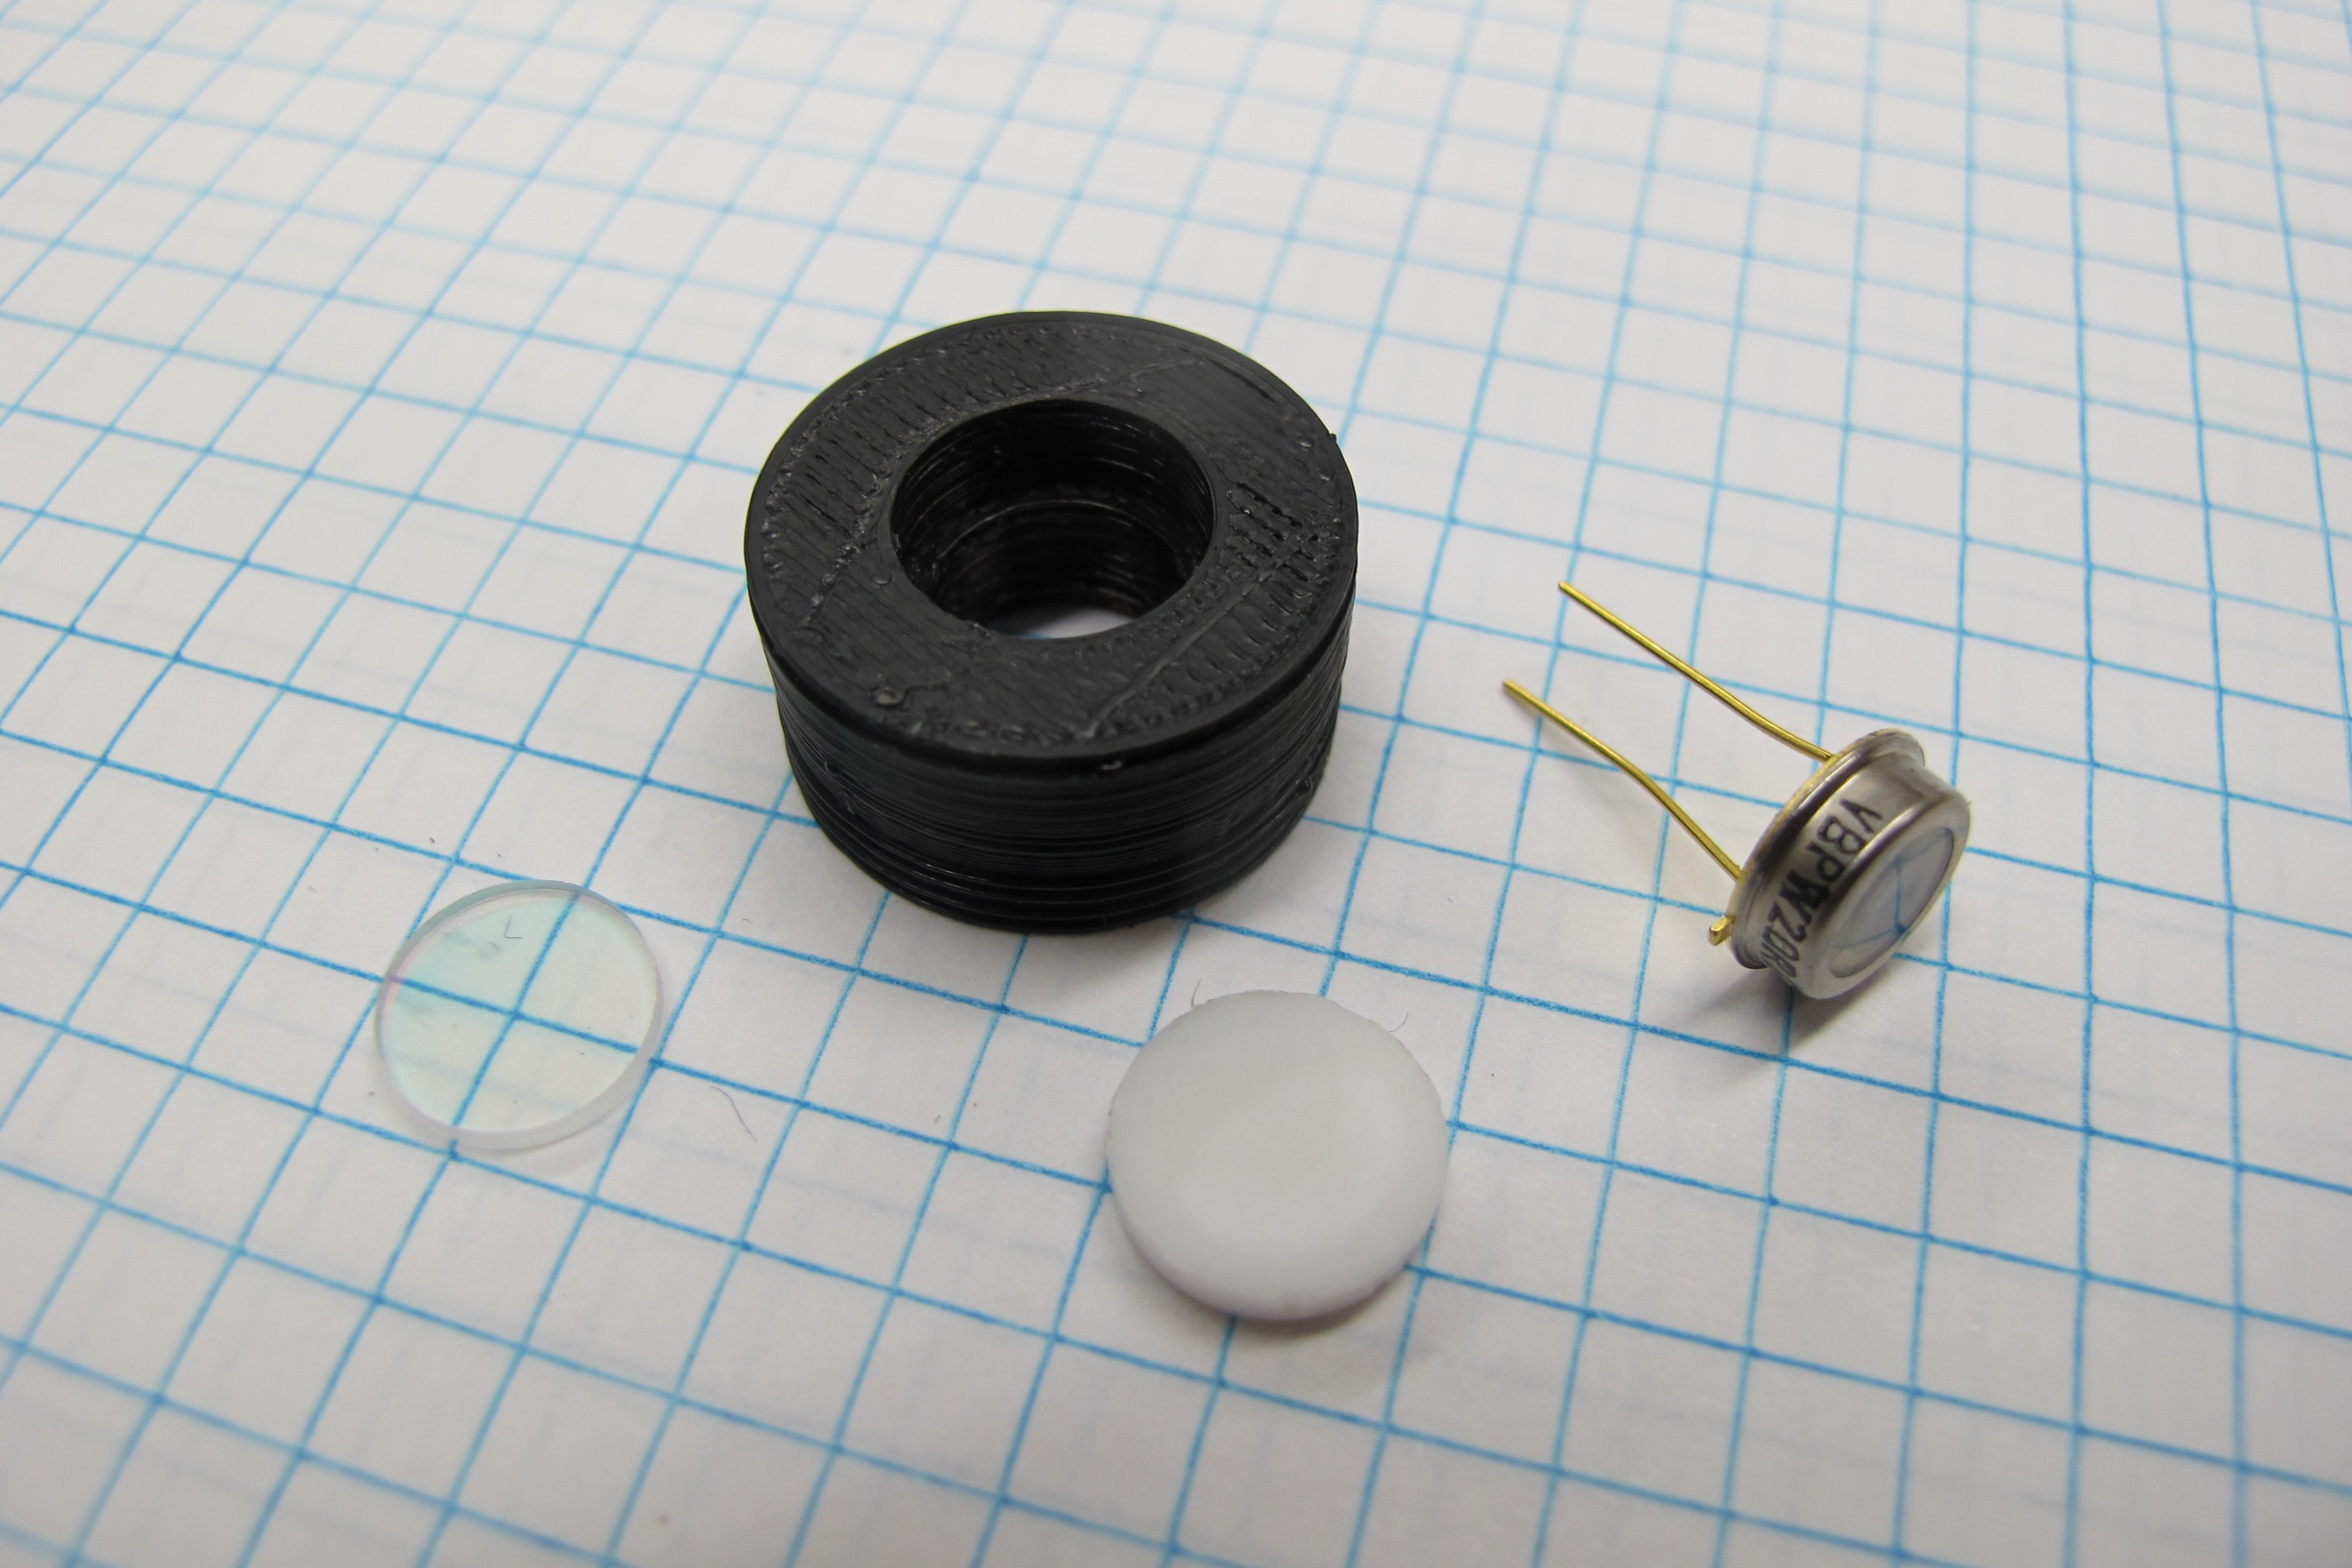
06/08/2016 at 18:10 • 0 commentsThe most important component of the profiler is the PAR sensor which is using to measure downwelling irradiance at the surface and through the water column. In order to measure downwelling irradiance the sensor must measure light across the entire upward looking hemisphere and the irradiance must be weighted by the cosine of the angle of incidence, according to Lambert’s Cosine law. Diffusers made from materials like acrylic, Teflon or plastic are commonly placed over the photodiode to achieve a cosine corrected response. Additionally, a filter is needed to get the correct spectral response (400-700 nm) from the sensor.
![]()
![]()
Diffusing disk
I cut the diffusing disk from a 2mm thick piece of PTFE using a cork borer which had an inner diameter of about 10mm. By rotating the borer while applying downward pressure I was able to get perfectly round disks. To get a clean cut its important the borer be sharp and held perpendicular to the sheet of PTFE.
![]()
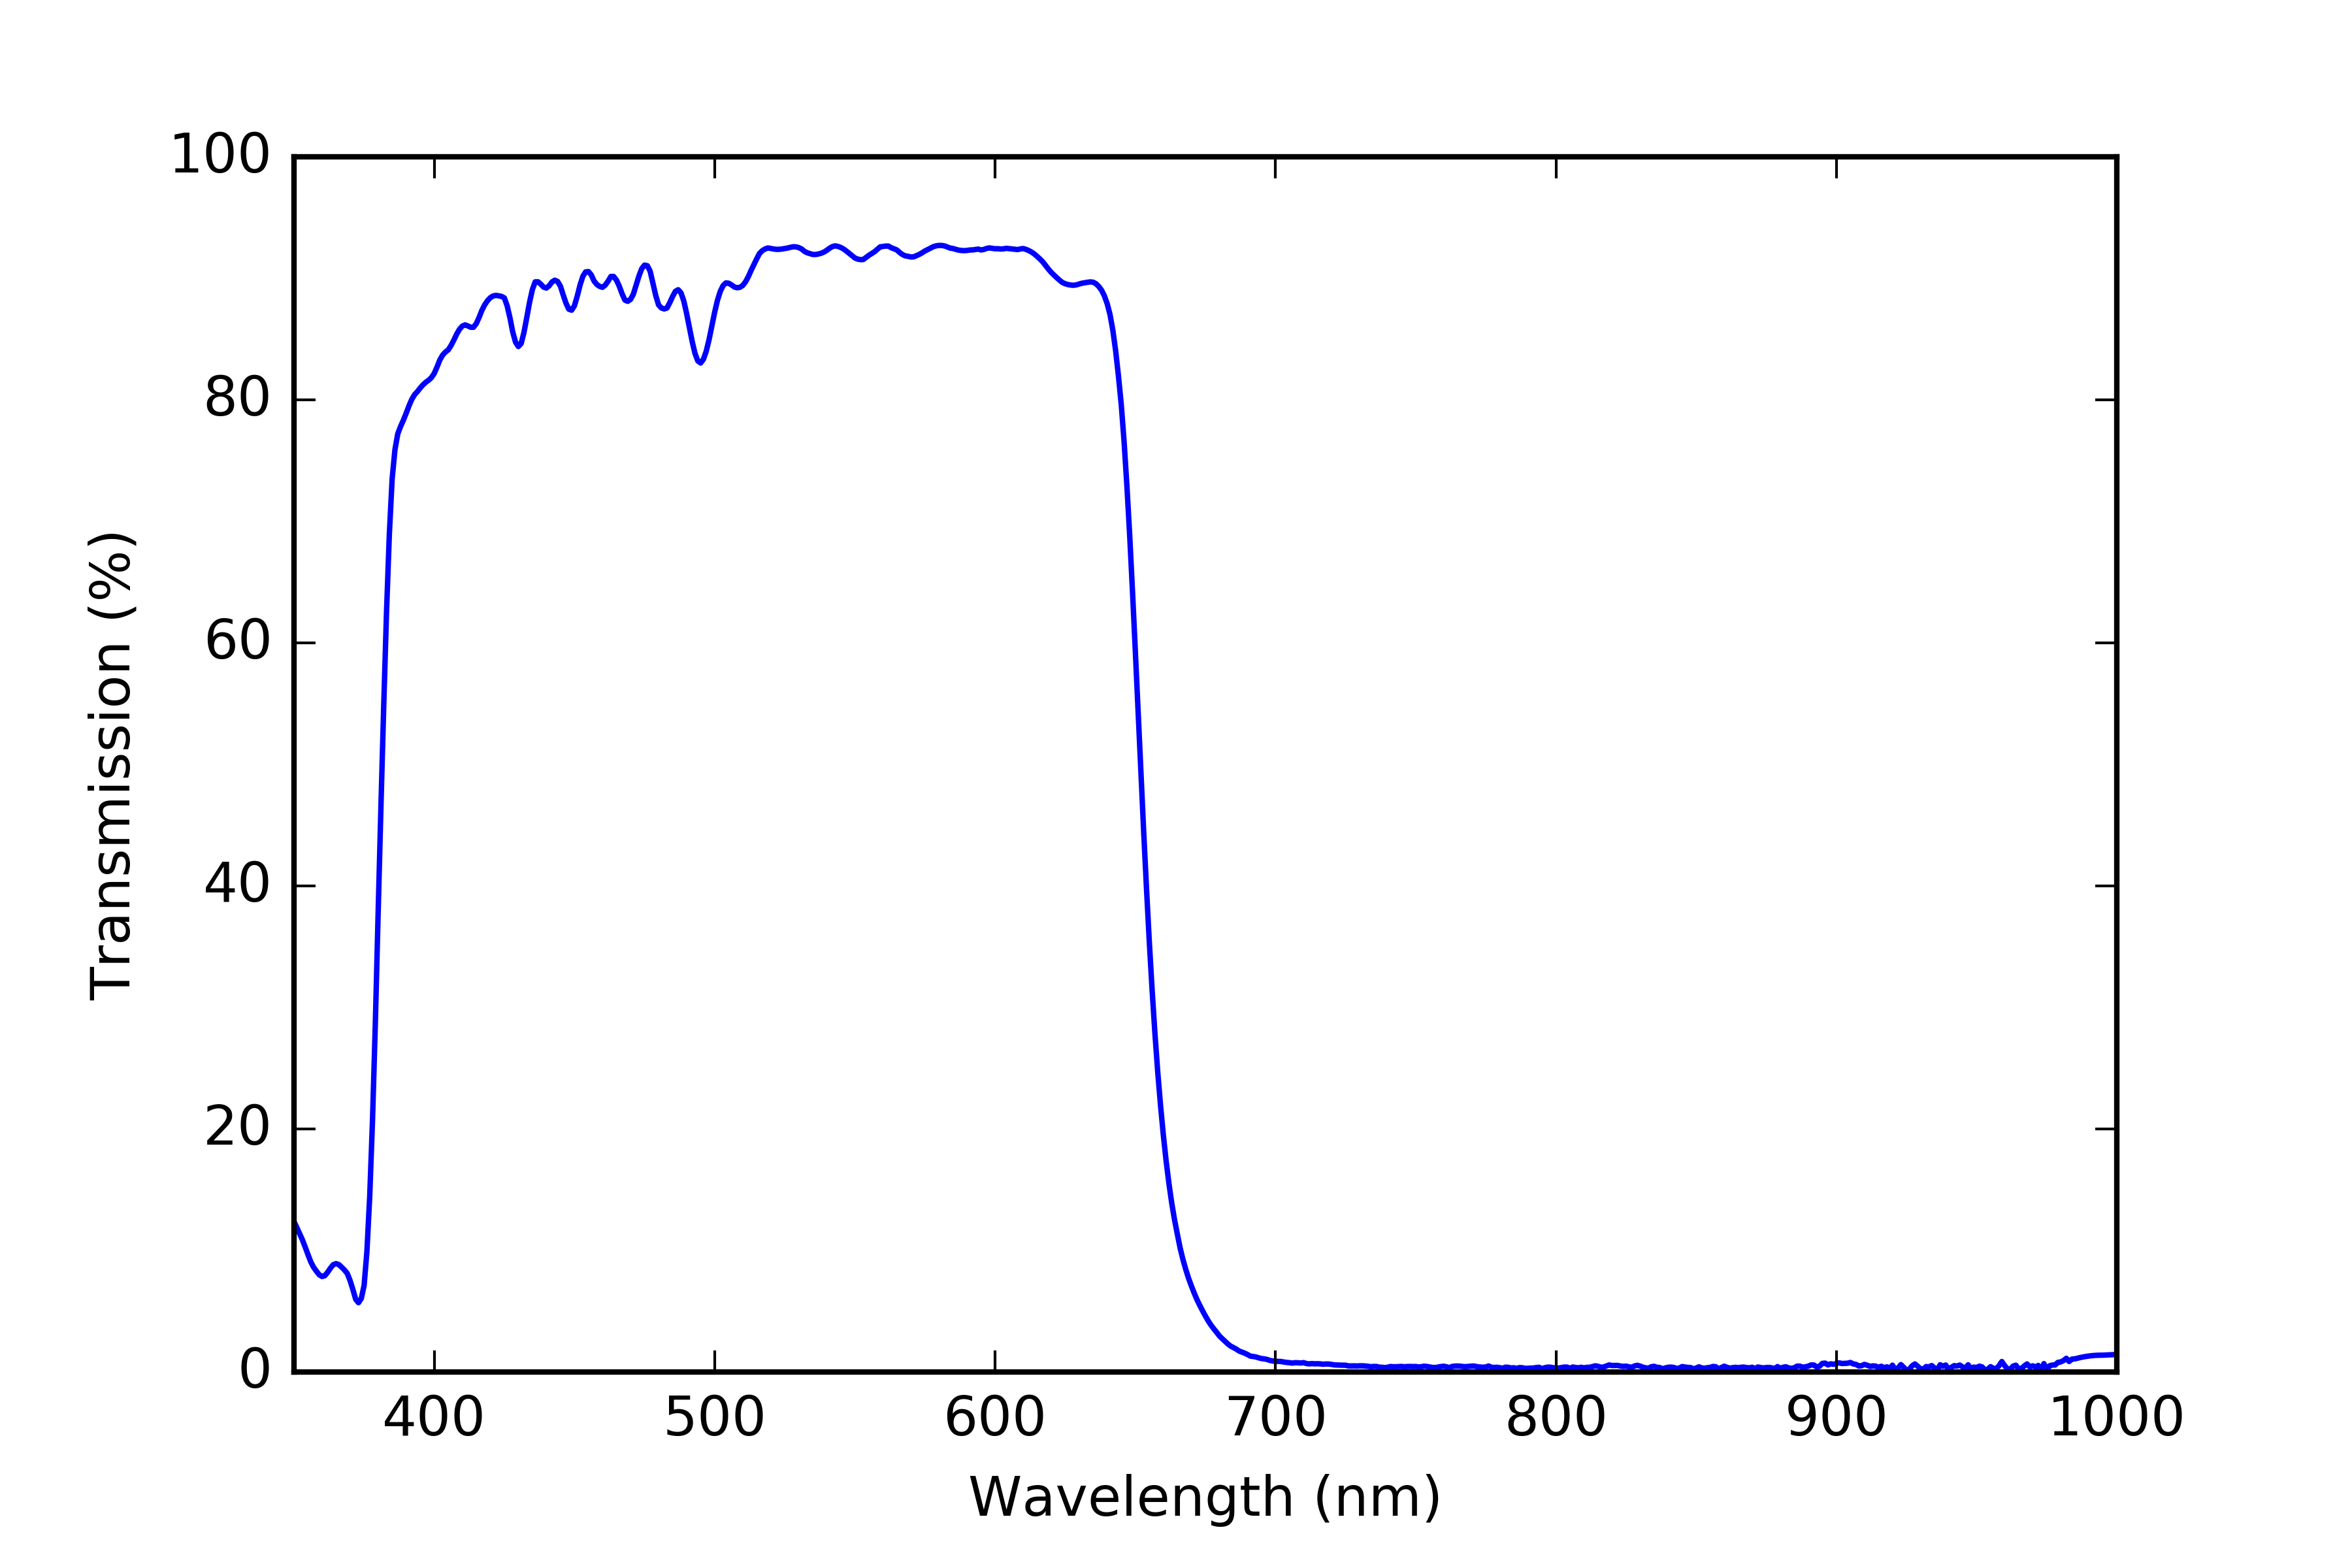
Visible bandpass filter
The visible bandpass filter is an important part of the PAR sensor because it restricts the wavelengths of light reaching the photodiode to those used in photosynthesis (400-700 nm). I found some UV-IR cut filters on eBay for cheap and decided to try them out. Details about the spectral characteristics of the filters were sparse so I measured the transmissivity of the filters myself using a spectrometer.
![]()
You can see the the filter cuts off a bit short of 700 nm which is not ideal but without spending a lot more money I don’t think I’ll be able to do any better, so for now I’m going to stick with them
Photodiode
I’m using a Vishay BPW 20 photodiode to measure the light levels in the PAR sensor it’s a cheap (~$6) sensor that has sensitivity between 375 – 1175 nm. For the purpose of testing the cosine response of the sensor I connected the photodiode to an amplifier circuit using CA3140EZ op amp. I will go into more detail about the op amp circuit in the next project log.
Testing
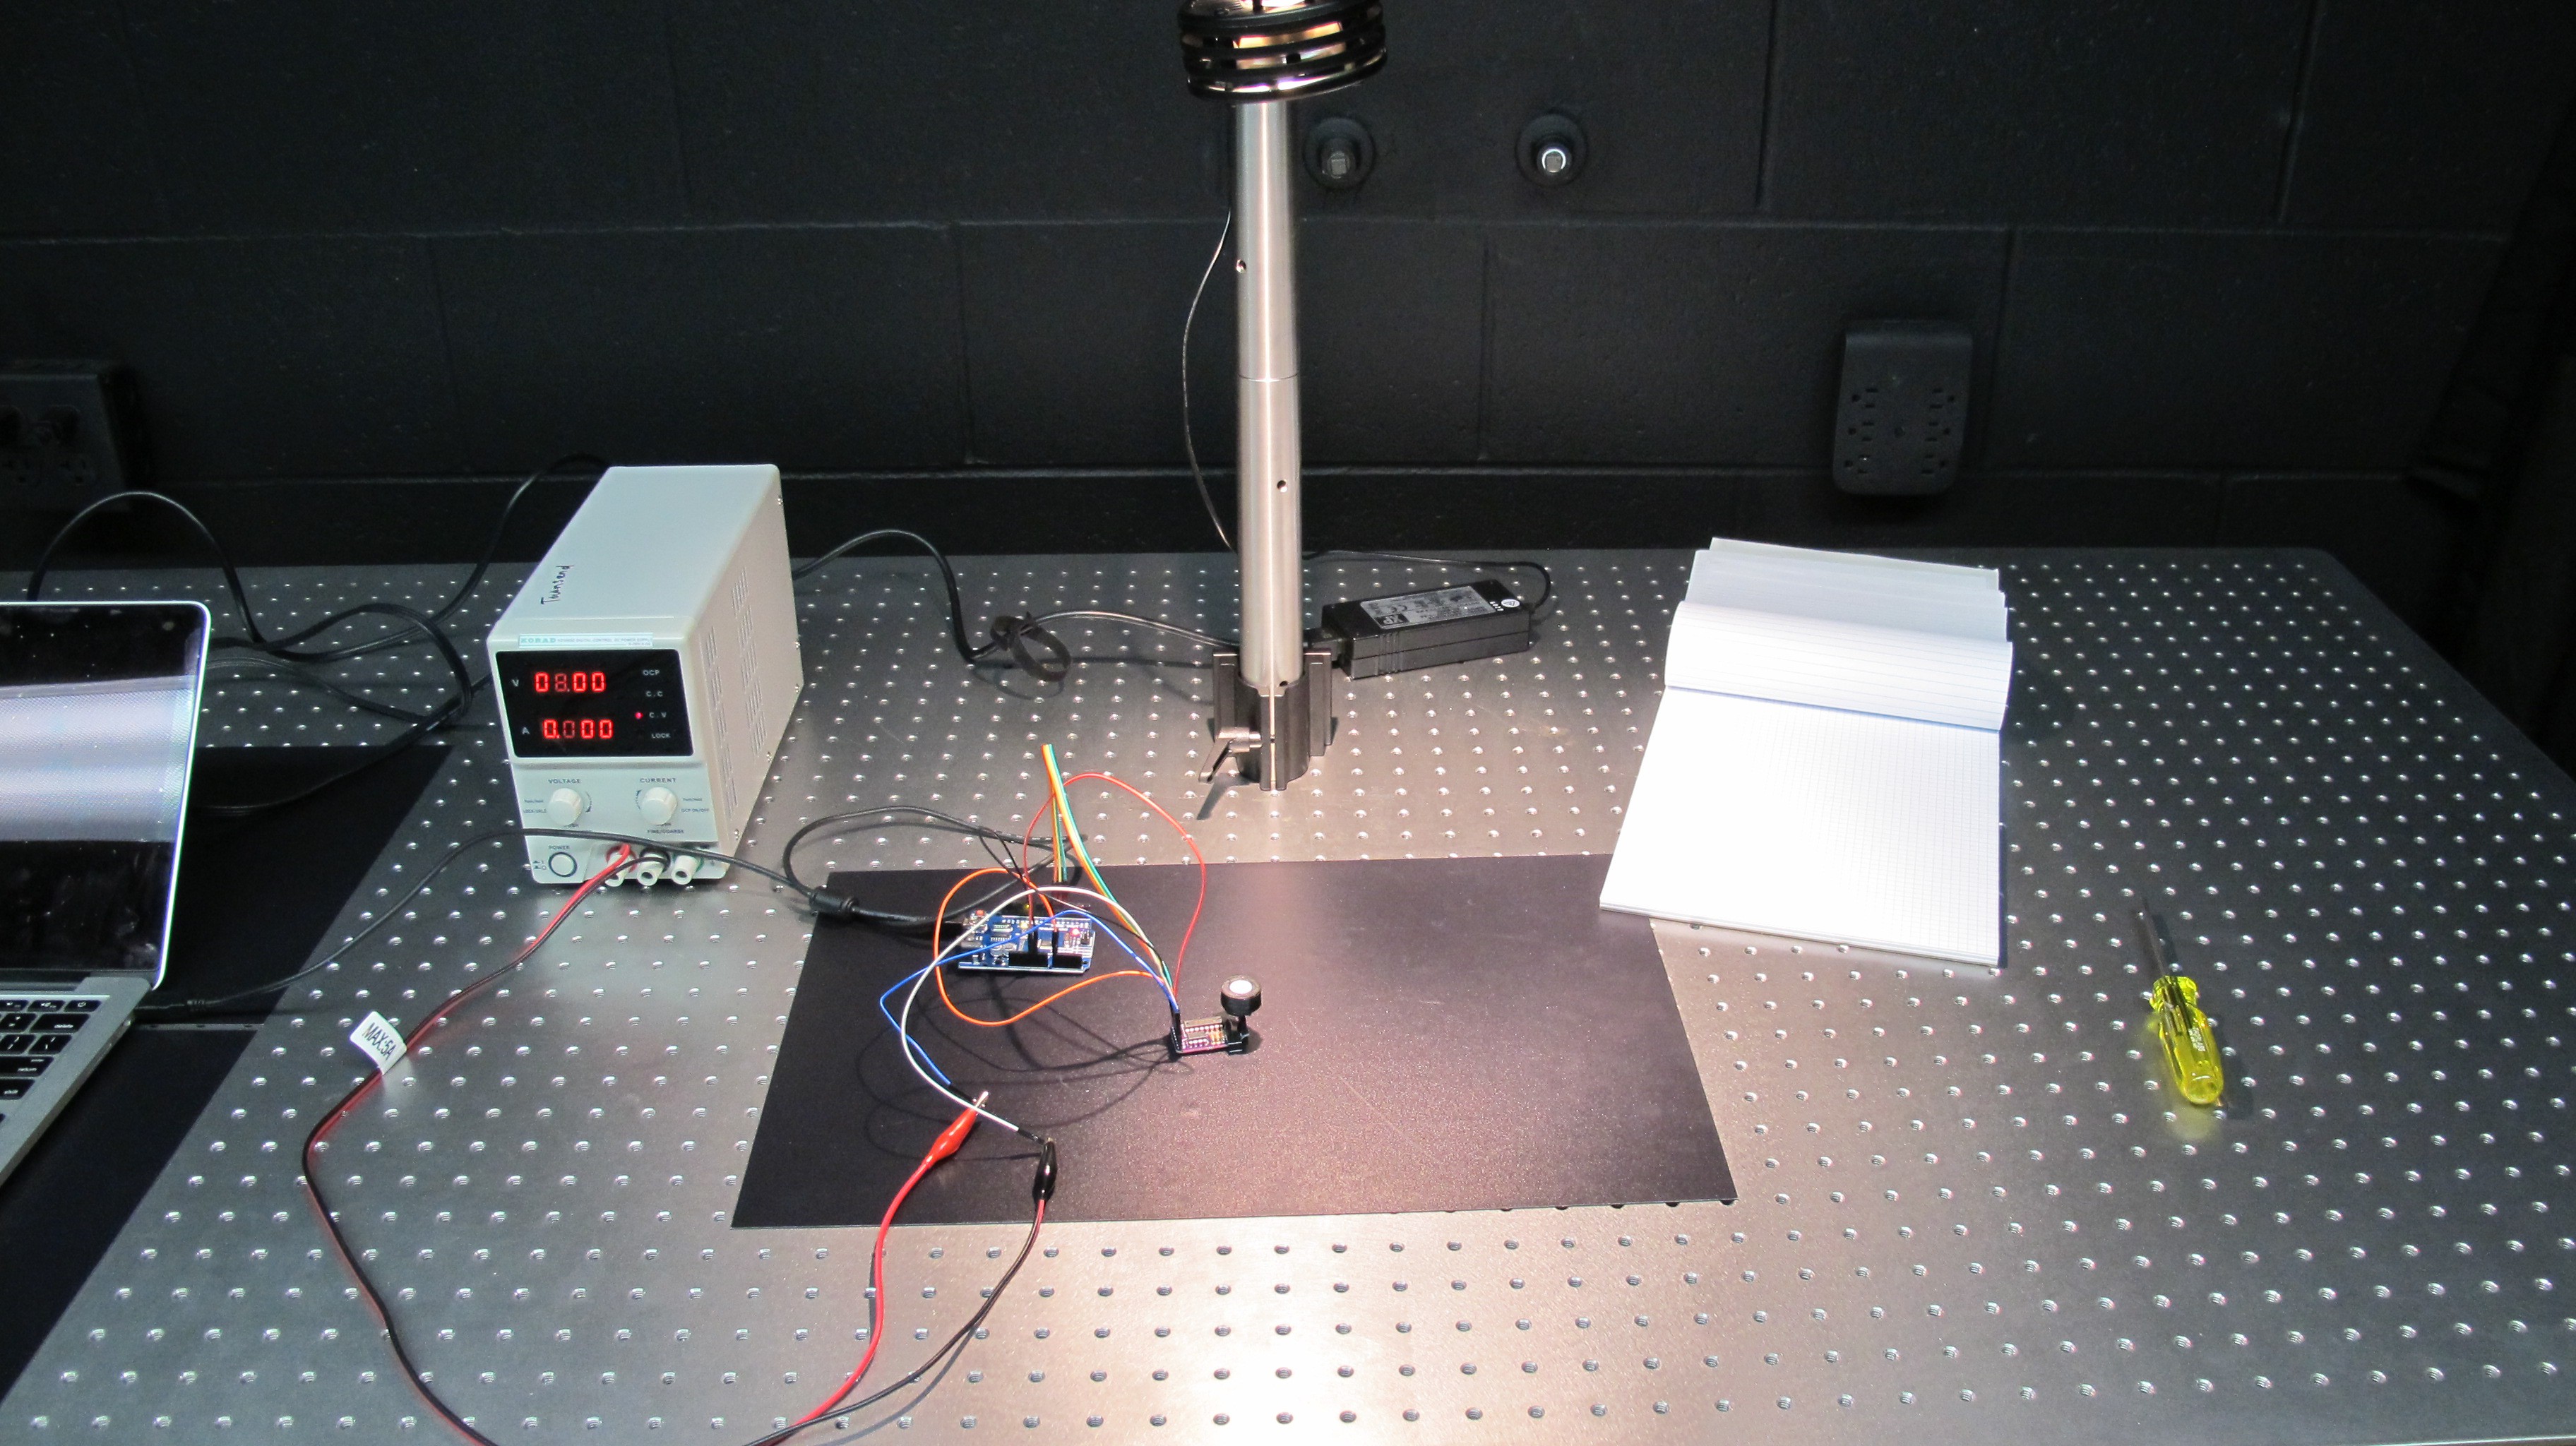
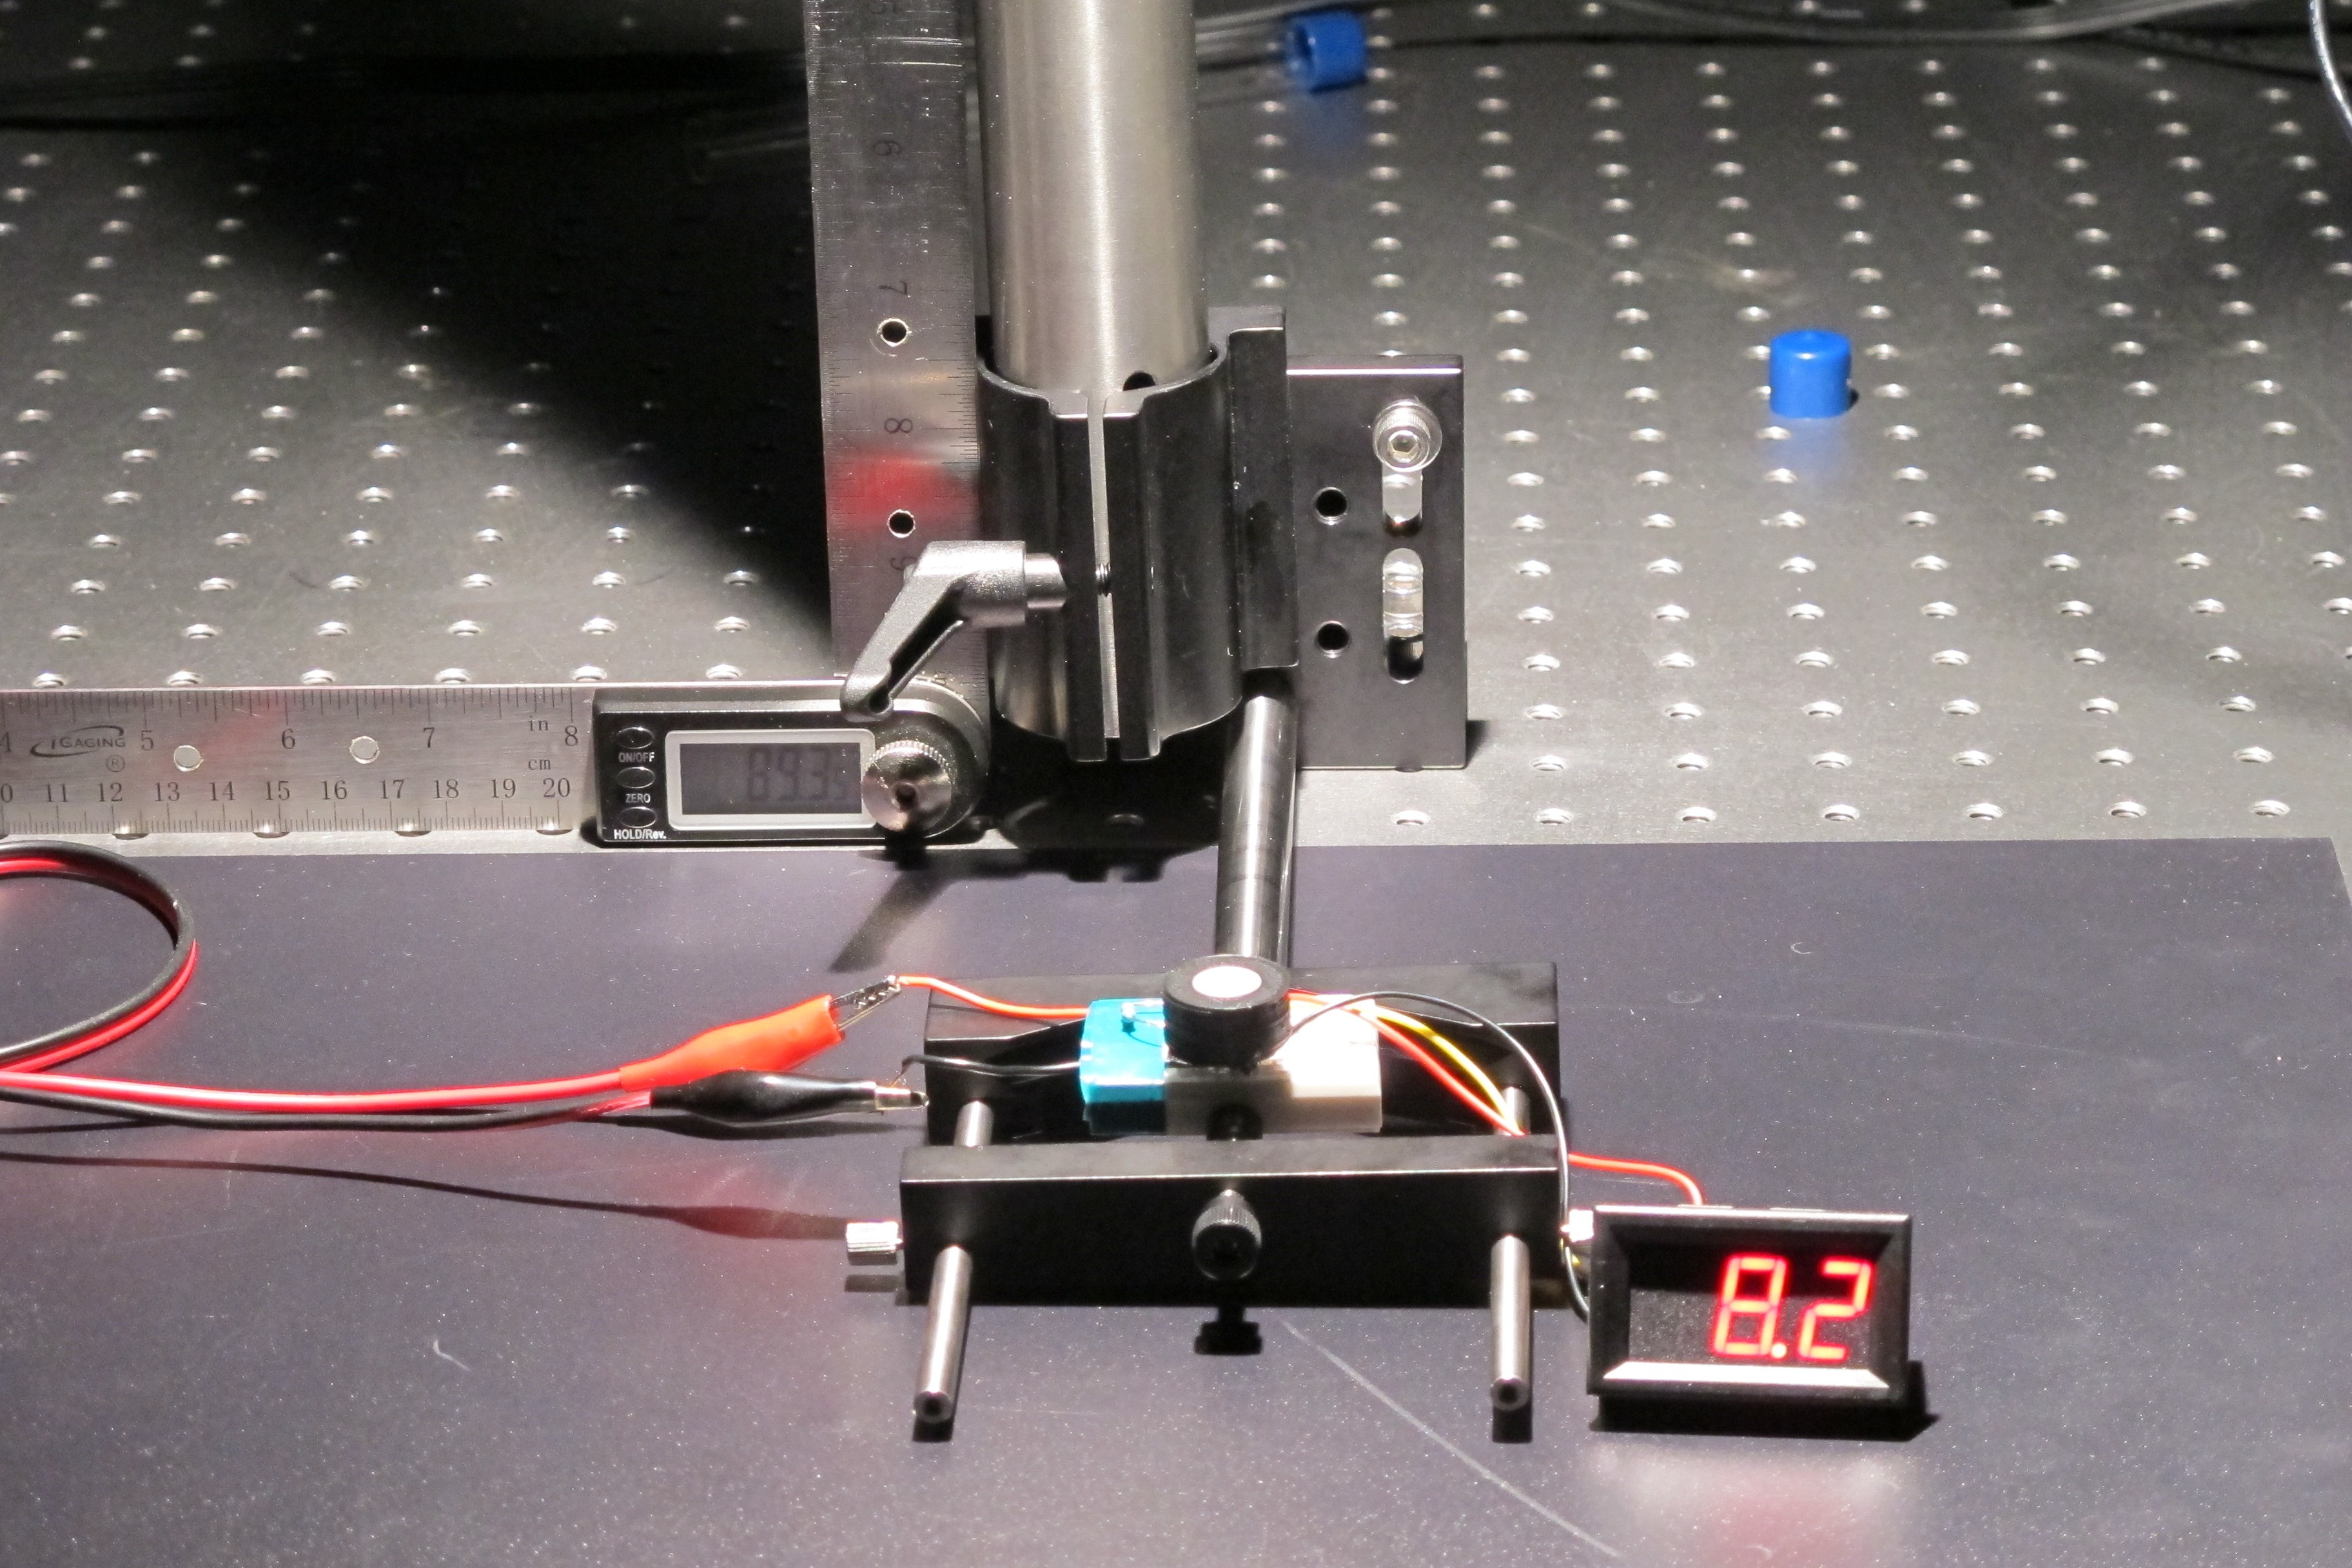
To test the cosine response, I set the sensor up on an optical bench at the base of a large arm with a solar lamp at the end. The arm was mounted to allow it to swing about its base and the angle of the arm relative to the surface of the cosine receptor was measured using a digital protractor.
![]()
I the moved the lamp from directly above the sensor ( 0°) to perpendicular ( 90°) while recording the output voltage of the circuit at different angles along the way.
![]()
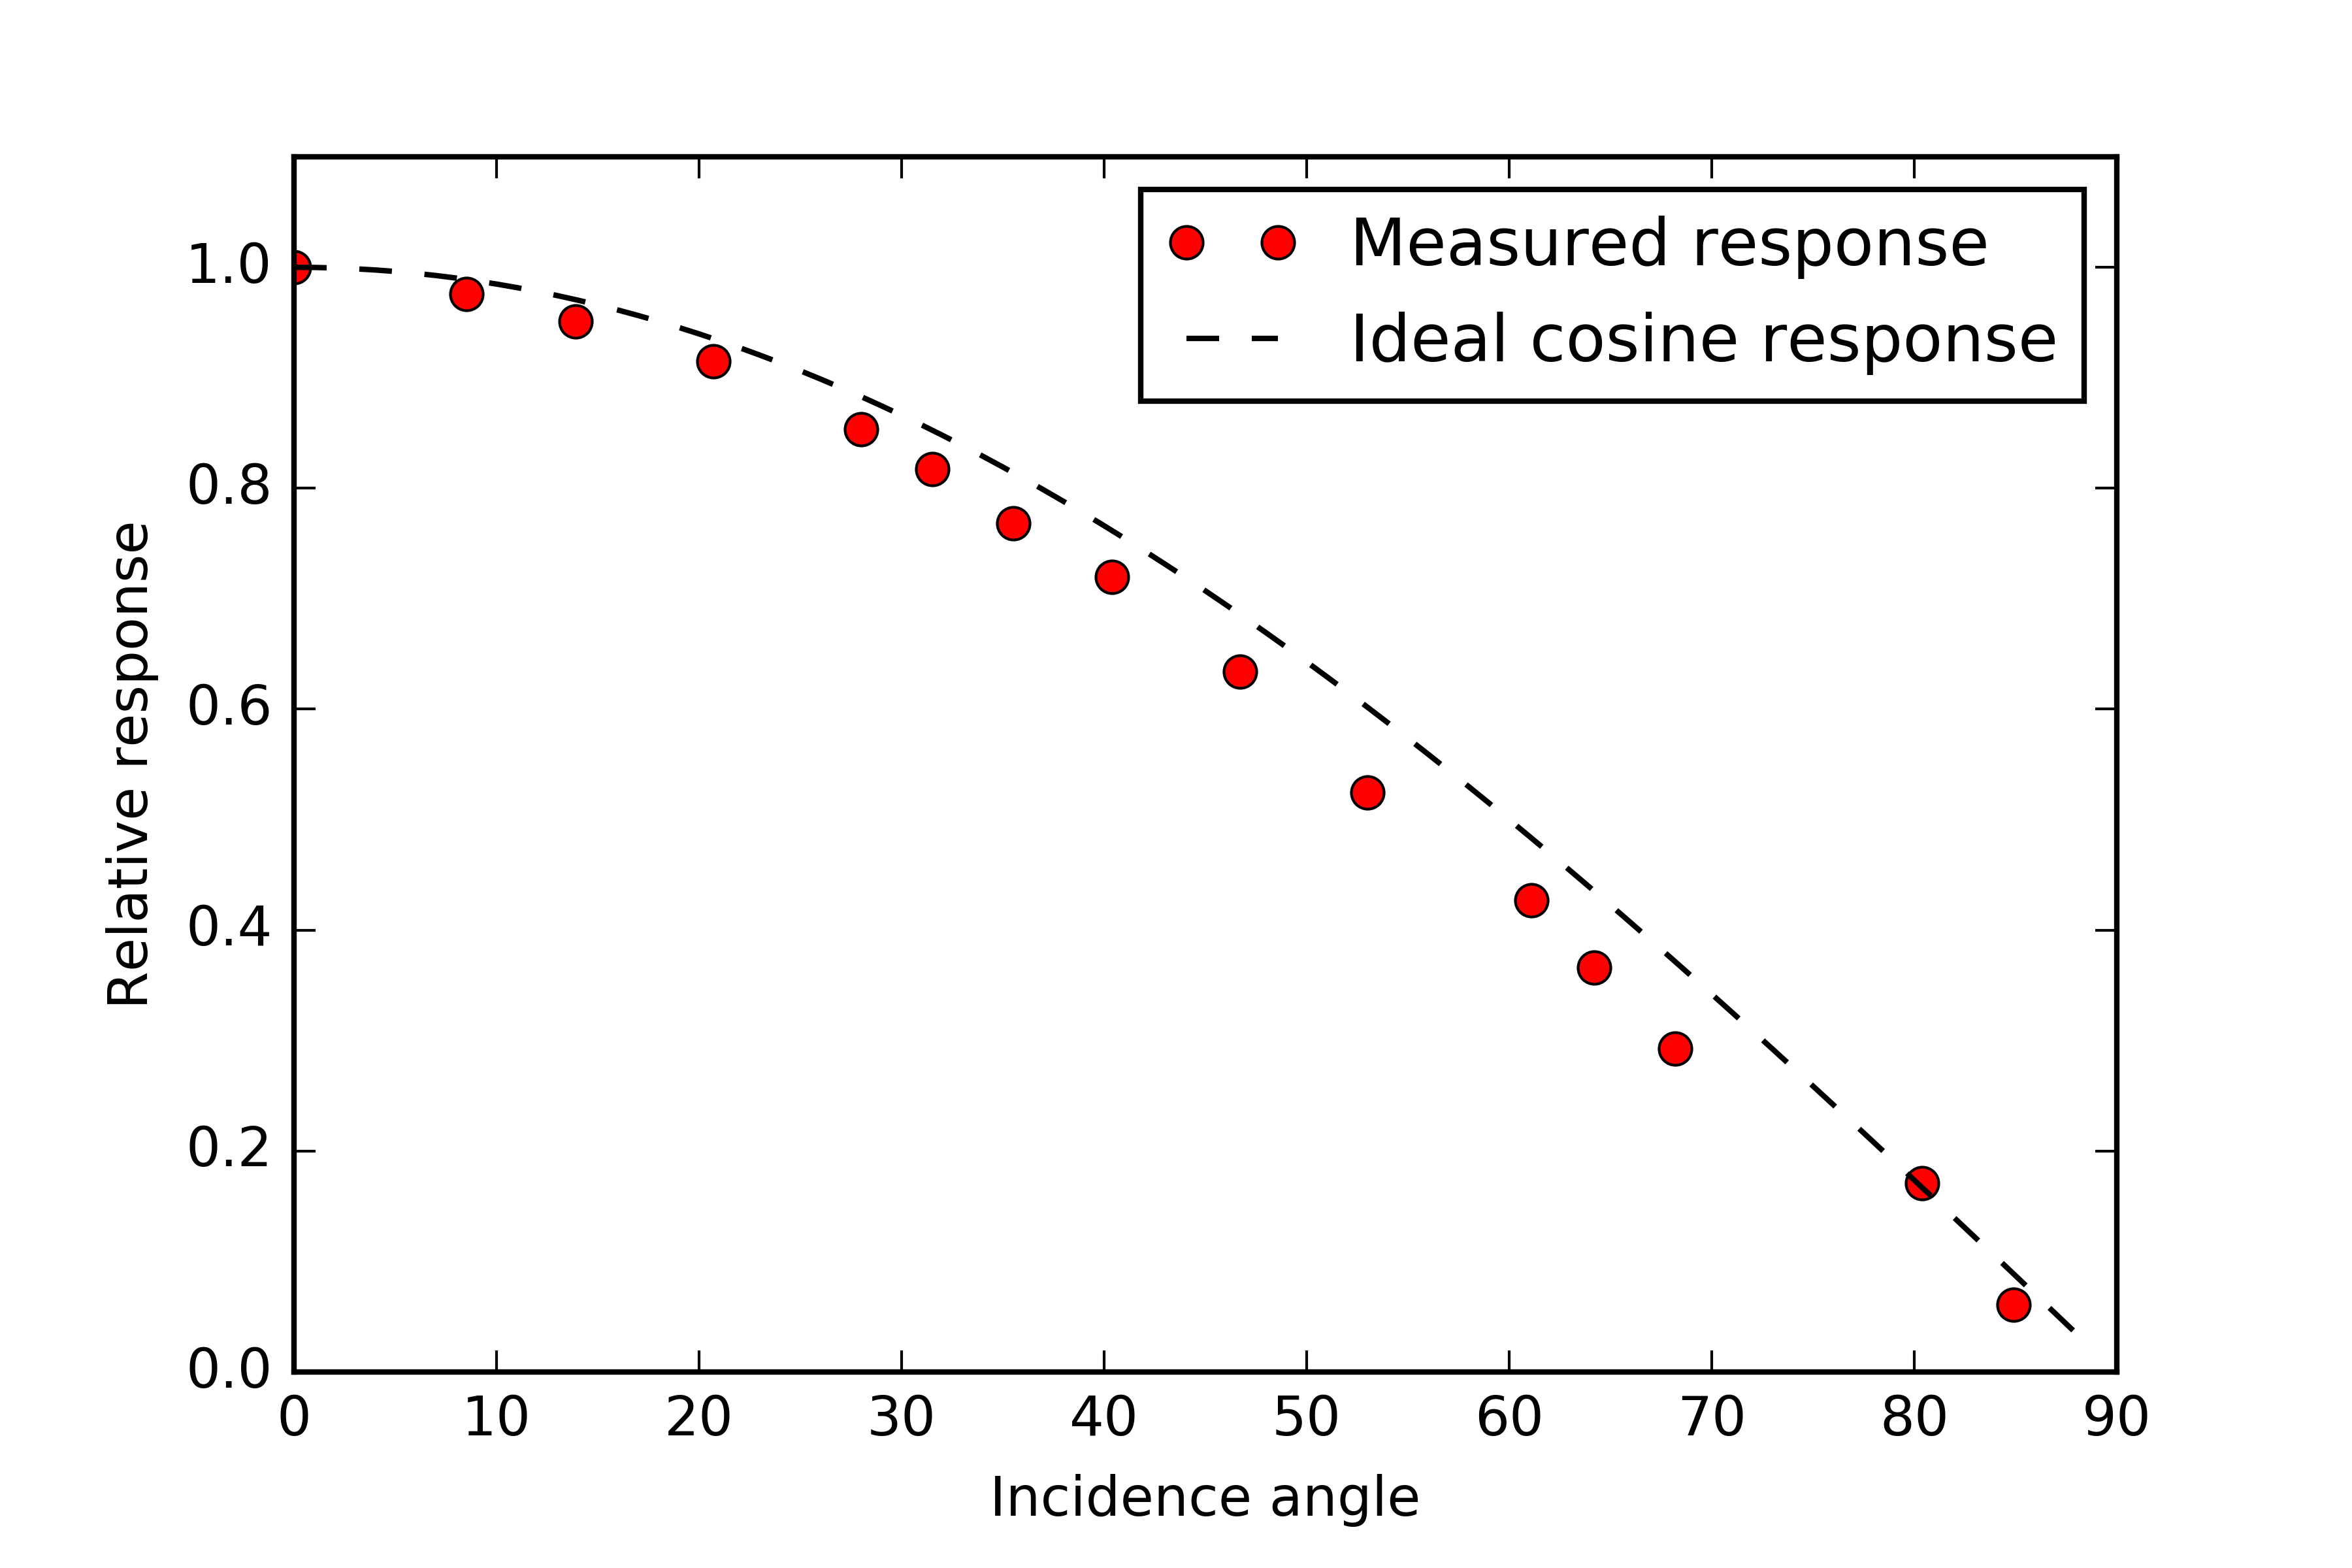
The figure below shows the measured response of the detector compared to that of an ideal cosine response. I was really happy will this outcome and don't think I can realistically do any better.
![]()
One difference to note between my design and that of commercially available sensors is that my diffuser is flush with the surface of the casing whereas normally you would see that the diffuser set a bit proud. The reason this is done is because at low incidence angles the diffusing material acts more like a specular reflector causing light to bounce off the surface rather than being transmitted through. By raising the diffuser a bit this loss is compensated for by light which enters the disc through the side wall. Sensors designed this way also have a raised rim around the diffuser to block any light parallel to the surface of the disc where the incidence angle is 90° and the irradiance on the surface should be zero (cosine(90°) = 0).
PULSE : Profiling Underwater Light SEnsor
A multi-sensor vertical water profiler to measure light availability and the processes affecting it.
 "Pure" chlorophyll extract