 Michel Kuenemann
My Powerbucket has been working for a week now and it's time to have a first look at the curves and figures.
By chance, the last week was globally very sunny, and I had enough power to fill up the stack with photon juice nearly every day.
The following chart shows the data between Monday, November 28th and Sunday, December 4th 2016.
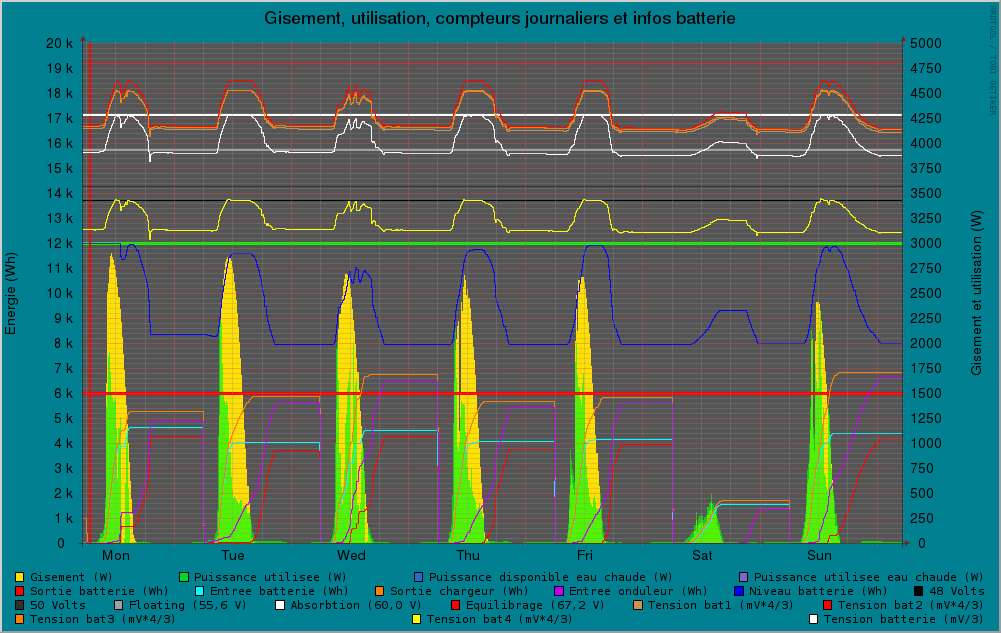
The white curve near the top shows the battery voltage. It varies between 54V (3.6 V/cell) and 60.0 V (4.0 V/cell) , which is quite good and safe for the cells.
The blue curve in the middle is the fuel gauge. It shows that the battery gains and looses 4 kWh during each cycle. This represents 4/11 = 36 % of its nominal capacity. This is also very conservative. I will probably increase the depth of discharge to at least 50 % once the new ballancing BMS is installed.
For the moment the parameters are good and I will go on running with these settings for a while.
Discussions
Become a Hackaday.io Member
Create an account to leave a comment. Already have an account? Log In.