 Jonathan Buchanan
Now that the breadboard prototype appears to be working, it's time to make a more permanent (and smaller) version. With a few minutes of googling, I found a website called EasyEDA, that allows you to design PCBs using their online tool. It was fairly intuitive to learn and, even better, it included a massive user library of part dimensions, and an automatic conductor router (in other words, it generated the hard part for me).
When considering the design, I wanted it to be small and concise. To that end, I made a few adjustments to Bindhammer's schematic. Here is my modified version.
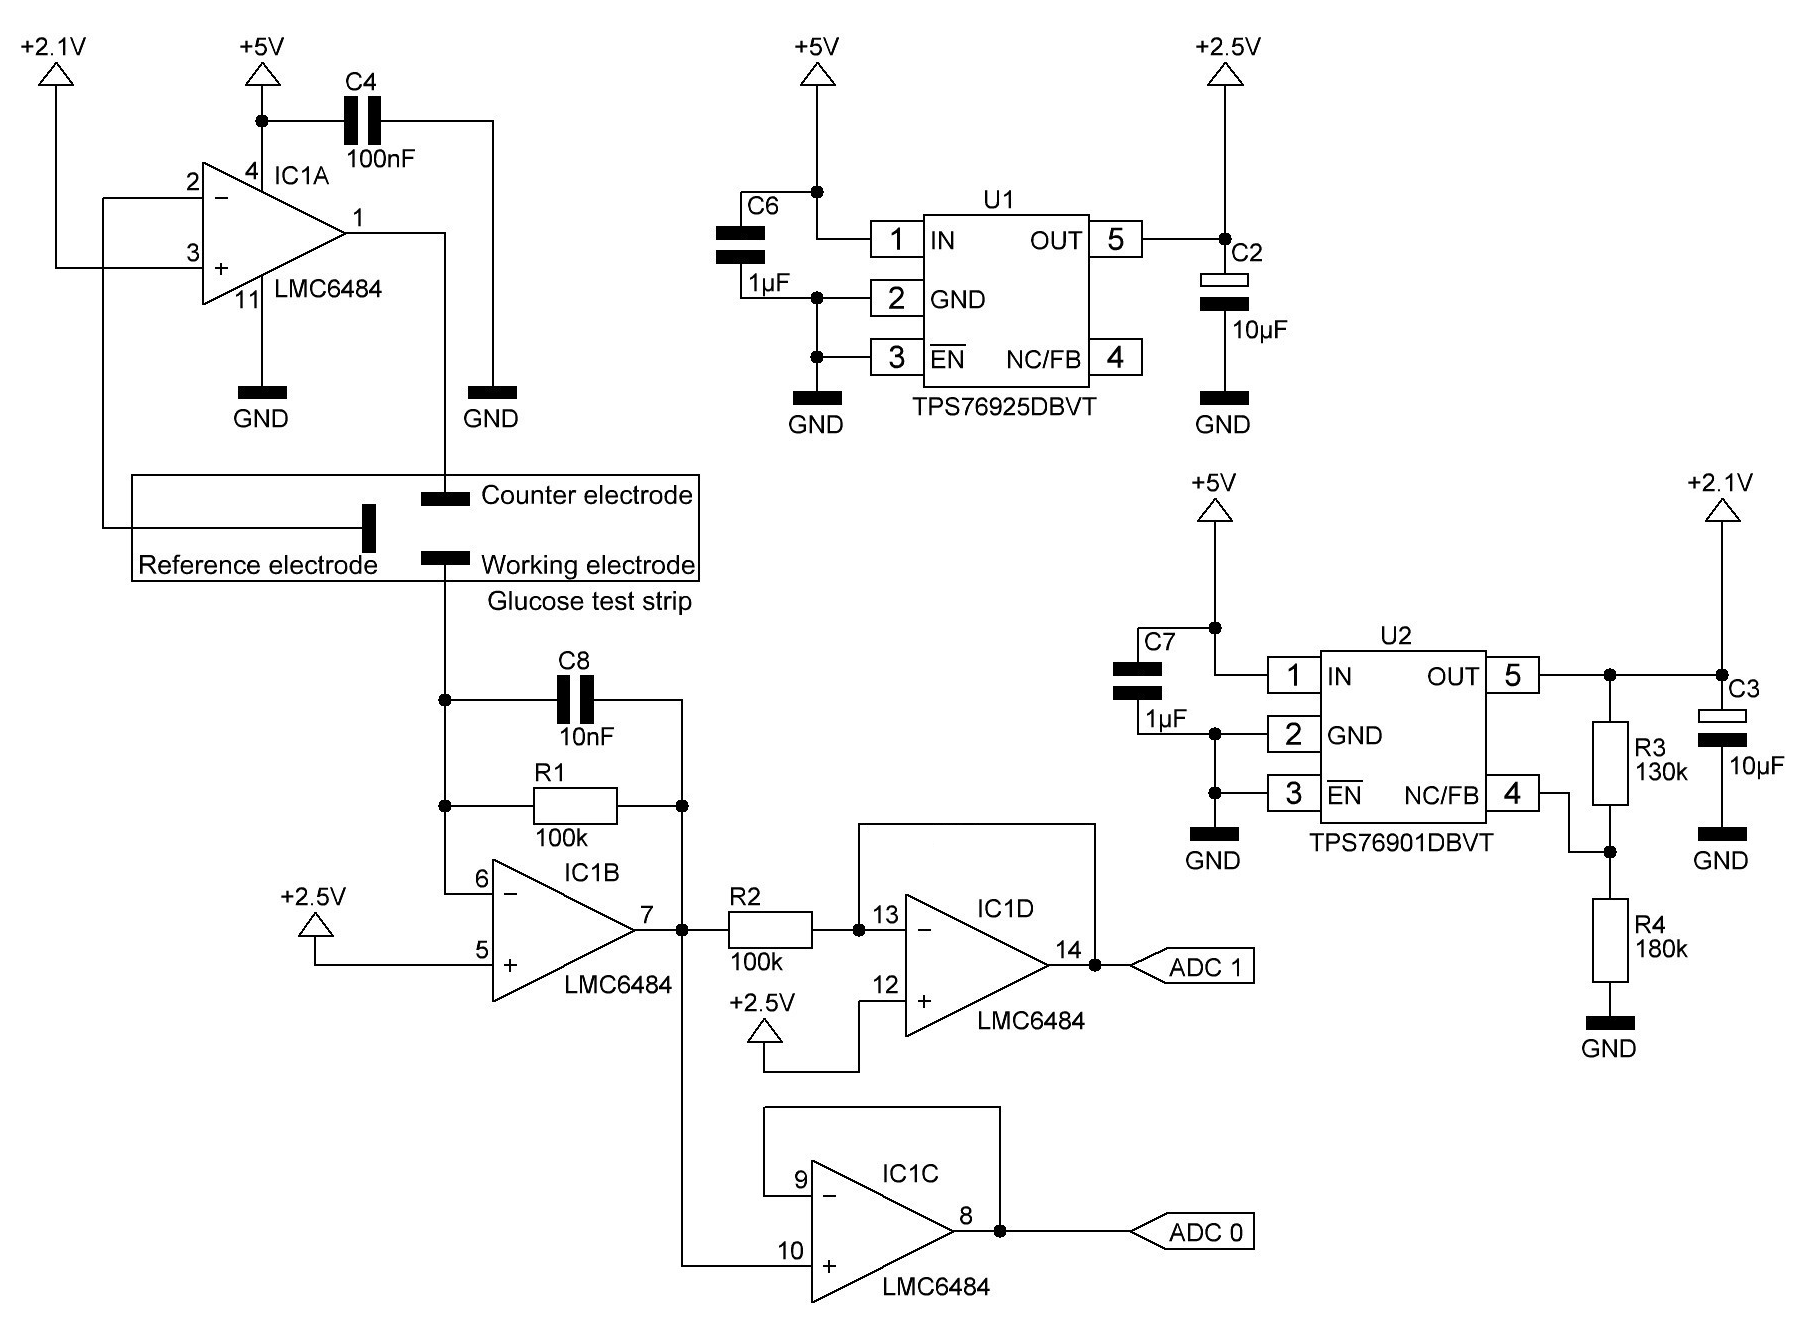
The primaries differences are the quad switch is gone and with it the op-amp integrator between pins 13 and 14 it controlled. The function of an op-amp integrator is to output a voltage proportional to the integral of the input. In a glucose meter, the graph it produces is in some circumstances more linear than the the direct op-amp output.
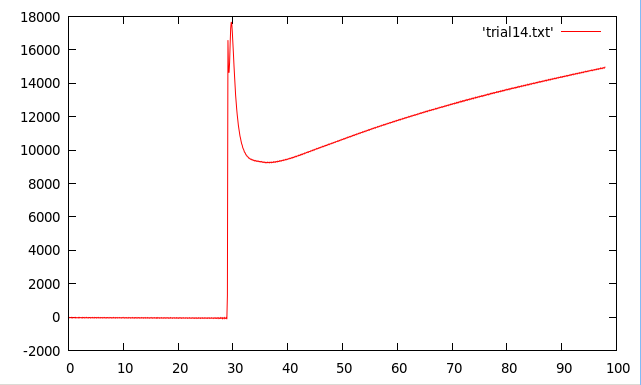
In my tests, it was not, so I took it out, along with the physically largest chip. This is the graph it made. X-axis is time, Y-axis is ADC voltage.
 |
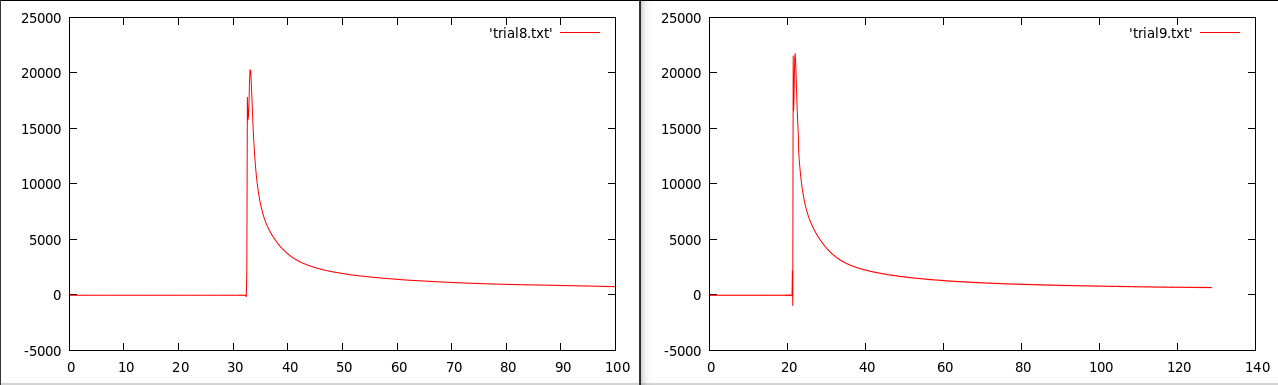 |
Top: integrator active; Bottom: no integrator
One other notable change is that capacitor 6 and 7 are no longer polarized. I believe these capacitors are to filter out AC voltage and noise, and I think they can do that when they're not polarized. I am certain, however, that non polarized capacitors are much, much smaller.
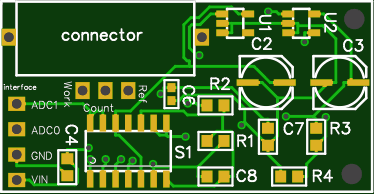
With the new design, I confidently connected up some virtual wires and told the auto router to route me some conductors.
Here is the virtual estimation of the result. Here is the gerber file.
Discussions
Become a Hackaday.io Member
Create an account to leave a comment. Already have an account? Log In.
Hi,
Two things are wrong in my opinion. You may not understand the complete schematic.
First, you can cancel IC1D. Without a cap it isn't an op am integrator anymore. And to work with an op am integrator, you need to short the cap before the measurement starts. The CD 4066 just short-circuit the cap before measurement starts.
Second, I did not measure ADC voltage (y-axis) versus time (x-axis). I measured mg/dL glucose (y-axis) versus transimpedance amp output voltage (x-axis) after 5 seconds blood/test solution was applied to the test strip. THIS relation is nearly linear, see here:
https://hackaday.io/project/11719-open-source-arduino-blood-glucose-meter-shield/log/42449-measurement-series
Are you sure? yes | no
Thanks for the feedback,
I don't claim to know much about
electronics, but by removing the switch and capacitor and shorting pins 13 and 14 on the opamp, I meant to be removing the integrator entirely (not entirely sure that was correct). The reason I wanted to do that was because in both your and my tests the results seemed to be more linear without it and I wanted to gain the extra space.
As for the graph axis, I wasn't expecting either way to be linear with ADC voltage versus time. The testing post immediately before this one is where I posted a graph of ADC voltage versus mg/dL (bottom left of this picture).
Are you sure? yes | no