 fl@C@
fl@C@
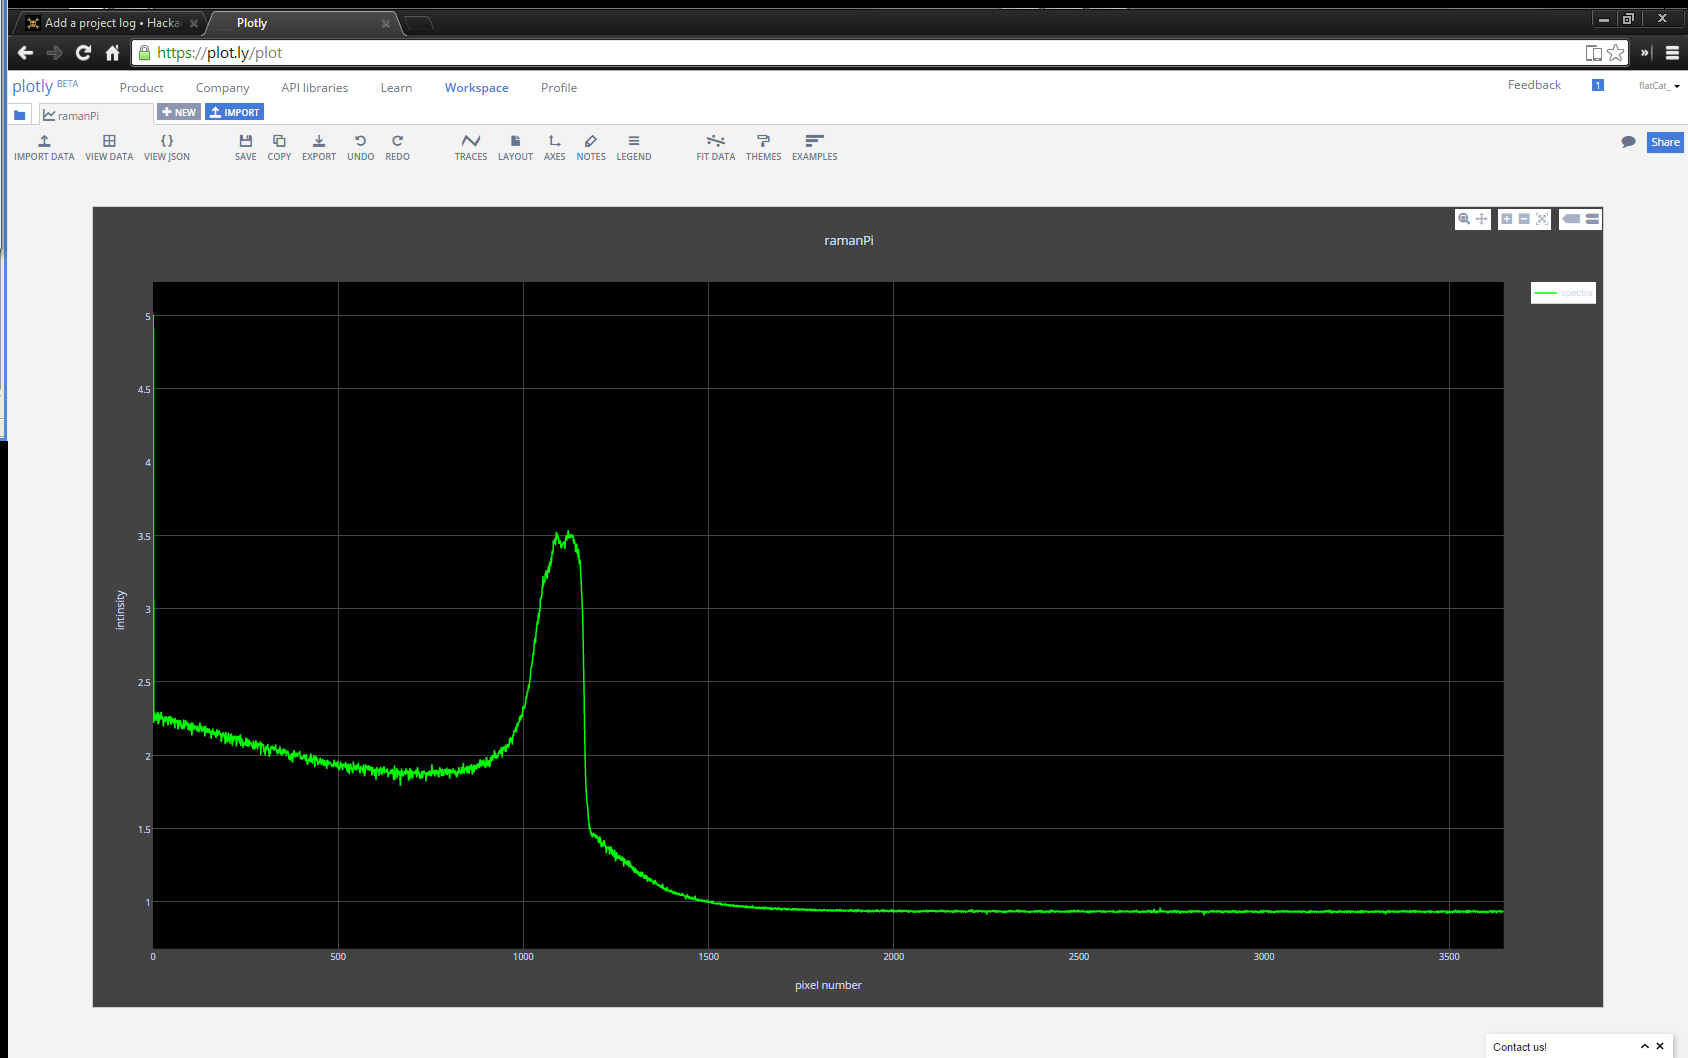
Well, here it is... I have been working on the software a bit.. Right now I am focusing on the main parts and will branch out.. For now, I have the raman system aquiring spectra and displaying it in a window on the remote terminal/laptop/workstation/whatever you decide to use...and it posts the same data to plot.ly.... Plot.ly in case you're not familiar is pretty cool.. It allows you to push data and create nice graphs and stuff from your devices....and share them. Here's a link to my first success getting ramanPi to post data... HERE ..
Now, here's why this is so cool...and essential to the operation.. First and foremost, this allows anyone to view the output......from anywhere..on ANY device that has a web browser....AND they can collaborate.... That means for instance......You have a ramanPi, no computer...but you have a cell phone with a browser..with your sample in the cuvette in the ramanPi, use the touch panel to start an analysis.....(you could telnet into it and start it that way, so I might actually add some process in here that allows other devices to do this as well) ramanPi hits the sample with the laser, takes its spectra and so on.. when it's done... it pumps the data straight to plot.ly and notifies you on twitter along with your friends and colleagues... You take a look and there it is... It'll even show the spectral databases spectra overlayed as a 2nd trace.. to further compare!
Ok..Here's another example.. You have your ramanPi, a laptop and you're working with a friend across country....who needs the data.. You put your sample in, and in a short time the spectra is available to them and anyone else who you want..
I'm very excited about this portion.. it really allows a LOT of collaboration with ramanPi... Want that distributed spectral internet database? Here's a start.. I'll be working on other sharing methods soon.. Next step, pulling spectral data from the internet databases to allow for matching and identification...then overlaying that on the output here in plot.ly and on your workstation...!
Here's a plot from the website...
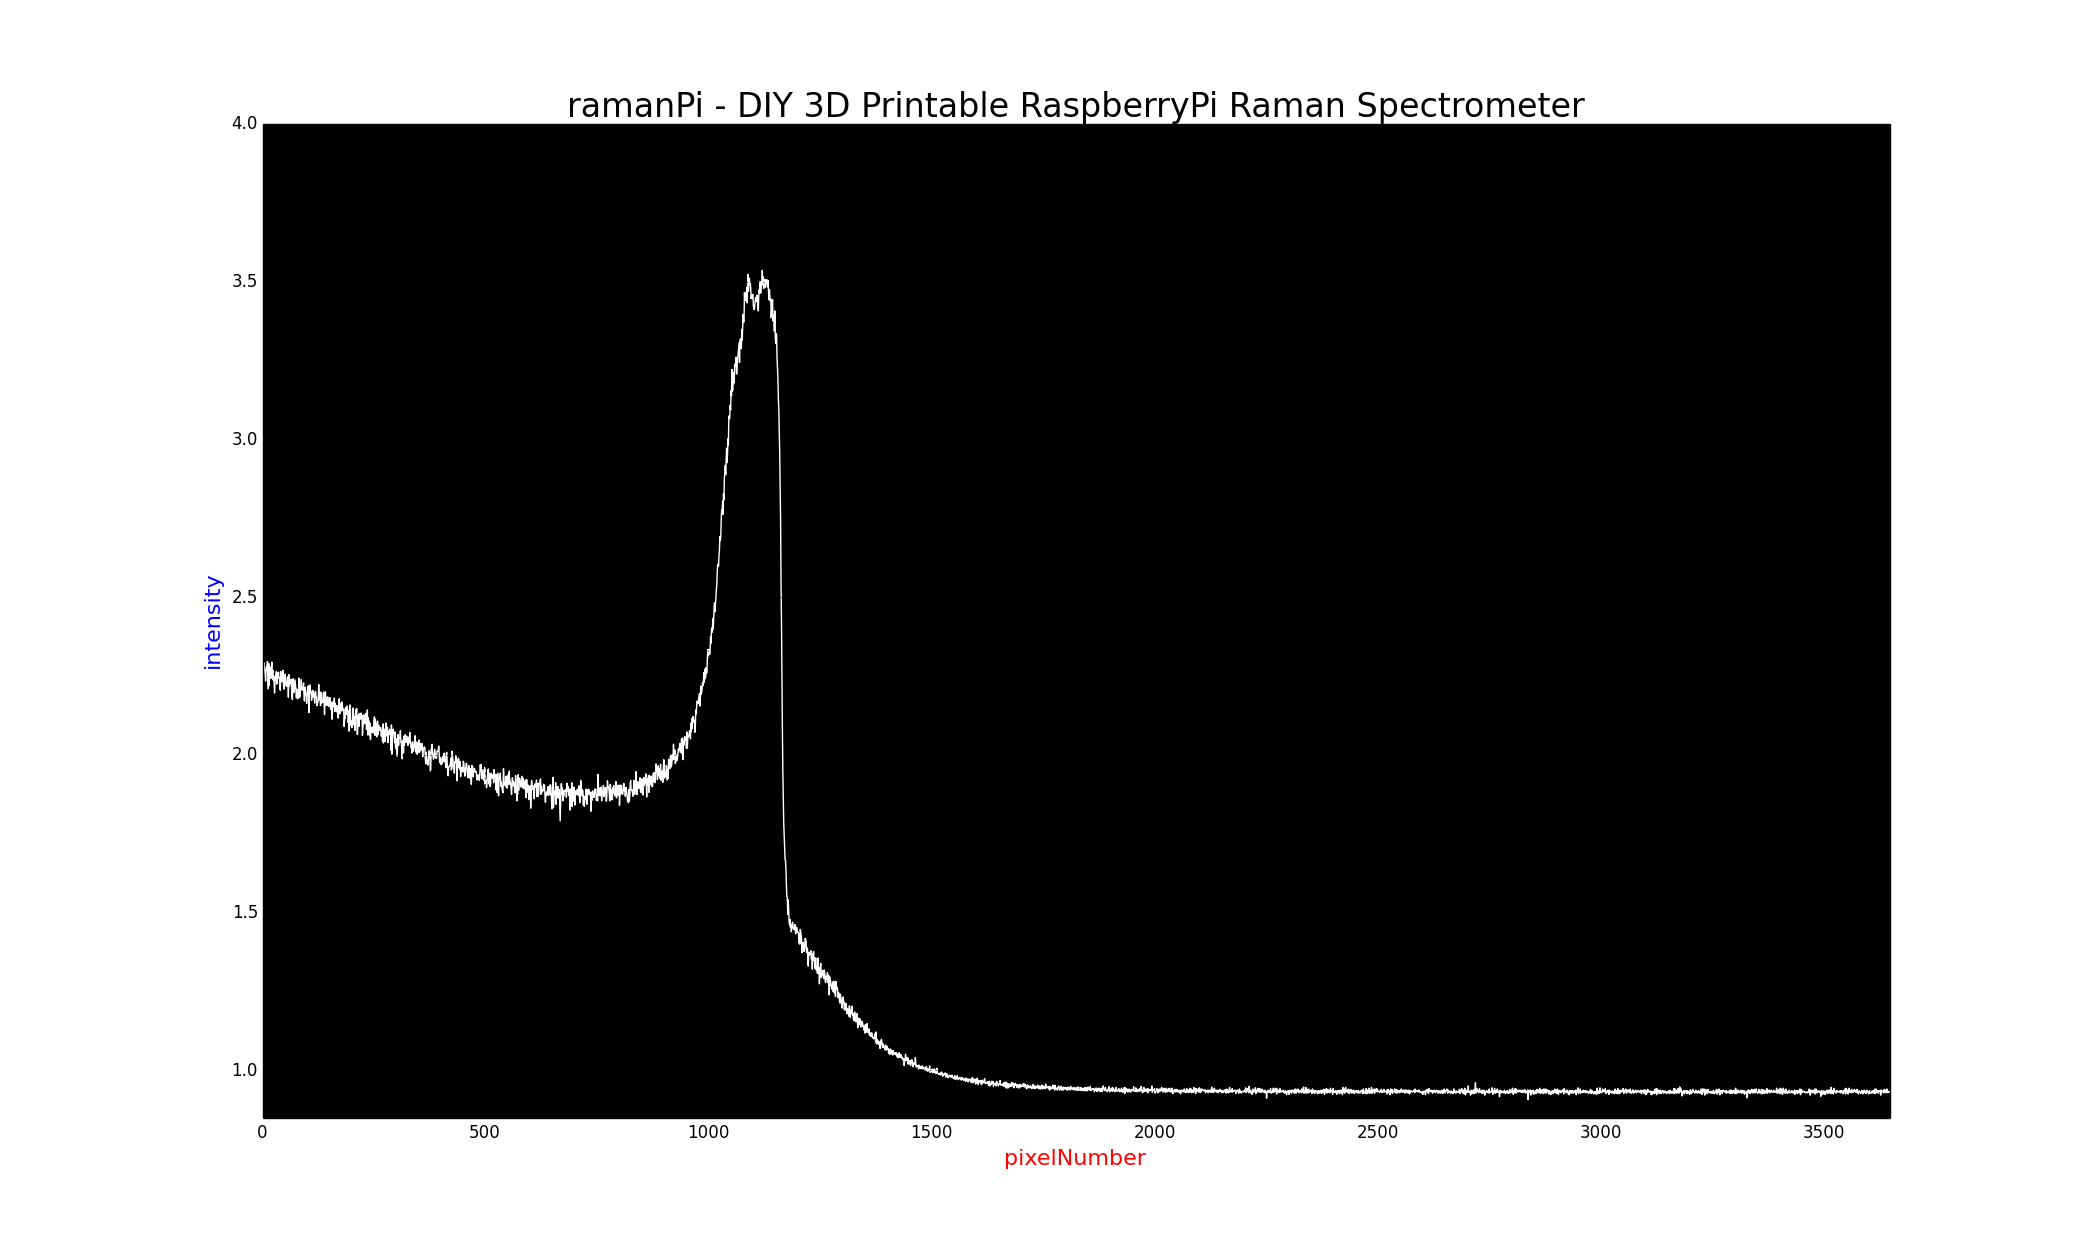
Here's a plot from the workstation of the same spectra... (the scale is set different in case your're wondering why the workstation is stronger)
As always, I would love to hear anything anyone has to say about this..!

Discussions
Become a Hackaday.io Member
Create an account to leave a comment. Already have an account? Log In.
Are you sure? yes | no
Are you sure? yes | no
Are you sure? yes | no
Are you sure? yes | no