Kris Winer
-
"Corrected" Data Sheet and Better Results
09/26/2018 at 22:53 • 1 comment09/26/2018
First some housekeeping. I have a supply of these Compact AS7265X Spectrometers for sale now at Tindie and I expect to keep these in stock as long as there is demand. Thanks to all for the support!
While tidying up the Tindie description I noticed that the data sheet link was 404 and when I found the most current datasheet dated July 9, 2018 I discovered that the order of the data in the registers was given differently from what I had believed. That is, the preliminary datasheet I received from AMS in excel spreadsheet format had some of the frequencies transposed and/or swapped. This is all part of rolling out a new sensor suite and it is quite possible I simply misinterpreted the spreadsheet and got it wrong. The error amounts to the following:
The previous version of data slots 1 - 18:
uint16_t freq[18] = {610, 680, 730, 760, 810, 860, 705, 645, 560, 585, 900, 940, 485, 460, 410, 435, 510, 535};
The new version of data slots 1 - 18:
uint16_t freq[18] = {610, 680, 730, 760, 810, 860, 560, 585, 645, 705, 900, 940, 410, 435, 460, 485, 510, 535};
Quite a bit different, eight (in bold) of eighteen channels were assigned the wrong frequency! This helps explain some of the mysterious results I was getting before, where the spectrometer seemed to be having trouble detecting a simple copper edge.
So, let's try that again with the correct(ed) frequency bins.
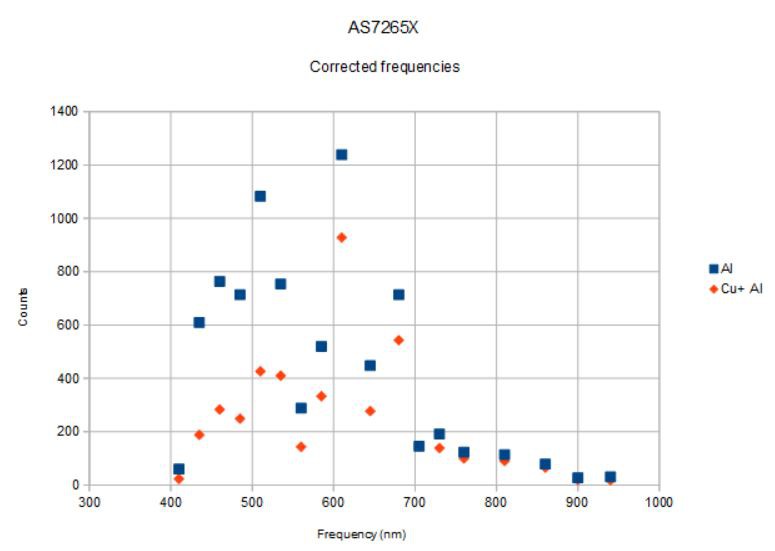
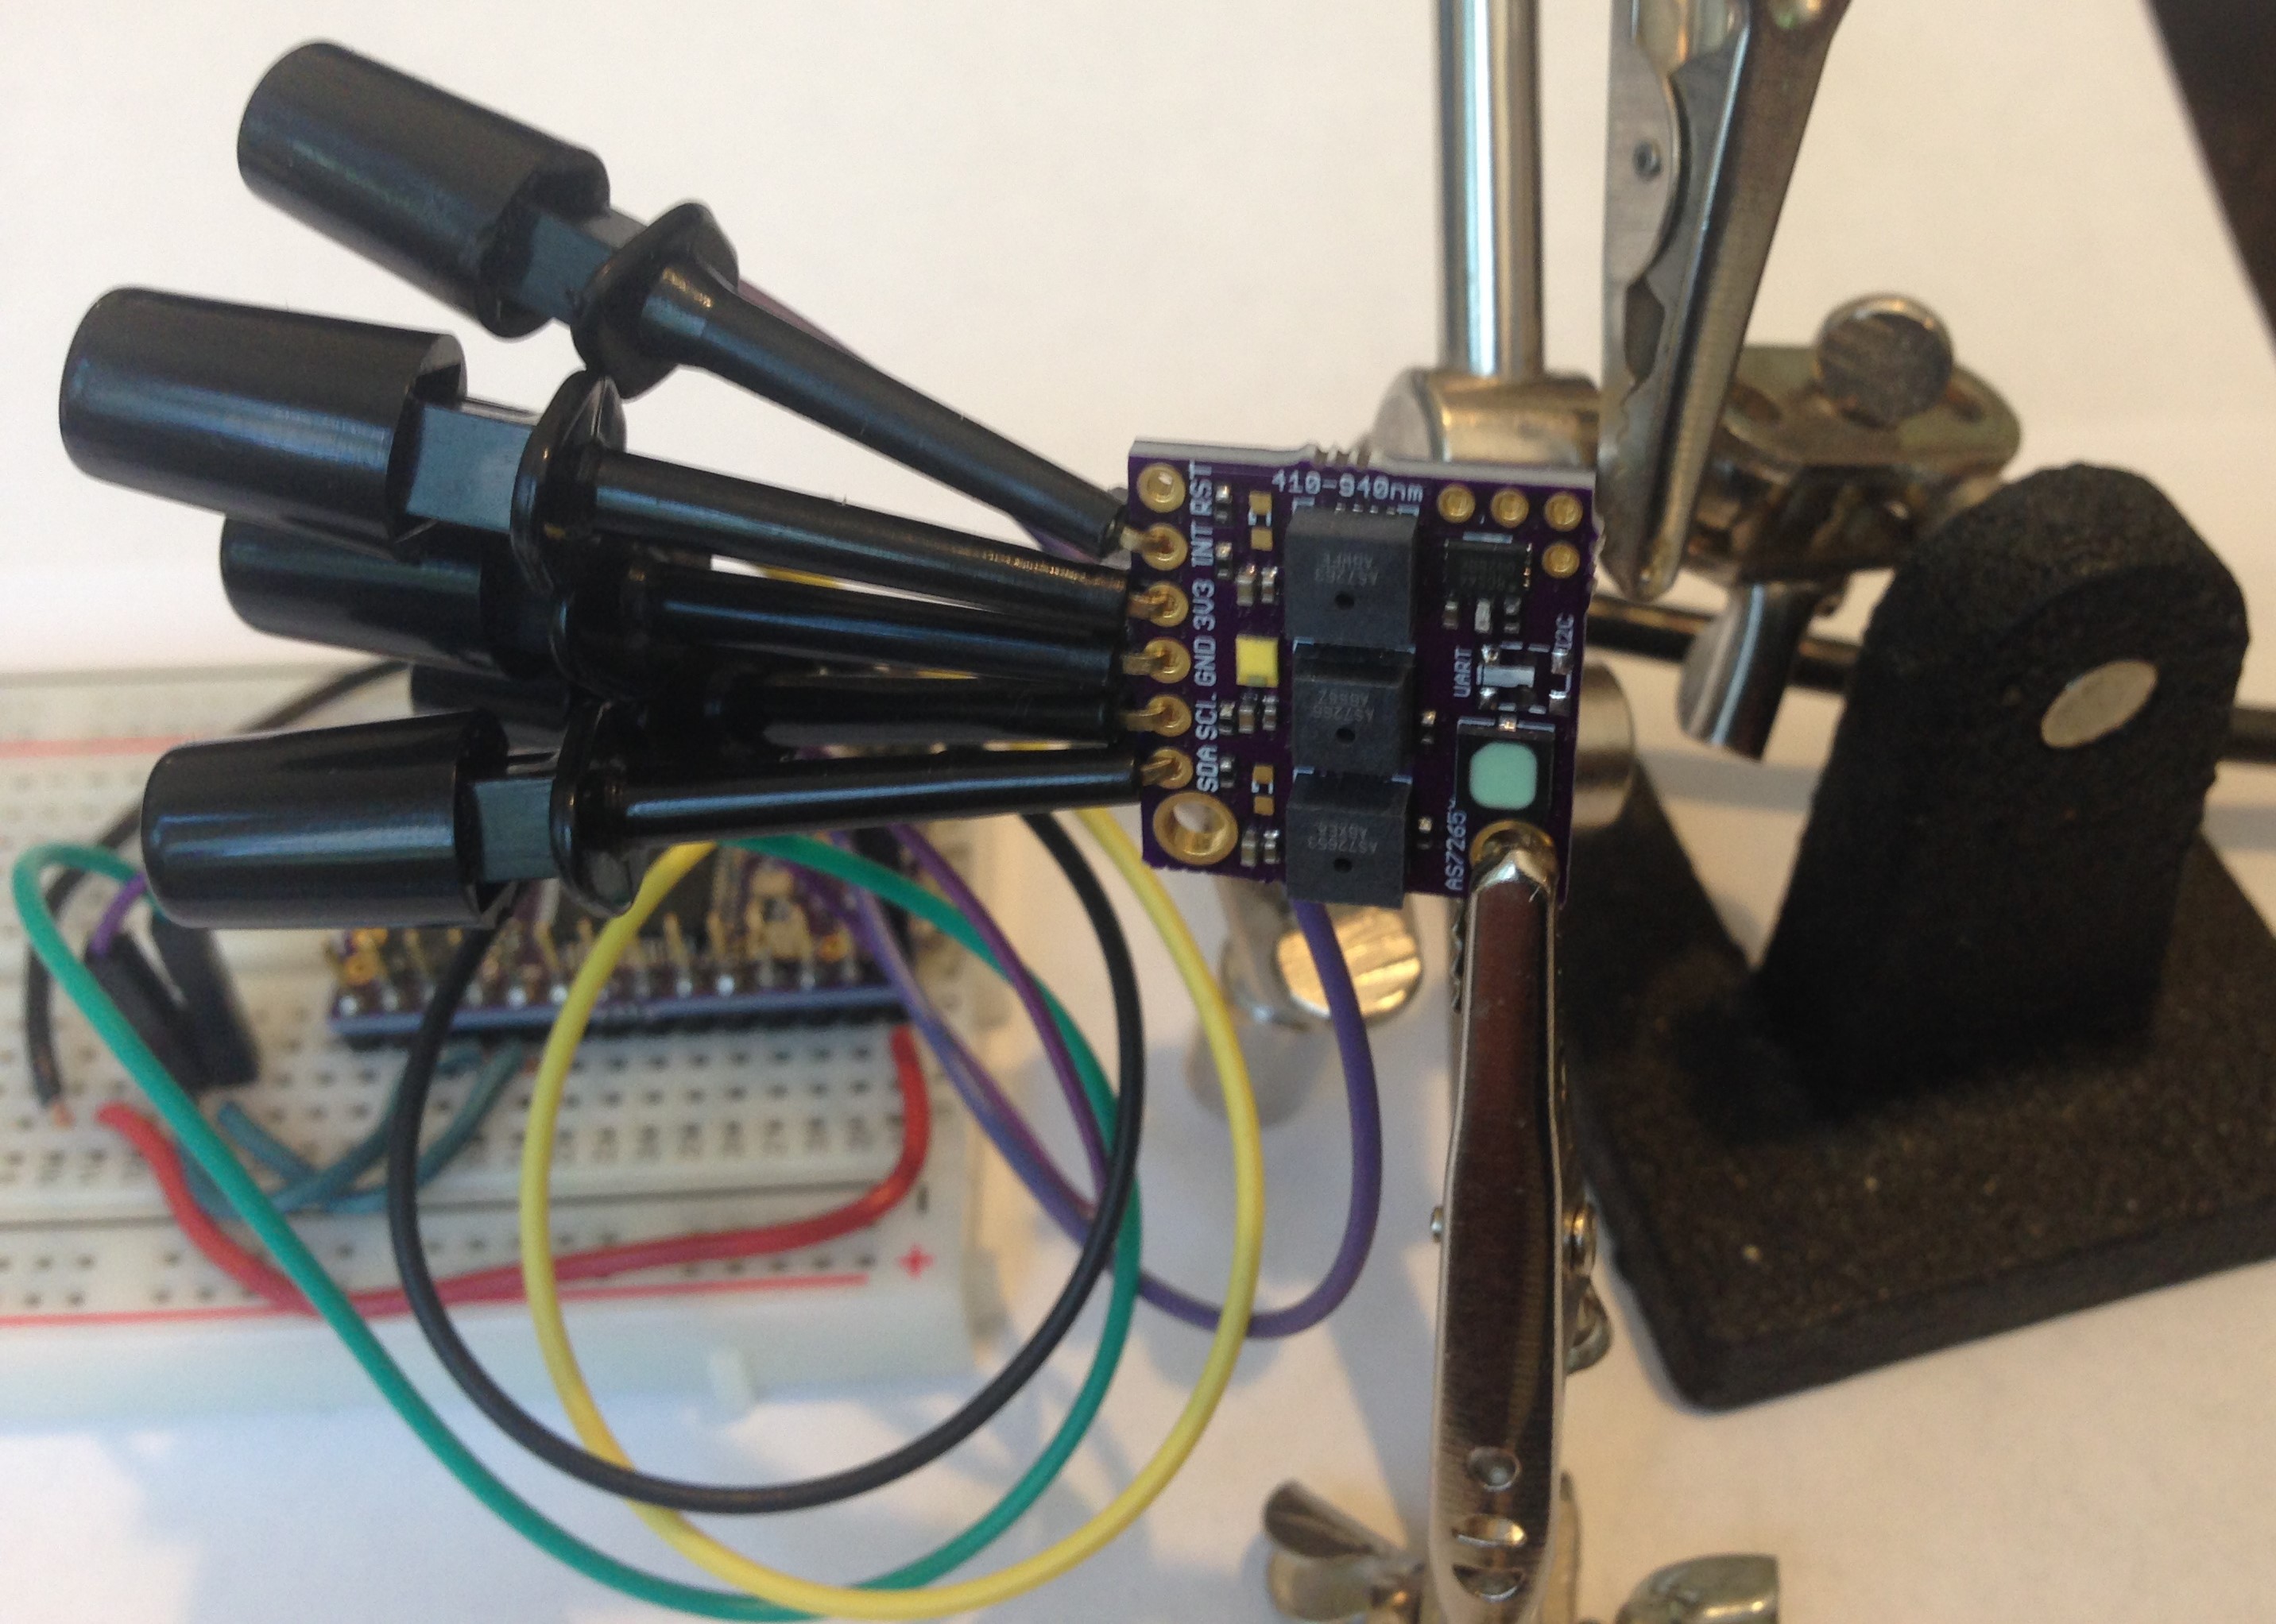
Here are the spectra from aluminum foil and with the same 0.999 copper coin on top of the aluminum foil under the spectrometer and both illuminated with the 5700 K CRI 90 white led at 50 mA, at 16 x gain, and at 100 ms integration time. The spectra were averaged over about 30 seconds and then captured to a spreadsheet. The spectrometer was held by a "third-hand" pointed down with the targets on the table under the spectrometer. I made an effort not to disturb the device geometry between the two runs, but otherwise I took no great pains in order to simulate what one might expect from more or less casual use.
This is what I measured:
![]()
You can see that there is a fair amount of variation from channel to channel (for example, 585 nm to 610 nm). I don't think this is all due to the variation in the reflected light but rather due also to the variation of the sensitivity of the individual channels. This means the spectra measured are really only meaningful when compared to a reference. In this case, aluminum (even aluminum foil) is a pretty good reflector so makes an adequate standard for this demonstration. But teflon is supposed to be even better for reflectometry since it reflects the same at nearly all visible wavelengths.
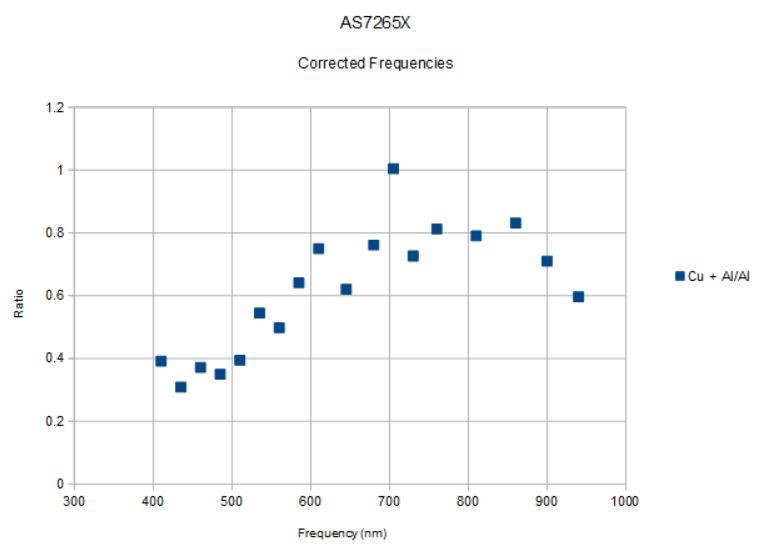
Taking the ratio of the Cu + Al spectrum to the Al spectrum I get the following:
![]()
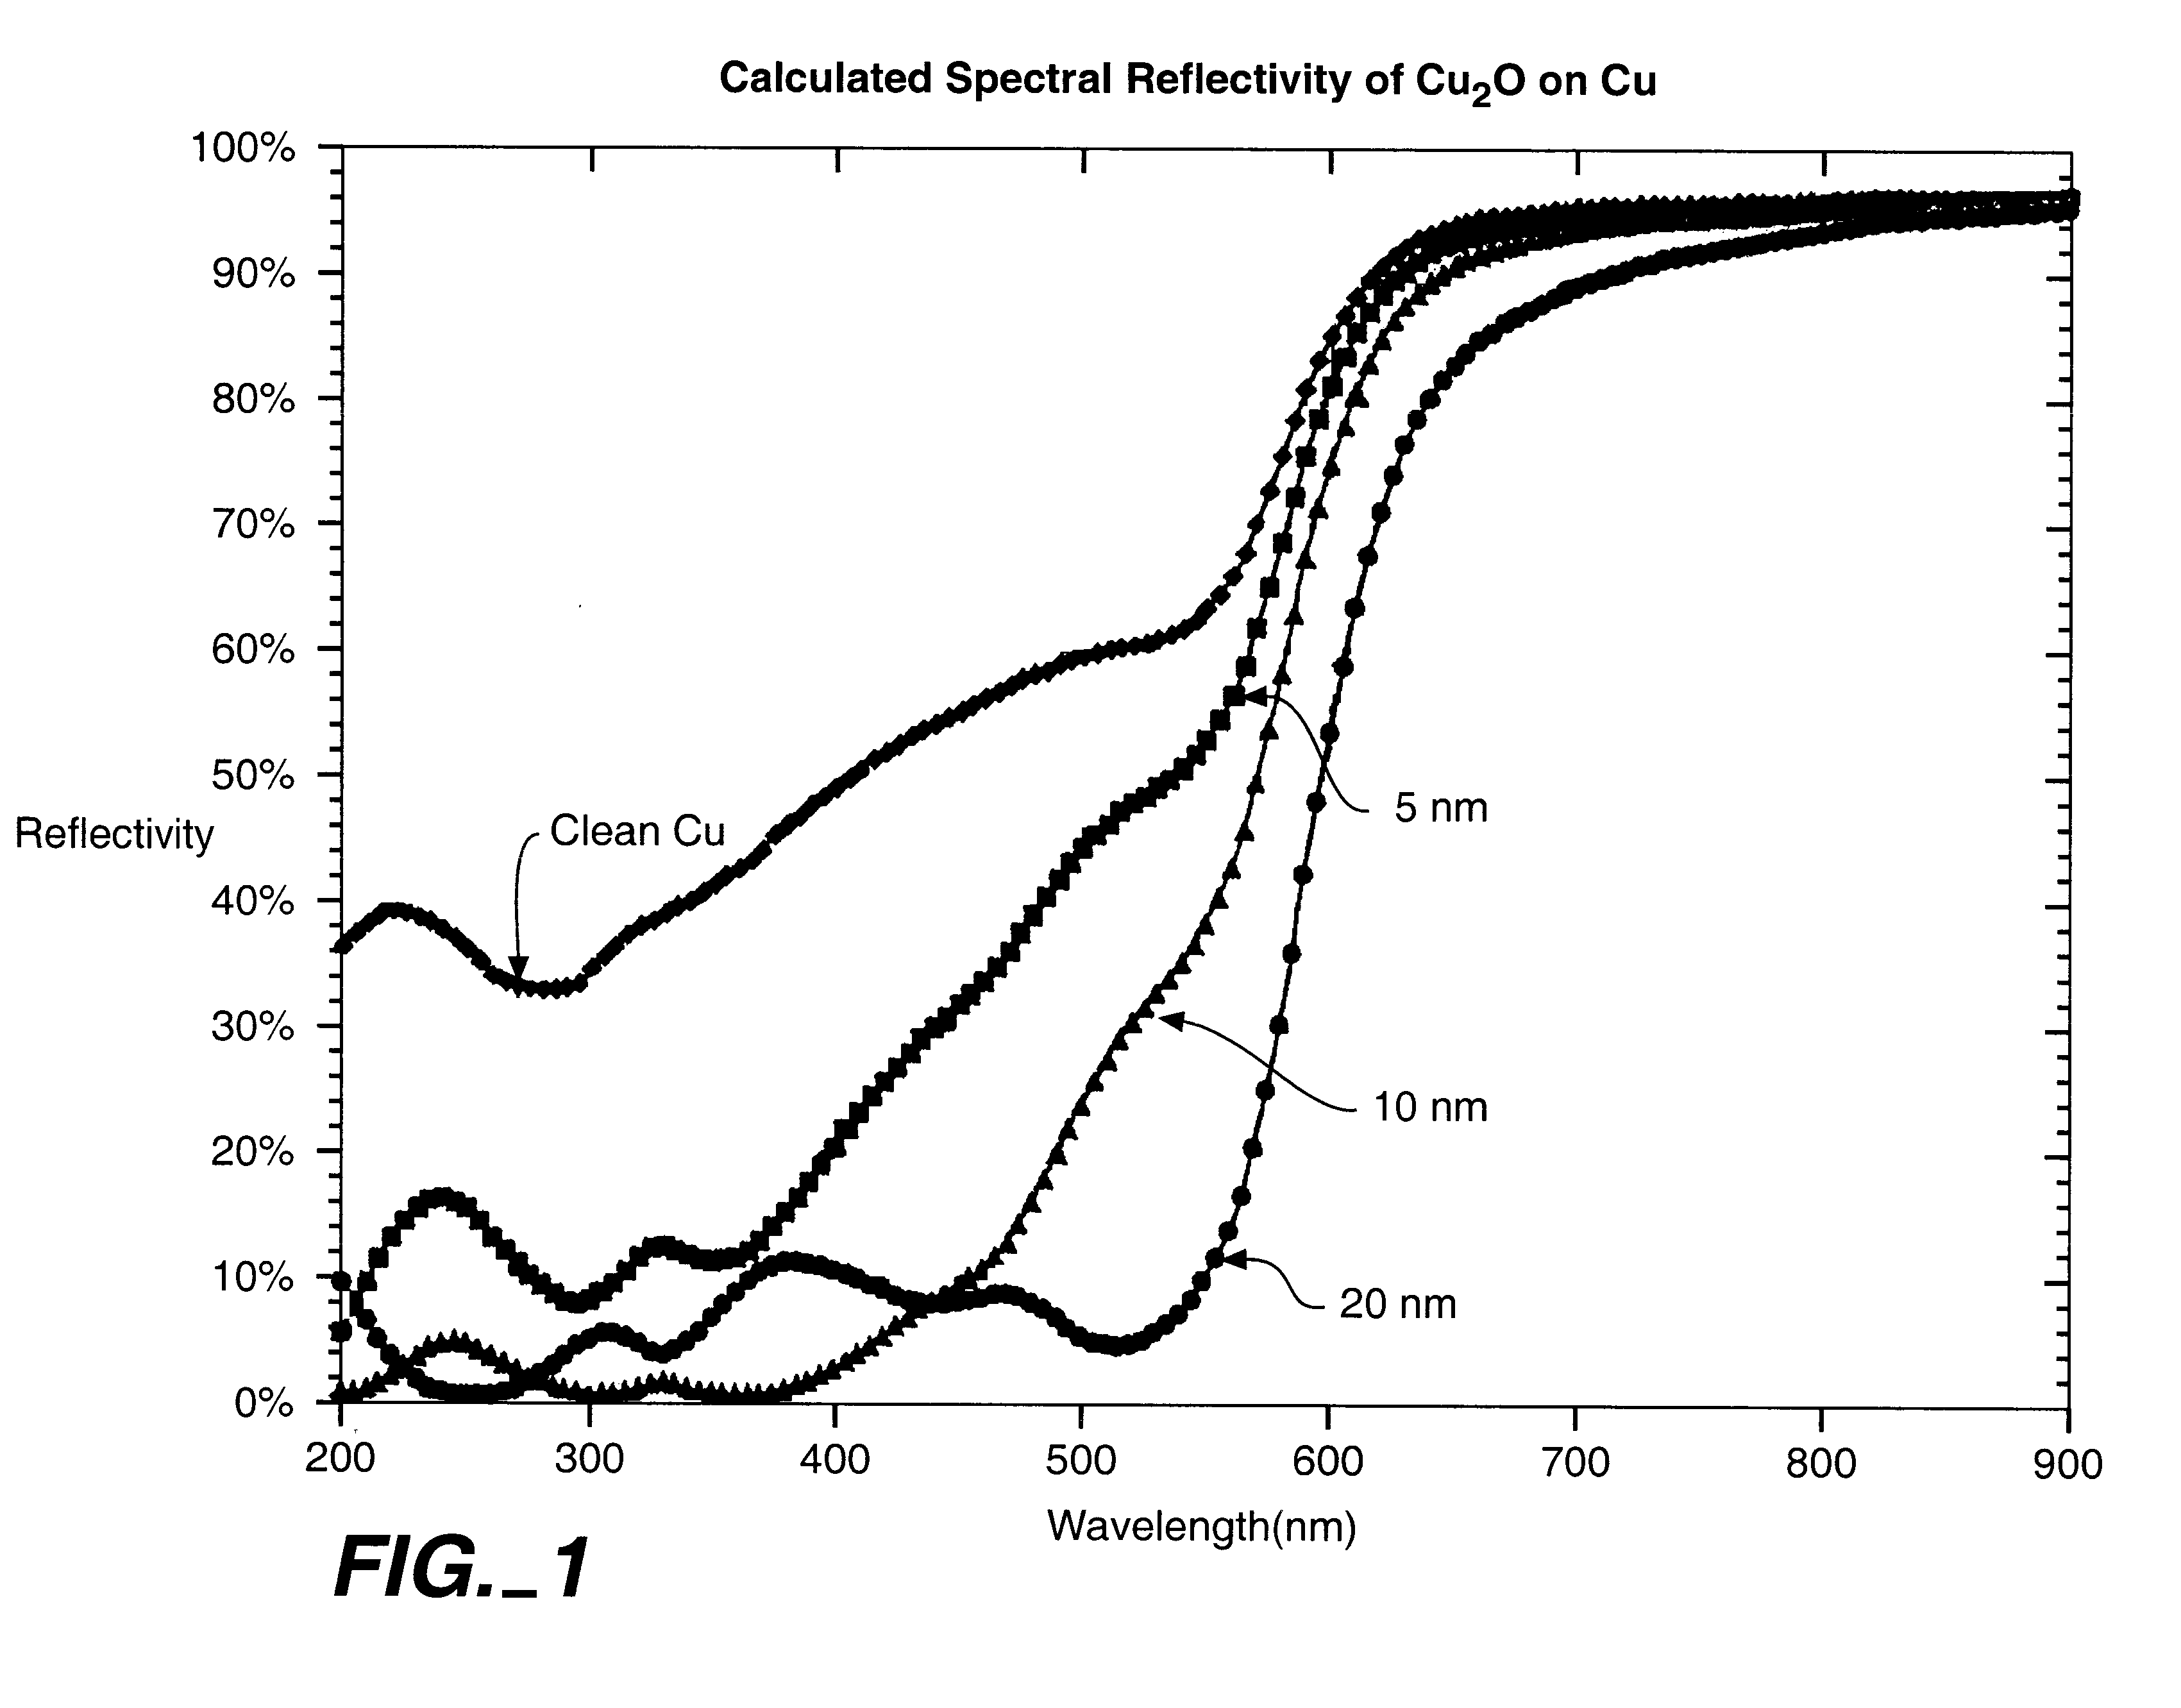
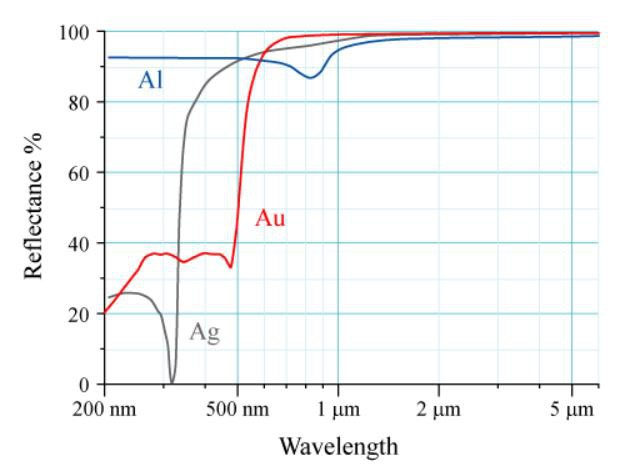
Compare to what we should expect:![]()
and it looks recognizable now. There is low reflectivity below the edge (400 - 500 nm), a 2x rise over ~100 nm that represents the absorption edge, and a more or less constant or gently rising plateau above the edge. There is still a bit of jitter, likely meaning we need to average the spectra further and/or increase the led current from 50 mA to maybe 100 mA, etc. But the results are no longer unintelligible.
The spectrometer is behaving now as I expect it should and it is time to revisit some of the older experiments to see if we can distinguish silver, gold, and copper metal from each other (material identification) and see what fruit looks like at different stages of ripeness, etc.
I am hoping the dozen or so people who have purchased the spectrometers from Tindie will also report their results. I would like to see a "spectrum" of successful use cases for the AS7265X. Pardon the pun...
Let the fun begin! -
Spectrometer available at Tindie...
09/13/2018 at 02:00 • 0 comments09/12/2018
I was able to put together six spectrometers for sale at Tindie before I ran out of AS72653 ICs, which have been hard to come by. Arrow Electronics finally got some supply today and I ordered 100 of each of the AS7265X (X = 1, 2, 3) 6-channel spectrometers, so Tindie sales should begin again before the end of the month.
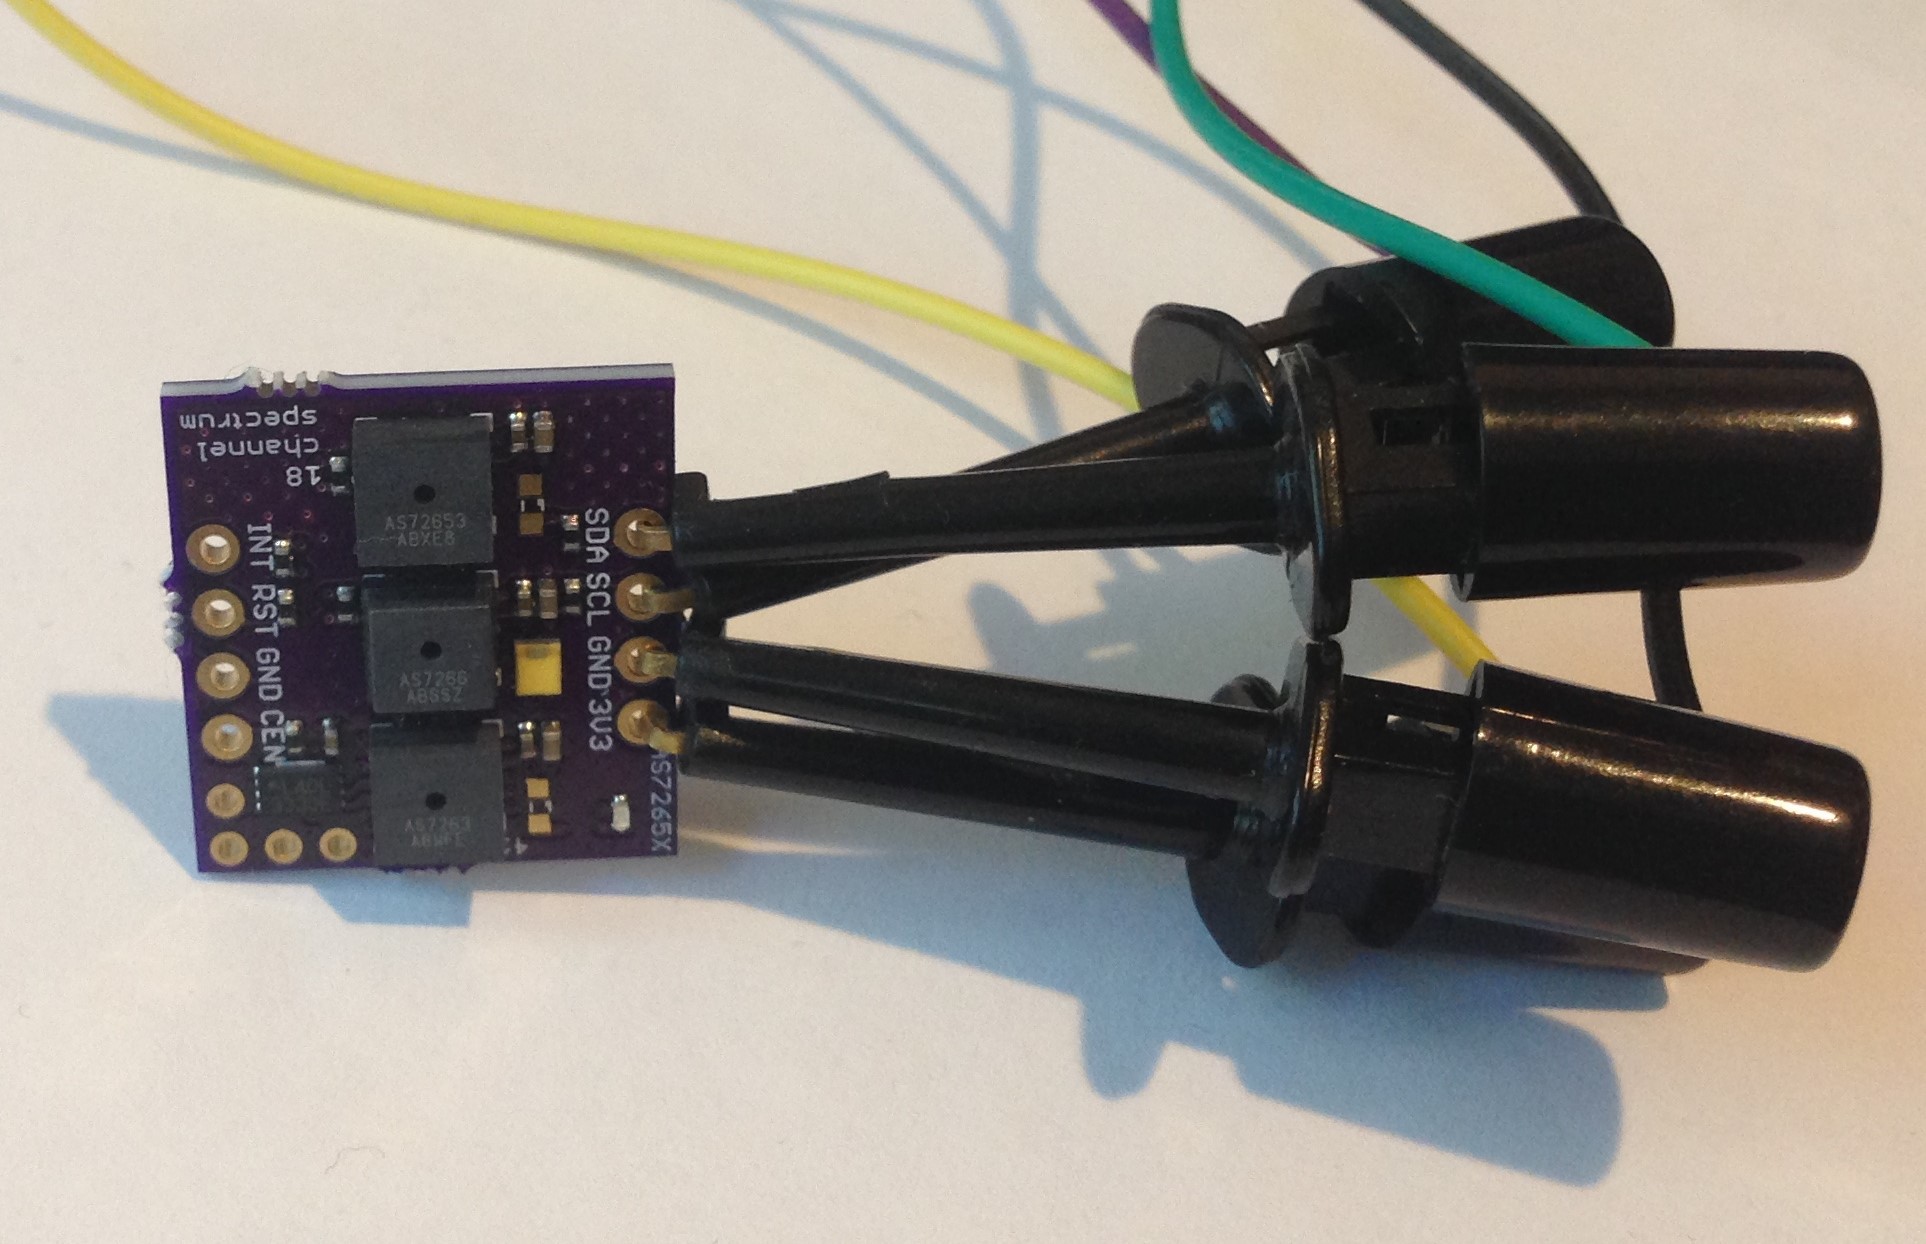
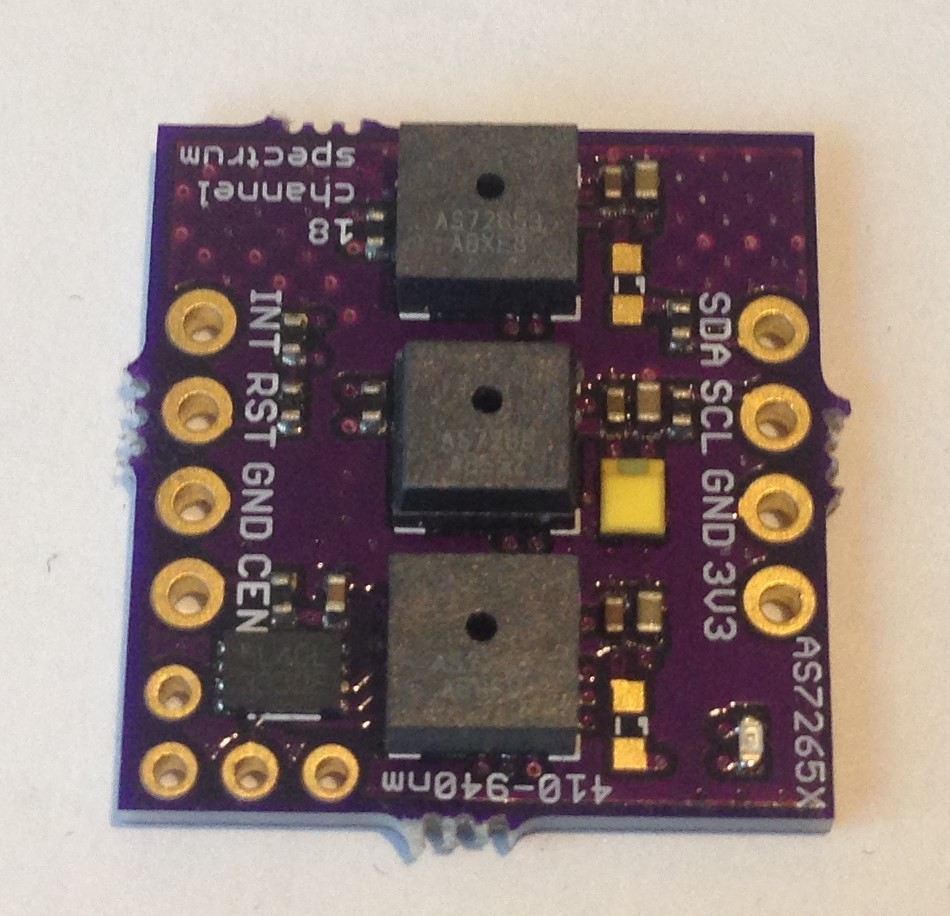
I think I will discontinue the all-in-a-row version of the board and start producing (and continue testing) the latest design which is smaller, a little simpler to assemble, and arranges the spectrometer ICs in the same kind of tri-foil pattern used by AMS in their evaluation board; this just makes the most sense to me since then each of the three is treated the same, has the same optical path from the target object, sees the same illumination from the white led, etc.
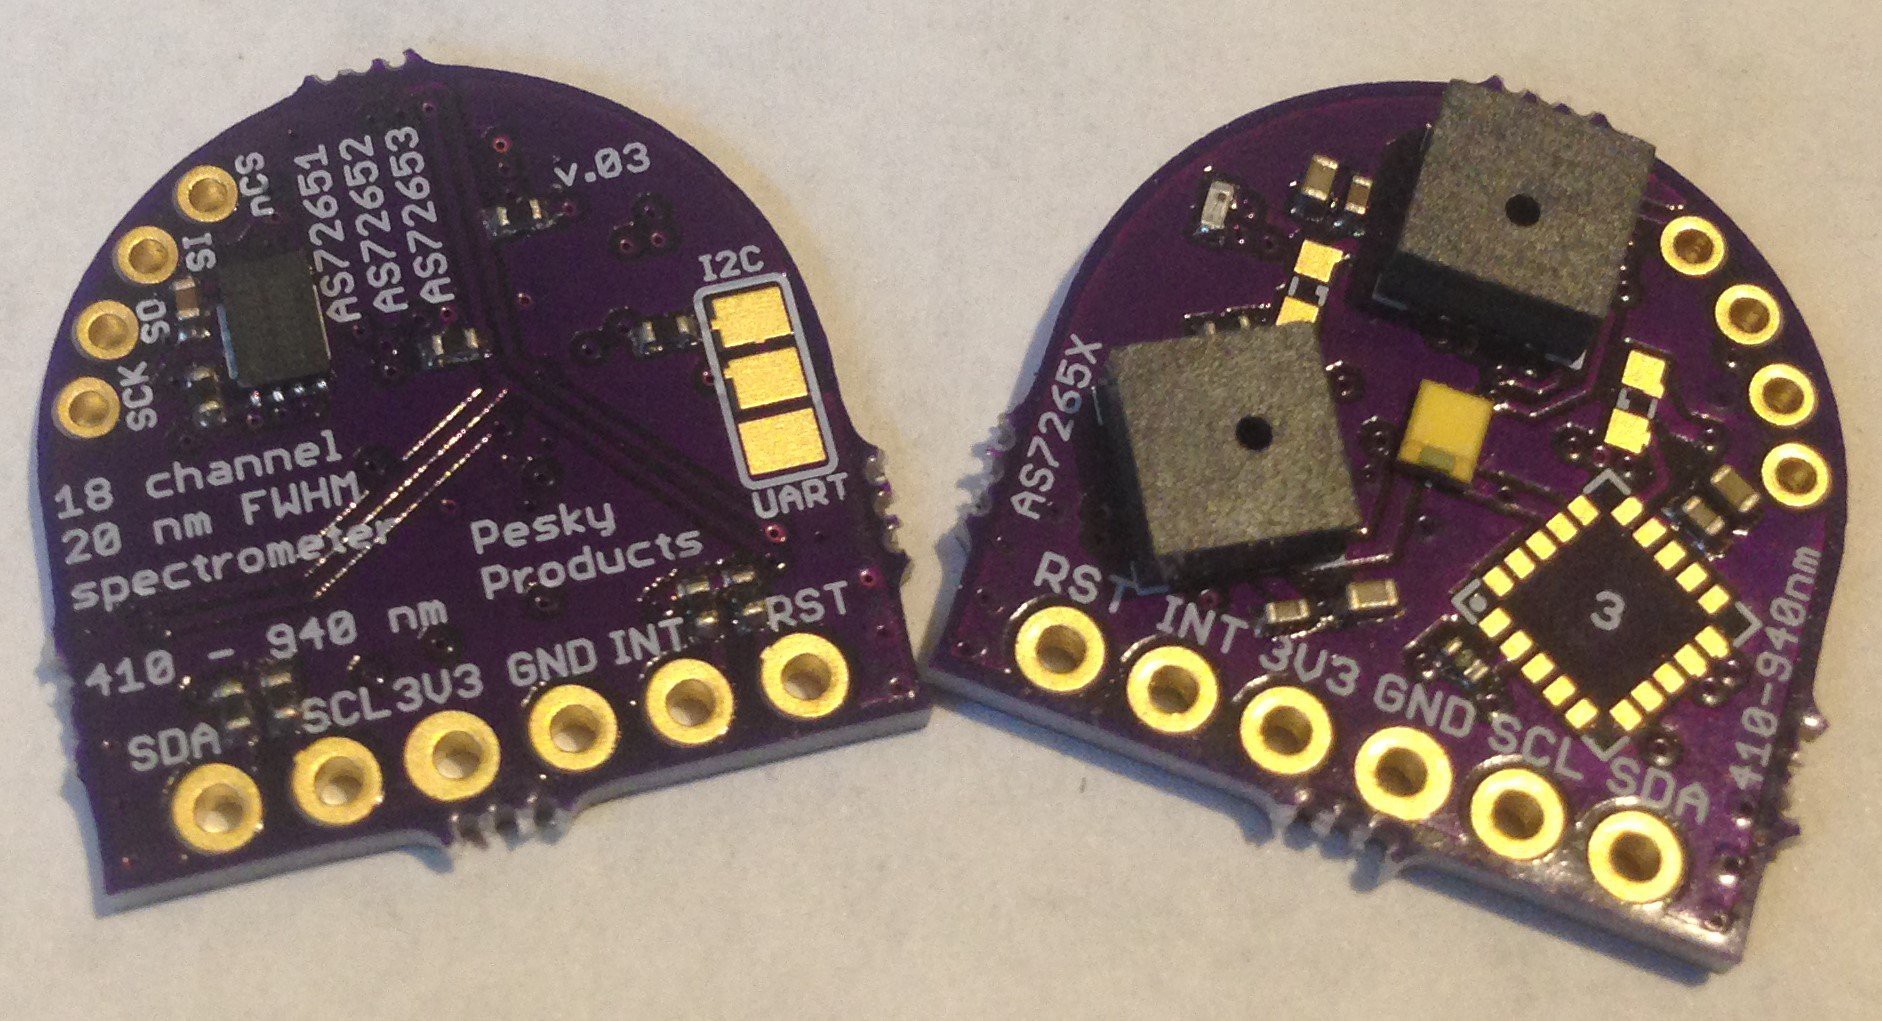
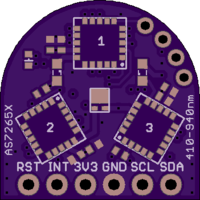
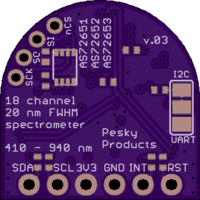
Here is what the first prototype looks like (still missing the AS72653):
![]()
Latest design iteration of the "Compact, $25 Spectrometer". Left is board bottom, right board top.
The 3V3 and GND silkscreen labels are mistakenly swapped on the back (since corrected and submitted to OSH Park as v.03a). The green indicator led is the small component on the front top left. The two 0603 led footprints for source leds 1 and 3 are left unpopulated in case the user wants to add a particular frequency source, otherwise by default the 5700 K 90 CRI white led at the center (source led 2) provides the illumination. Switching between I2C mode (default) and UART mode is done by cutting the thin trace on the back solder jumper (between the top two pads) and soldering together the bottom two pads. The 1 MByte SPI NOR flash comes loaded with the appropriate firmware to make the spectrometer work, but the user can also upgrade with the latest firmware if and when this becomes available.
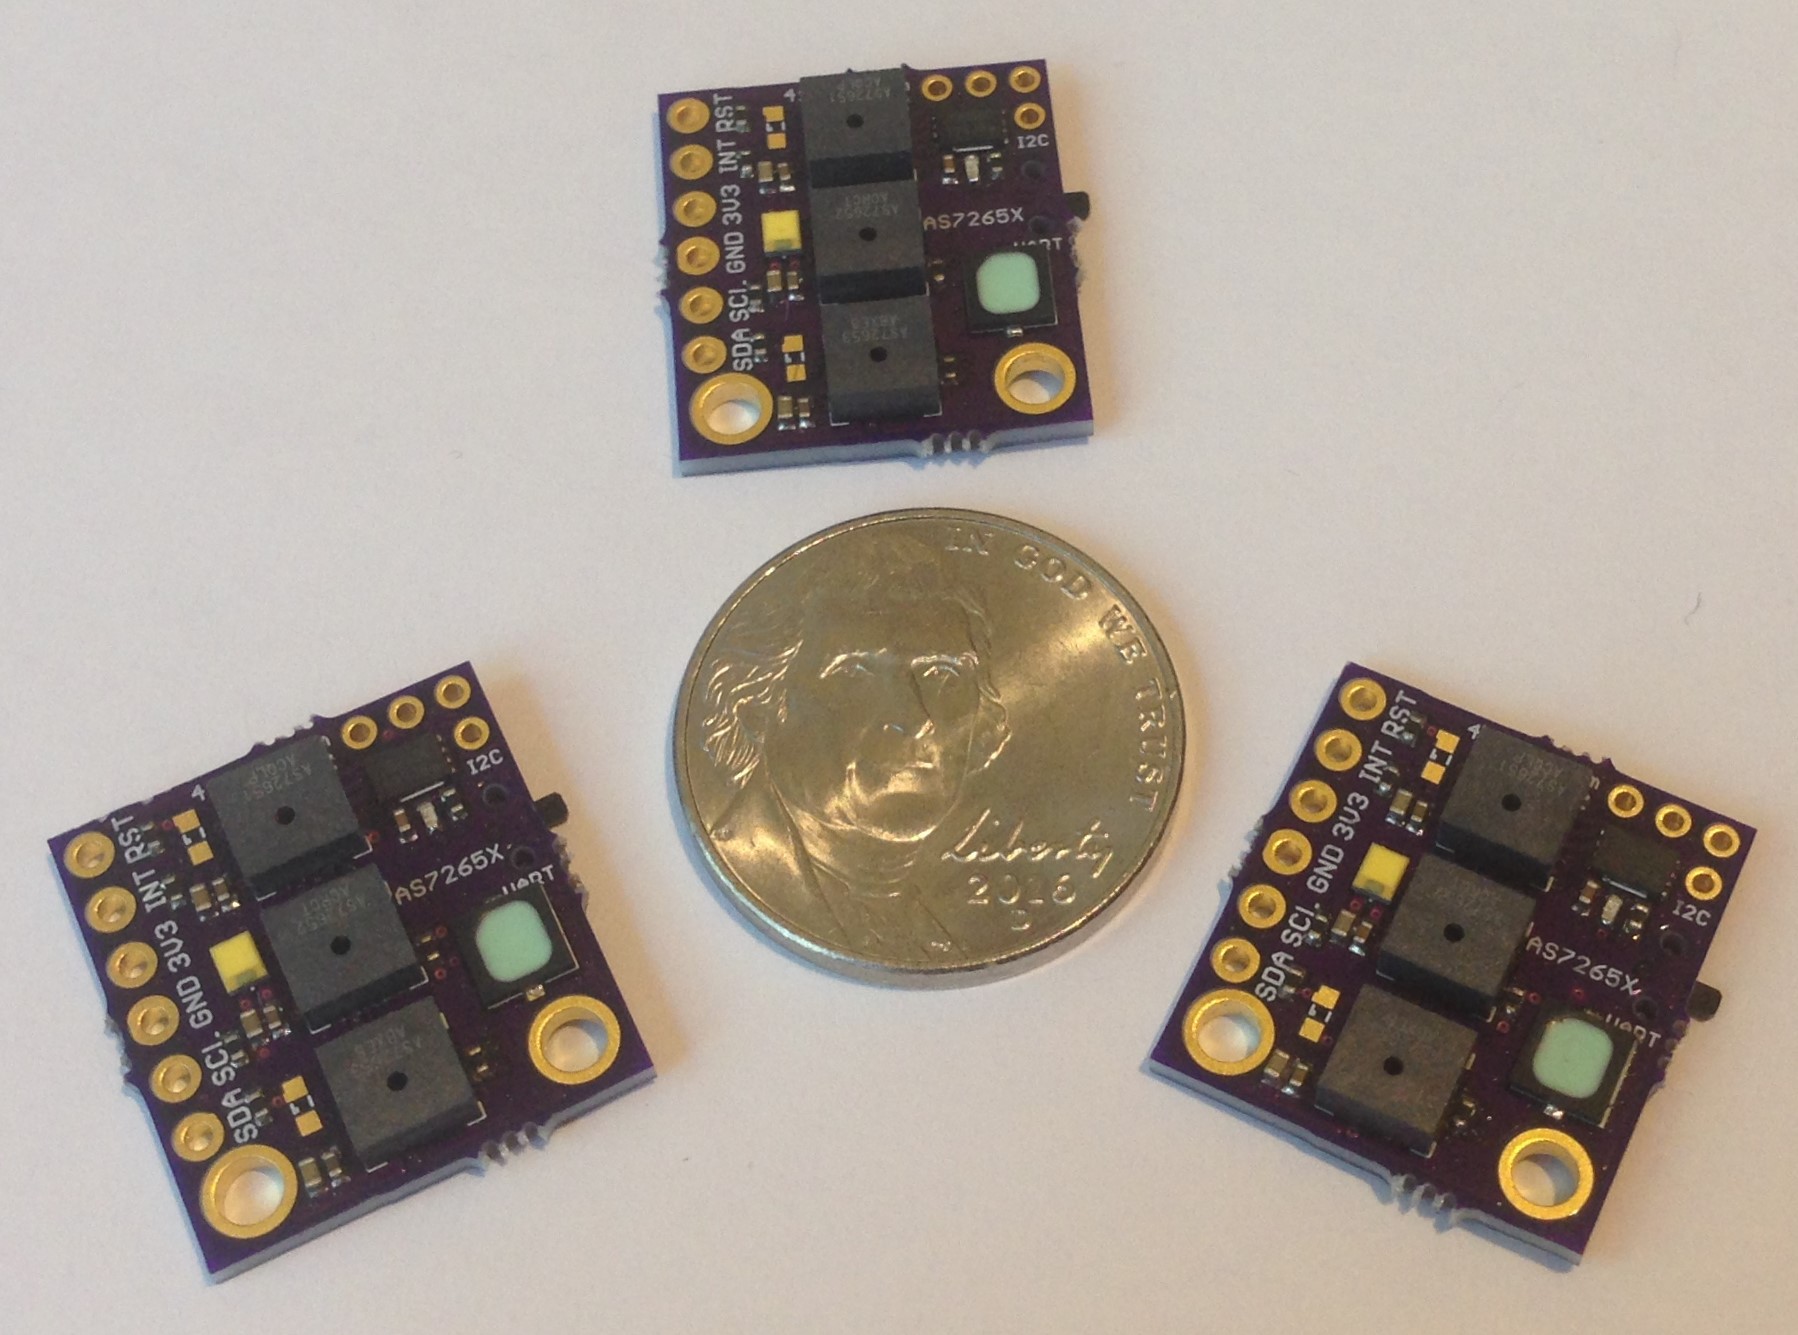
The spectrometer is smaller than a US Nickel (five cent coin), meeting the size goal of the project. The total cost to produce the board turns out to be less than $20 meeting the cost goal of the project. Of course, I have to sell the assembled and tested spectrometers on Tindie for more than the cost. But the interested maker can order the pcbs from OSH Park and the components from their favorite electronics retailer and assemble one or more of their own to save money.
I consider the design phase of the project complete. This project has been a lot of fun as well as technically challenging and satisfying. And while the results of my experiments to date using the spectrometer have not been wholly satisfactory, my hope is that using the production AS7265X ICs and the new arrangement of same will produce better results. The final device is definitely more than a toy. Whether it can rise to the level of scientific instrument or be used to discriminate between and identify different materials, etc, as shown in the AMS "tricorder" video, remains to be demonstrated.
-
Spectrometer Redesign
08/22/2018 at 23:16 • 0 comments08/22/2018
Since I am waiting for AS72653 to show up at the usual retail sites so I can assemble some more of the "production" version of the spectrometer I decided to take a look at a variant design. I noticed that both the original and new AMS AS7265X evaluation boards arrange the three 6-channel sensors in a trifoil pattern. This seems like a good idea to both equalize the distance to the target object and light source and to minimize this distance. So this is what I tried to do. I redesigned the AS7265X spectrometer to place the sensors in a close trifoil pattern.
![]()
![]()
The board is smaller (0.70 x 0.70 inch) than the original production version (0.71 x 0.76 inch) and is actually quite a bit smaller in area because of the rounded edge. I replaced the switch to toggle between I2C and UART modes with a solder jumper, since this is cheaper and in my experience one uses one or the other and doesn't jump around from one to the other. I also got rid of the IR led footprint. This is not because the IR led is not useful, it is. It's just that at ~$5 the cost of the IR led is just too much to fit within the "inexpensive" spirit of this project.
I kept the interface pins along a single edge and got rid of the 0.1-inch mounting holes which I never used. I found that soldering 22-gauge hook-up wire to the board in a heat-shrunk bundle provides a nice stiff cable with which to hold the spectrometer. Any additional mounting can be done by using a 3D printed frame around the edge or something similar.
The distance to the three sensor ports from the center of the board is a constant 0.18 inch (~5 mm) and the broad-band led is right in the center. So the target will be well illuminated and each sensor will "see" the same reflected light. This is as close to ideal geometry as I think it is possible to get with three separate 6-channel sensors and I hope that I will obtain even better results with this set up.
I should get the boards back from OSH Park in a couple of weeks for testing.
-
Getting Serious with Spectra
08/03/2018 at 21:35 • 0 comments3 August 2018
Now that the spectrometer design is basically complete (I might replace the switch with a solder jumper to lower cost) and the spectrometer functions (I get 18 channels of data) I want to learn how to get the most out of it---along the way to answering the question: What is it good for?
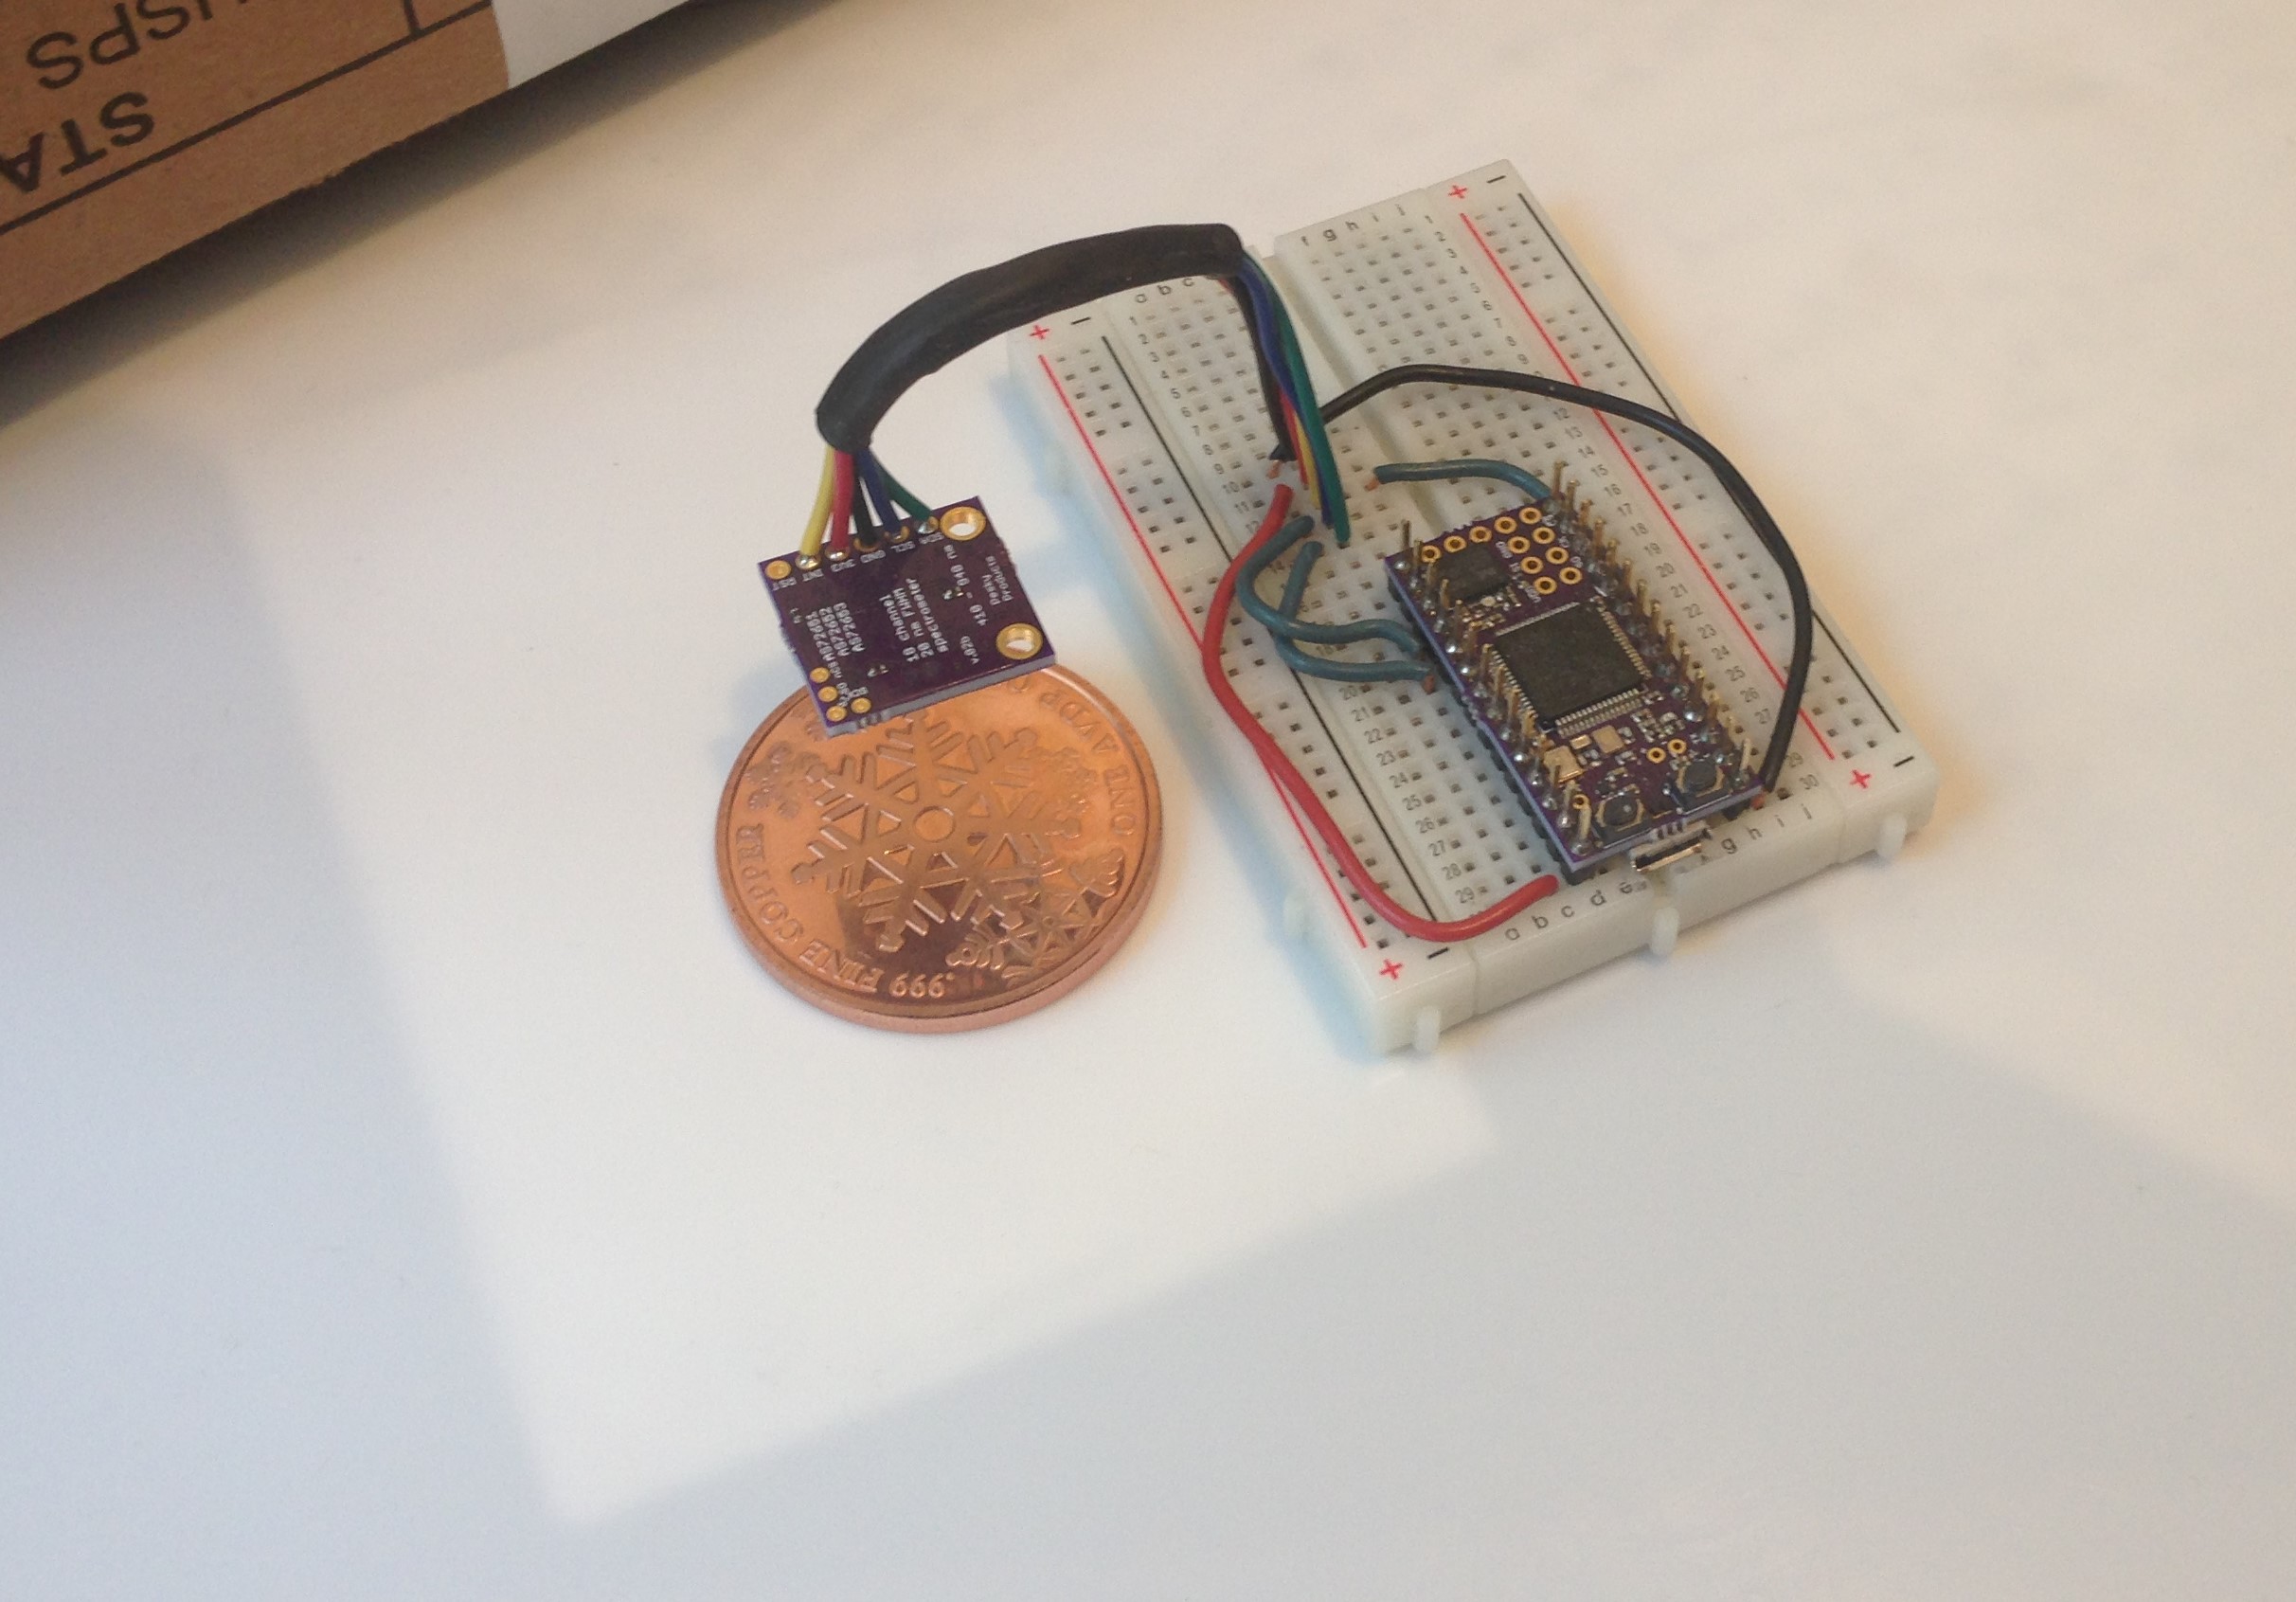
First step is to assess reproducibility and accuracy for any given task. I have been struggling with a proper reference material as well. Since I don't want to spend a lot of money, I have tried paper, aluminum foil, and most recently teflon. I bought a 12 inch x 12 inch x 40 mil (0.040 inch)-thick piece of teflon to use as a (relatively cheap) reference. It does a good job of diffusing incident light but even at 40 mils it is not completely opaque (glad I didn't get the 4 mil version!). So I slipped a piece of aluminum foil under the teflon sheet and arranged the spectrometer about 2.5 cm above the teflon surface to take some spectra as follows:
![]()
Breadboard with spectrometer, target (coin of 0.999 pure copper), and cardboard box to place over everything when accumulating data all sit on top of the white teflon sheet. You can see the rectangular piece of aluminum foil (a bit bigger than the breadboard) just under the copper coin and teflon sheet.
The idea is to average spectra with and without the target in place (in both cases with the cardboard box in place over the whole apparatus to minimize external light sources) and then compare by dividing the target spectrum by the reference spectrum at each of the 18 different frequencies. There remain flaws in this method: I am not rigidly fixturing the spectrometer, the box is leaky, I am not controlling position of the coin except by eye, etc. But I would expect even this semi-lax method to produce something close to the reflectivity spectrum shown here:
![]()
Copper isn't plotted but it would look a lot like gold except shifted to the right by ~100 nm. That is, like all good metallic conductors there should be a reflectivity edge, in the case of copper at ~600 nm. Reflectivity peaks at ~700 nm and then trails off slowly at higher frequencies.
This is what I measured:
![]()
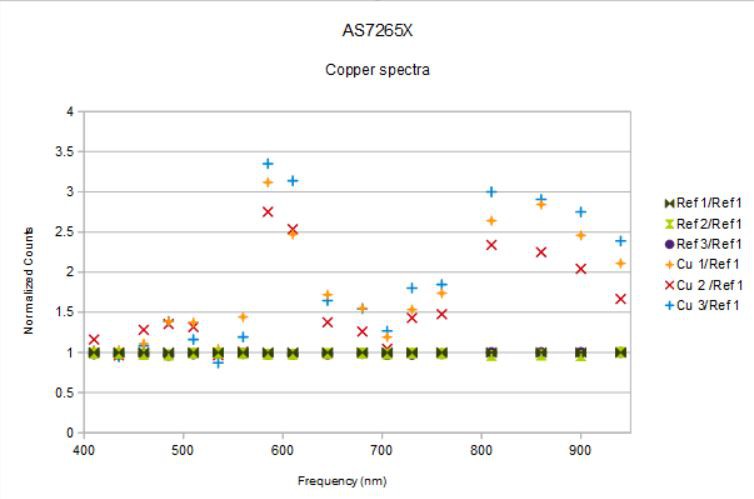
I measured each spectrum, three reference spectra and three spectra from the copper coin, separately and with a pause in between where I removed the protective box, rearranged the coin or slightly moved the breadboard, etc. The idea was to assess reproducibility of the measurements and sensitivity to small perturbations. I arbitrarily chose reference spectrum 1 as my reference and I am plotting the ratios of all six spectra relative to reference spectrum 1 above.
The reference spectra are identical within the width of the symbols used to mark the data. This shows that at least the spectrometer is measuring the same thing from the teflon + aluminum foil reference material each time.
Next, the copper spectra show ratios above one for almost all of the channels because the coin is partially mirrored and should reflect a lot more light at most wavelengths that the diffusely-reflecting teflon sheet. There is relatively low reflectance between 410 and 535 nm as expected, and a strong edge at ~580 nm, also as expected. And the spectrum tails off slowly above 800 nm also as expected.
What is not expected is the broad dip at 700 nm where there should be a broad peak!
Is it possible this is due to a geometric effect of light at these frequencies being unable to get to the photodetectors? This is why I repeated the experiment three times and adjusted the spectrometer/target each time. If there was some subtle alignment issue this would show up as a more wild variation; these three copper spectra are remarkable consistent and reproducible.
This is not pure copper since the surface no doubt is somewhat oxidized; is it possible that the thin oxide layer could produce the absorption at 700 nm? Nope:
![]()
The edge shifts a bit to the IR when there is a thin oxide, but the reflectivity above the edge should be monotonic and approach ~100%; there should be no dip.
So what the heck?
Do I have an error in the sketch? Maybe the signal is too high at ~700 nm and I am truncating it? I don't think so. The counts I am seeing for the copper target at 705 nm are just a few hundred and the calibrated data is available as a float. Hard to over-run here...
Maybe I am missing something simple....
-
First Production Boards
07/22/2018 at 16:49 • 2 comments22 July 2018
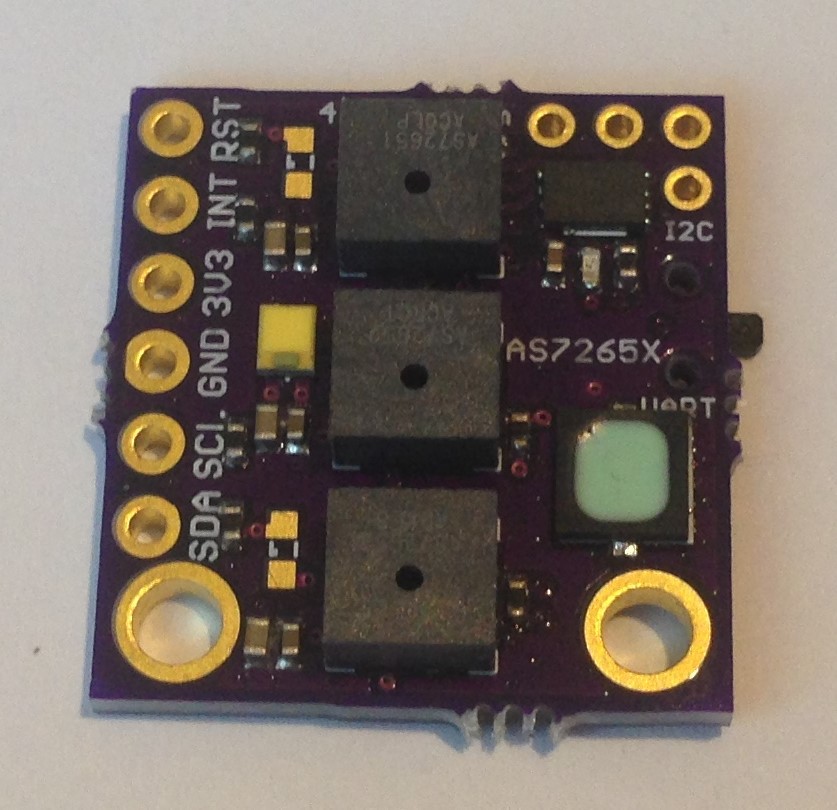
Got the latest design revisions back from OSH Park and put three together. I consider these the first "production" boards even though I assembled them by hand; they are the final design and ready for a pilot production run in China:
![]()
Also, I was able to buy some of the AS72651 and AS72652 ICs so these are the first boards that have all three of the actual AS7265X ICs: AS72651, AS72652, and AS72653. The previous designs used AS7263 for the AS72651 IC and AS7266 for the AS72652 IC. I bought the AS7263 and AS7266 directly from AMS and these are supposed to be identical to the AS72651 and AS72652, respectively. But probably pre-production variants or something. Anyway, these three boards use the "proper" or more likely "production" versions of the AS7265X chip set.
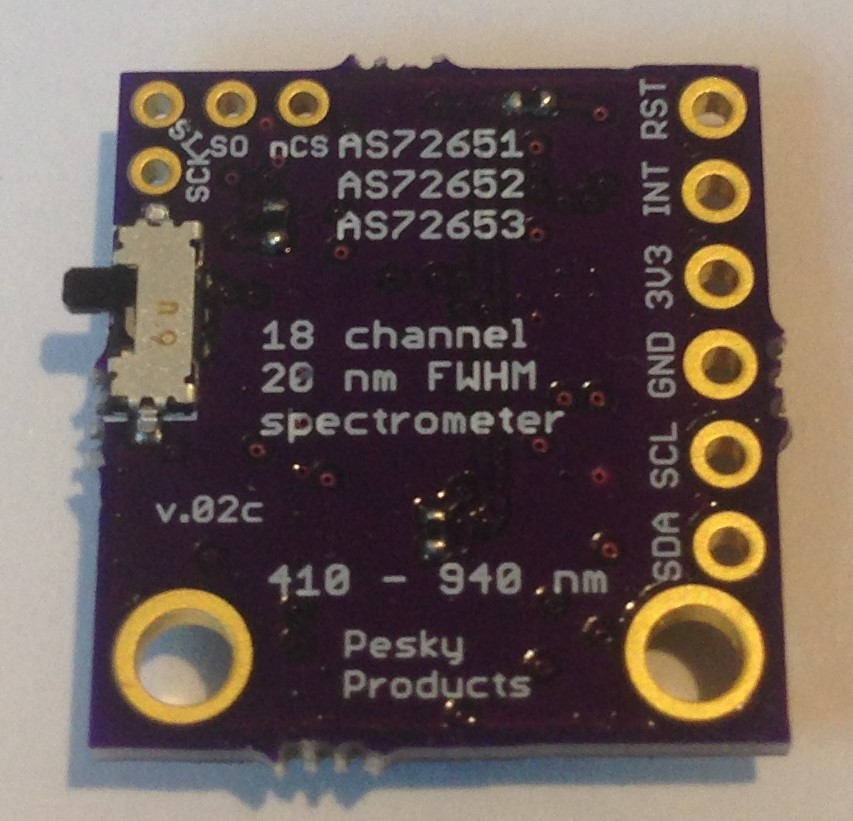
![]()
![]()
Everything works as expected. The switch I added to the back changes the mode from UART to I2C; in the former case SDA (RX) and SCL (TX) serve as the UART port. The fact that these have 4K7 pullups doesn't seem to impede the serial UART data flow. I prefer I2C but it is nice to have the option at the flick of a switch. I suppose a solder jumper would have done as well and saved a bit of BOM cost.
I should be possible for the user to use a soldering iron to add 0603 leds of his/her choice for the other two source leds. I like having the broad-band IR source led (the bluish square thingy) but this adds significanlty (~$5) to the BOM cost. I think the spectrometer works well-enough with only the broad-band white source led (smaller yellowish thingy) for many applications, so I am kind of on the fence about the benefit of having the IR led too.
The total cost ended up being about $21 without the IR led and about $26 with. So this meets the goal of a "Compact, $25 Spectrometer". I listed the final design version (v.02c) of the AS7265X spectrometer as a product on Tindie for $49.95 with the option of adding the broad-band IR led for $10 extra. Considering I will assemble these by hand for a while to test demand, this is still a bargain. But for the cost conscious and/or those that want an assembly challenge, the design files and BOM are open source. I will post the final design and BOM on the project page.
-
Calibration Method(s)
07/16/2018 at 00:00 • 0 comments15 July 2018
Just a brief note on calibration. In addition to the calibration plate I designed (which has not been terribly useful) there is this note on calibration using a CFL (mercury vapor light) from the PublicLab.org site, who sell their own inexpensive (albeit much larger) spectrometer for hobbyists.
Calibration is the key to getting sensible results from any spectrometer, and the difficulty in obtaining known spectra for assessing the capabilities of these $25 Spectrometers has made it difficult for me to judge how well I can trust the various spectra I have been able to generate with the devices to date. I was able to verify that the spectra using the broad-band IR led source and a standard reflective mirror looked a lot like the one in the IR led data sheet. I looked at maybe using sources available from spectrascope suppliers but these tend to be quite expensive. But I would really like an inexpensive calibration method using a source with well-defined/known peaks within the 410 - 940 nm range and this CFL method looks like it just might fill the bill.
-
More Applications
07/09/2018 at 23:50 • 0 commentsJuly 9, 2018
What's the point of having a new toy if you don't play with it?
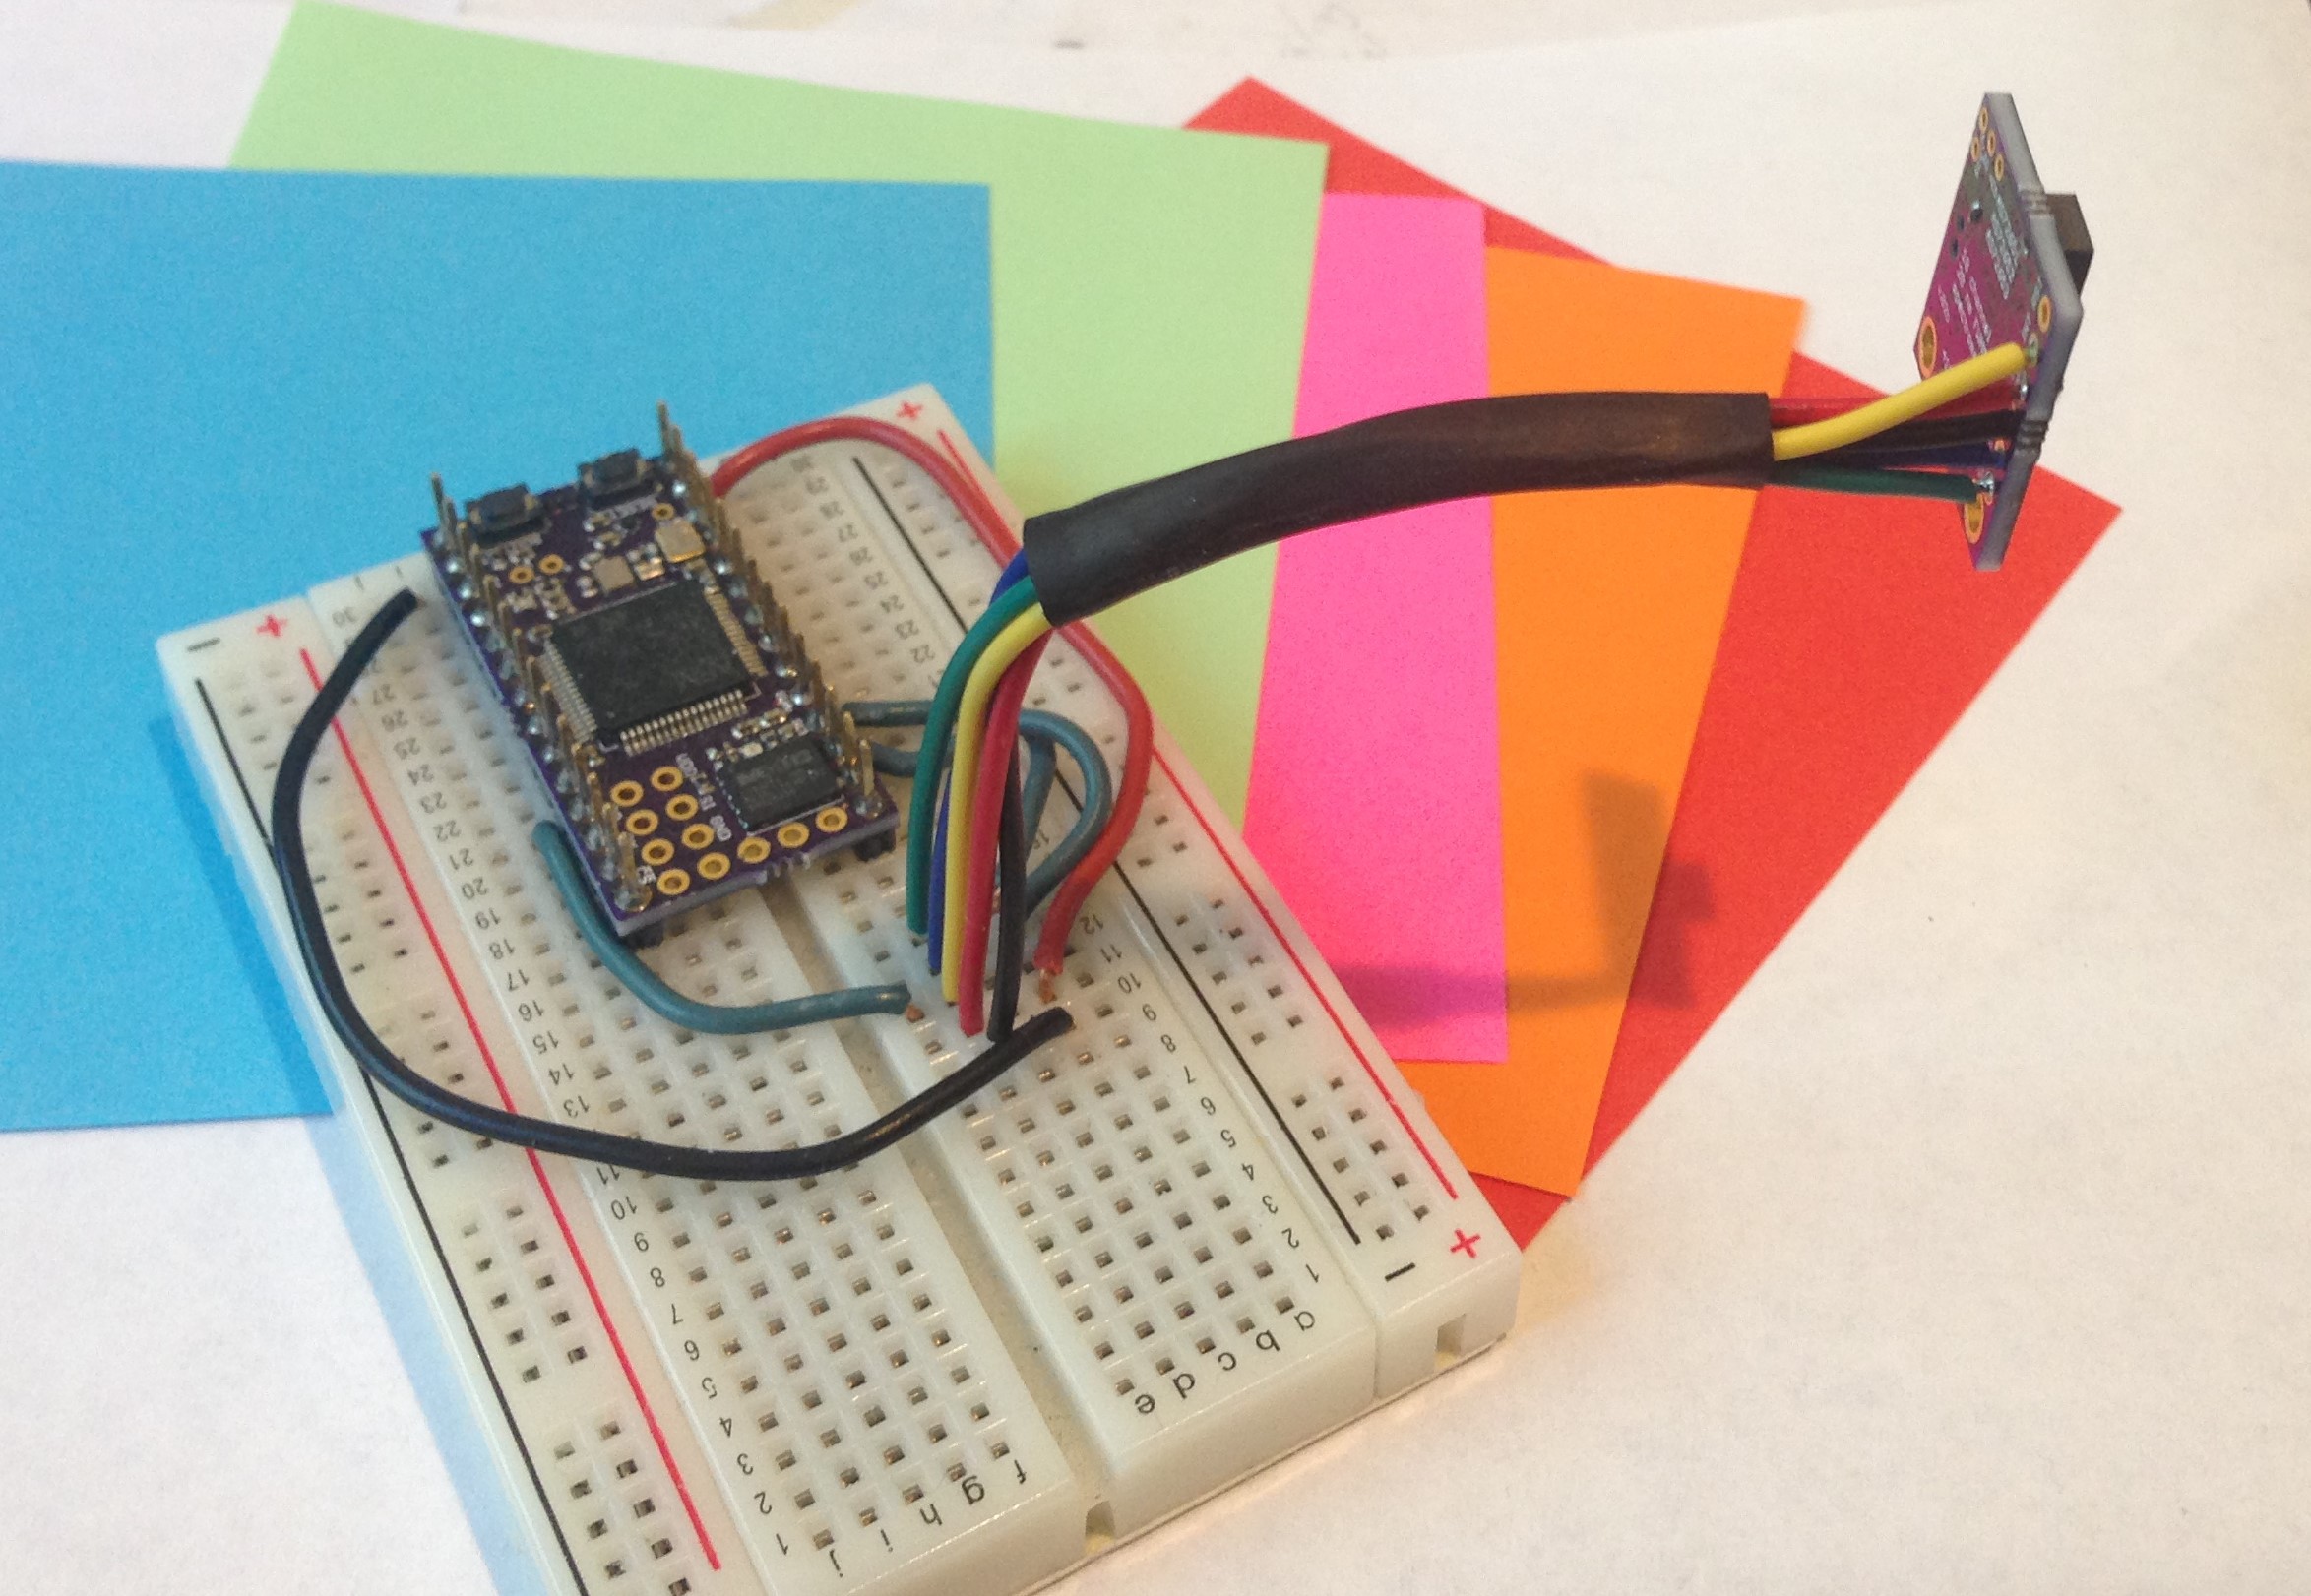
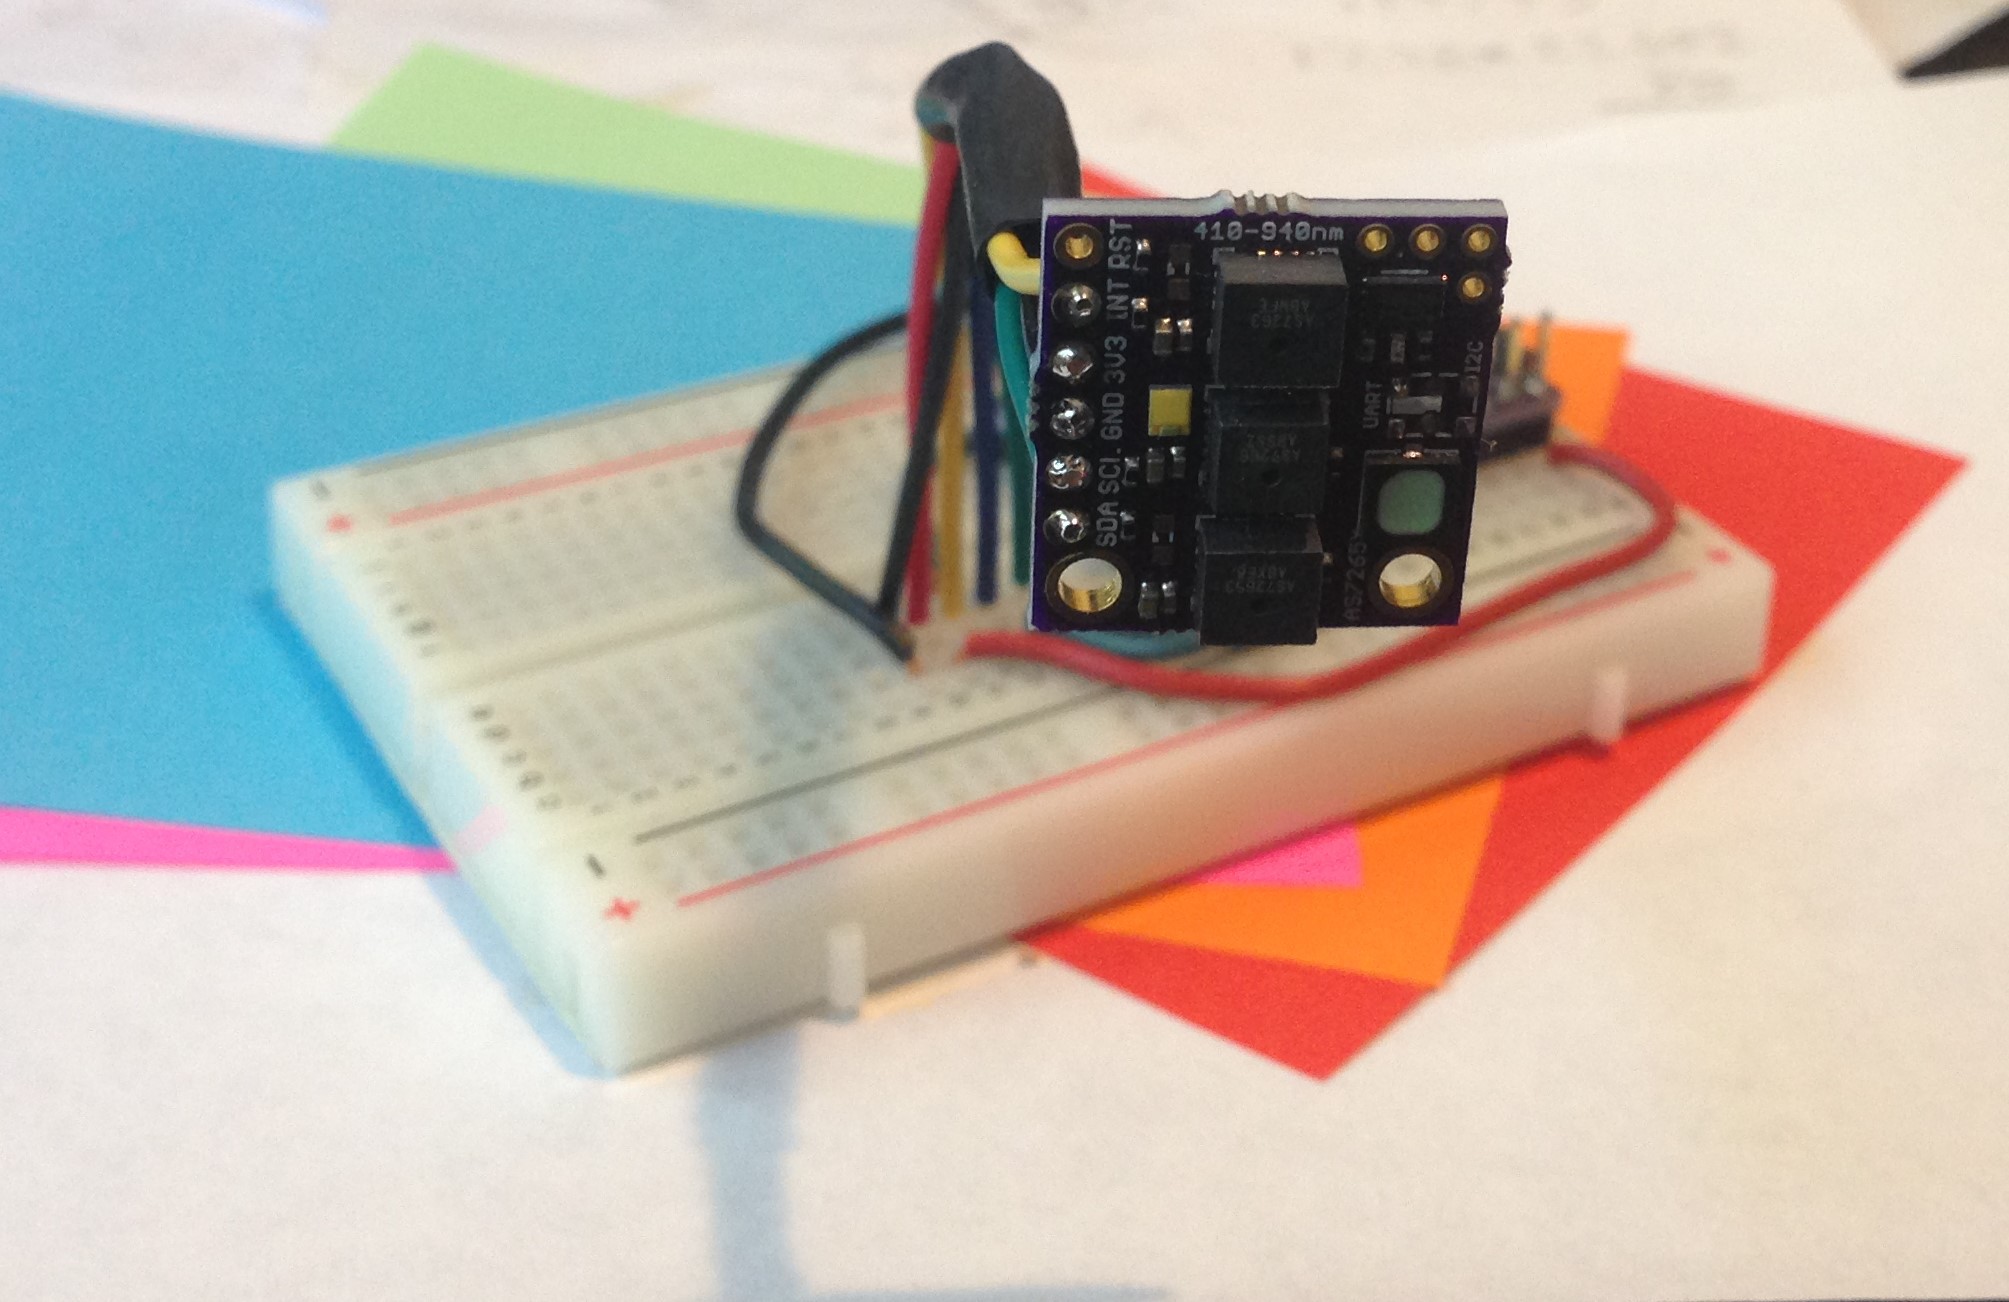
First thing I did was to replace the J-hook test leads with 22 gauge wire soldered onto the plated-through-holes at the board edge. A bit of heat shrink and I have a nice rigid cable that I can plug into my breadboard. Much cleaner and easier to use now, although not as rigid as I would like. The third hand as a support isn't much better, so I need to develop some way to mount the board in a more reproducible manner. Maybe using the mounting holes...
![]()
![]()
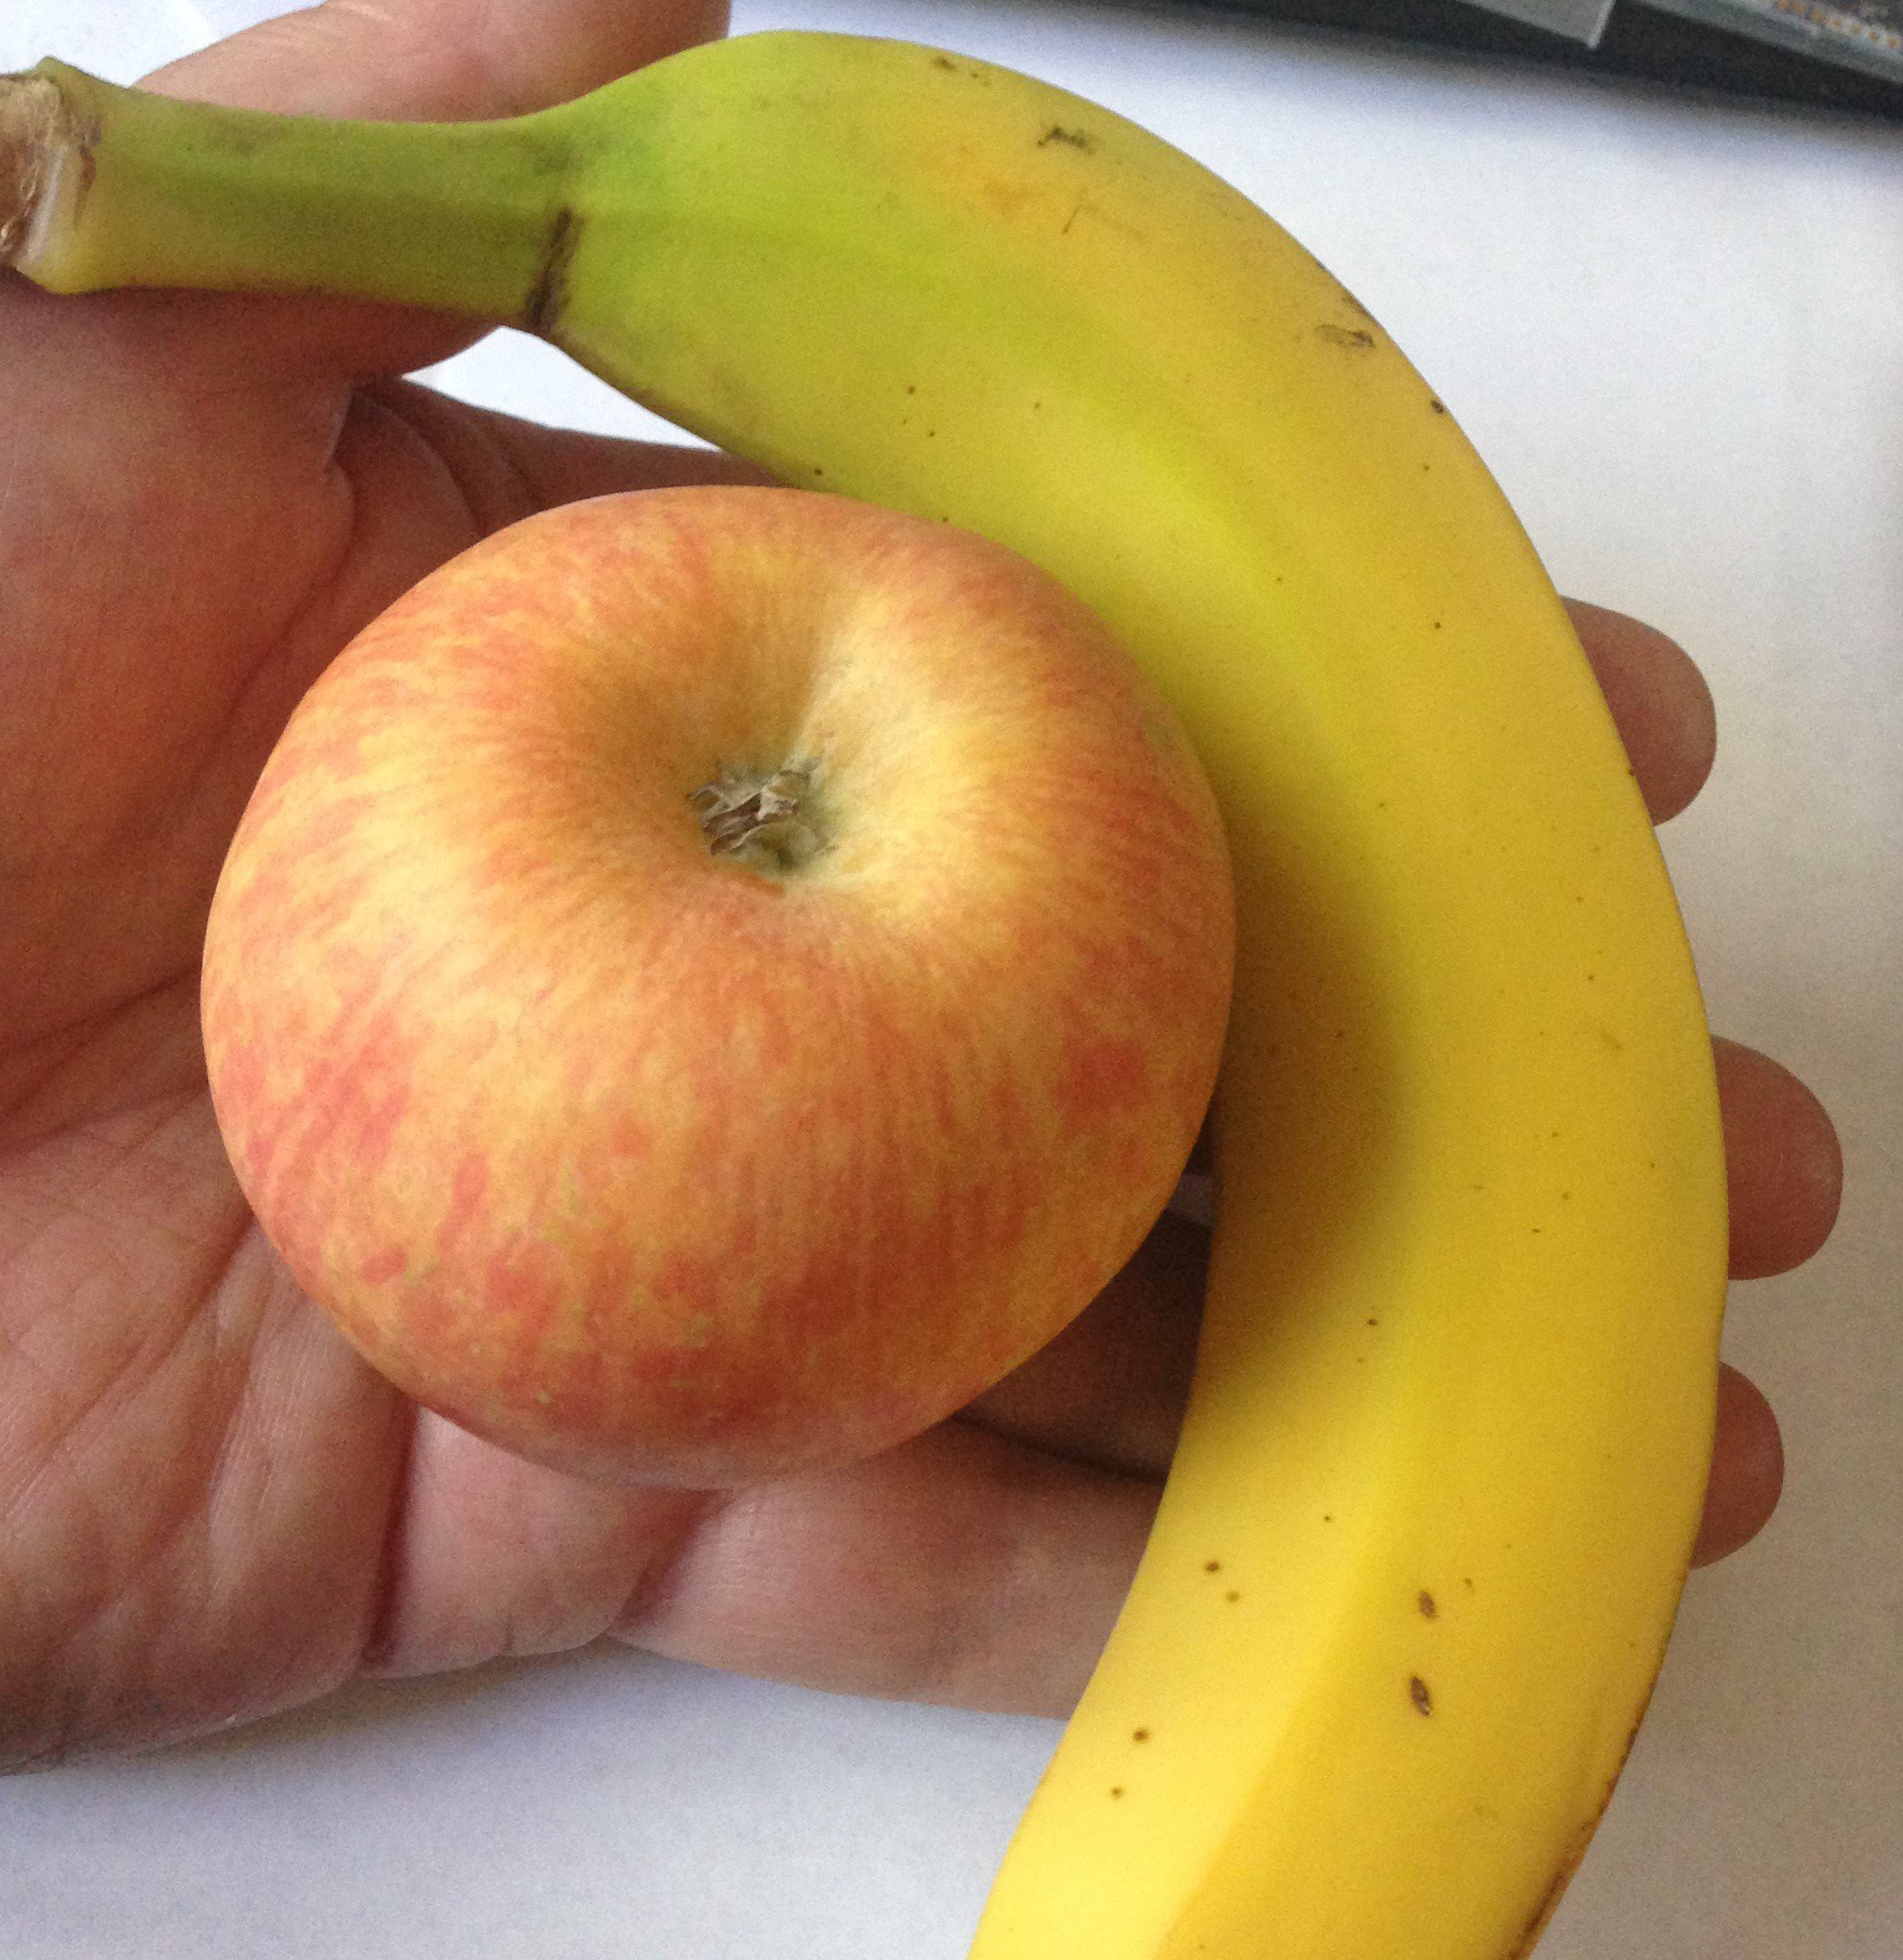
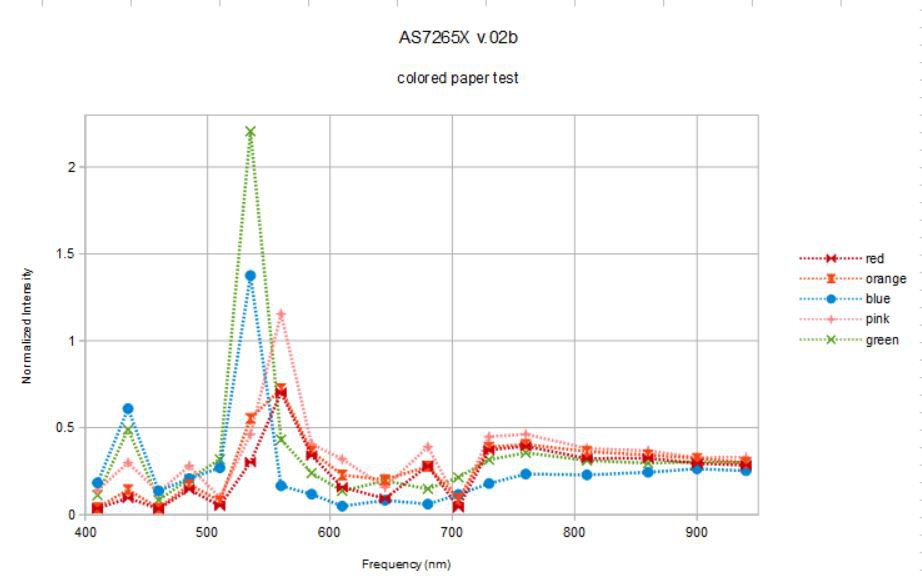
I will turn the spectrometer on the multi-colored paper targets in a bit, but first, let's take a look at some simple organic objects; an apple, a banana, and my palm:
![]()
What color is the apple? Banana? Well, I see yellow and green in both, and a bit of red in the apple. What color is my palm? It is somewhat apple-like, but not green ;> What does the spectrometer say?
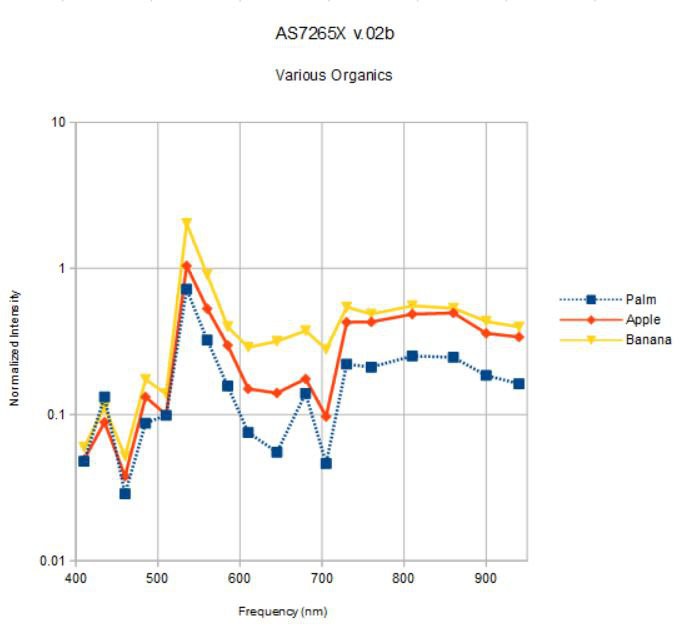
![]()
I am plotting the spectrum measured from each object at 16x gain, 100 ms integration time, and 25 mA for both white and IR broadband source current. The spectra are normalized by the spectrum measured under the same conditions for the vanity mirror as reference. I expected the spectra to be less than one (less reflective than a silvered mirror) but I didn't control the distance from the spectrometer to the objects very well; hard to do with curved surfaces in general.
Maybe my palm is green! The peak at 535 nm dominates for all three objects. None have a significant blue component and above 600 nm the banana, somewhat surprisingly, has the flattest spectrum with the highest reflectivity. I am not quite sure what to make of this. Are the apparent color differences we see with our eyes in the objects above really due to small, relative differences between similar spectra? What happens when we use obviously different objects, like the colored paper above?
I repeated the same experiment (with the same settings) as above but this time I took more pains to keep the distance between the spectrometer and objects the same by leaning the paper targets agains the mirror surface and restarting the sketch to grab a new spectrum. It was not possible to keep the paper targets completely flat nor in the exact same position, still I was surprised that in some cases I measured twice the light (twice the calibrated intensity anyway) reflected from the paper target than from the silvered mirror!
![]()
Well... this is sort of psychodelic, flourescent colored paper. I wonder if the dyes that give the paper these colors are really flourescing under the broad-band illumination? This wouldn't be too surprising given the very strong deep blue (410 nm) component of the source light. Do the spectra make sense?
The blue and green paper targets reflect very little red spectral components and the orange and red paper targets reflect little blue. So this makes sense. The green and blue paper targets have reflectance peaks at 435 and 535 nm, the blue paper with a bit more 435 nm and a bit less 535 nm, green vice versa. So this makes sense. Pink, orange, and red paper targets have a dominant peak at 560 nm. There isn't a lot of difference between these, similar to the case of the organic targets above. Perhaps if we normalize everything to 1 we will discern more:
![]()
OK, the orange paper target reflectance has large components at 535 and 645 nm that the red and pink targets do not. Pink and red target paper reflectivity are almost identical below 700 nm except that the pink paper target reflects a bit more blue (435 nm) and a bit less orange (585 nm) color. Is this enough to cause the apparent color difference between this red and pink paper?
None of these tests is particularly scientific nor are they meant to qualify the photospectrometer for any particular use. It's just part of the natural process of figuring out what it can and cannot do.
One thing I have learned for sure; it is a lot of fun to use!
Just a note on cost and availablility. The ten each of the AS72651/2/3 I bought from the AMS web store for $4.50 each in May are now $6.88 each for orders of 100. Other retail sites have similarly elevated prices but little or no stock. In fact, I can't find the AS72653 in stock anywhere, even on the AMS site. The good news (maybe) is that FutureElectronics.com seems to have two of the three in stock and for $4.88 each in units of 100. So with the SJAS110100 switch (~$1), Luxeon-Z-ES broad-band led (~$1), SPI flash (~$1), pcb (~$1), and three smart spectral sensors (~$15) the total cost (with taxes and shipping, etc) of the 18-channel photospectrometer will be right around ~$20, maybe ~$25 if I include the OSRAM broad-band IR led. The cost of the first 100 in an initial production run will be a little higher since the fab always charges an NRE of $350 for new designs. So it looks like the final (I hope) design can be produced close to the $25 target cost. This means I will likely have to sell these on Tindie for $49.95, maybe a bit more.
Open source means everything about the design is (or will be) made available so you can build your own. But my Tindie store is a business and I have to make a profit. When I do have these in stock and for sale, perhaps in August, I hope you will all consider buying one.
-
Continued Evolution of the Design
07/08/2018 at 17:17 • 0 comments7/08/2018
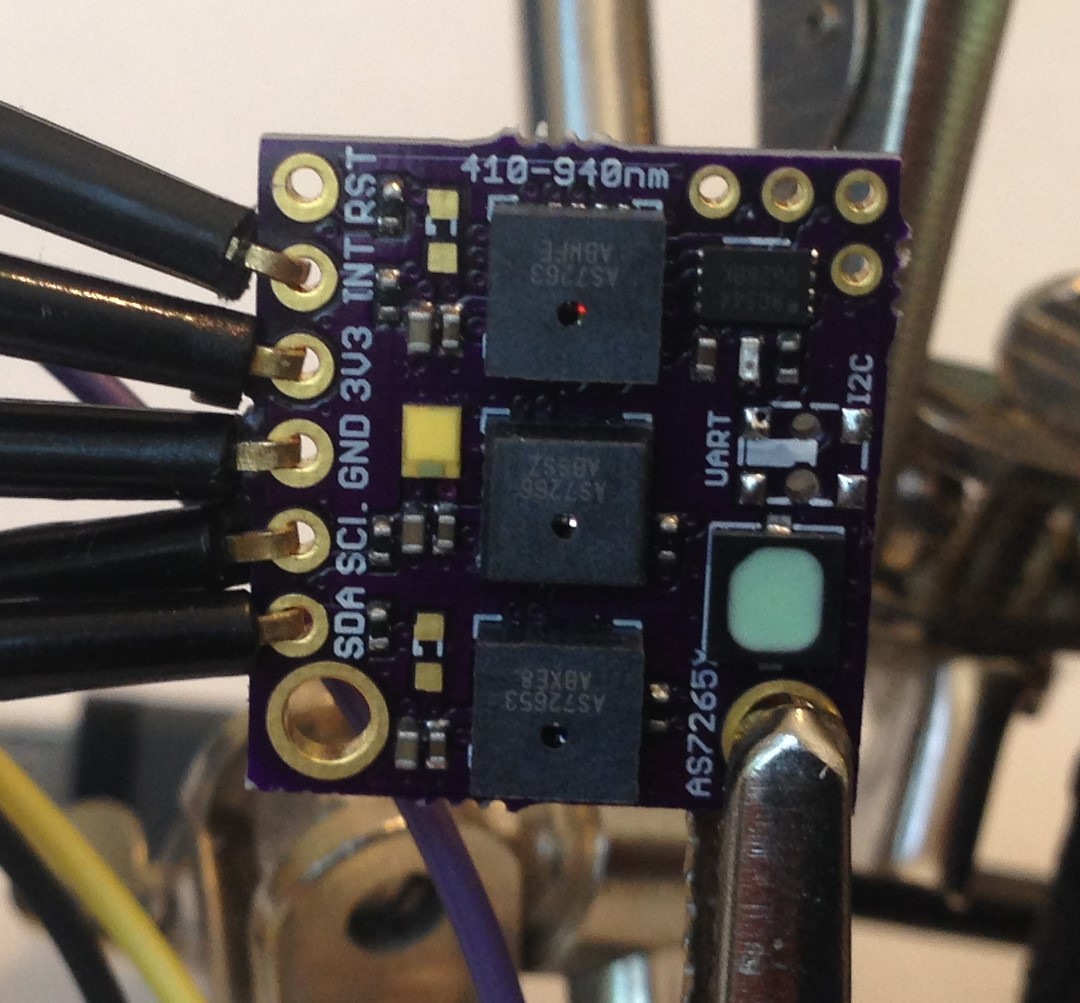
Now that everything works, I am in the process of refining the design to optimize utility. I got the latest iteration (v.02b) back from OSH Park and built one.
![]()
Here ready for testing.
![]()
A closeup view.
I added 2.54-mm diameter mounting holes at the bottom. I put all of the IO on one side to make it easier to solder a wire bundle or add a connector. I added a footprint for OSRAM's SFH4735 broad-band IR led. And I added what I thought was a switch to more easily go from I2C to UART mode but the SPVM110100 I selected is really a tactile button, so in the next revision (v.02c, I hope the last) I replaced it with my old standby the SSAJ110100 mounted on the back of the board. In fact, I had to remove the pesky SPVM "button" since I also got the footprint wrong and it was shorting the board! And, since I ran out of the MX25L4006E 4 Mbit SPI NOR flash I was using I switched to the W25Q80BLUX1G 8 Mbit SPI NOR flash with same 2 mm x 3 mm USON footprint, of which I have an abundance. I moved the (green) indicator led to just under the SPI flash; this is useful for indicating data ready interrupts when using the spectrometer. I kept the two 0630 footprints on the board, and kept them unpopulated, in case I (or users in general) want to add a specific light frequency (like UV or IR, for example) as an additional source.
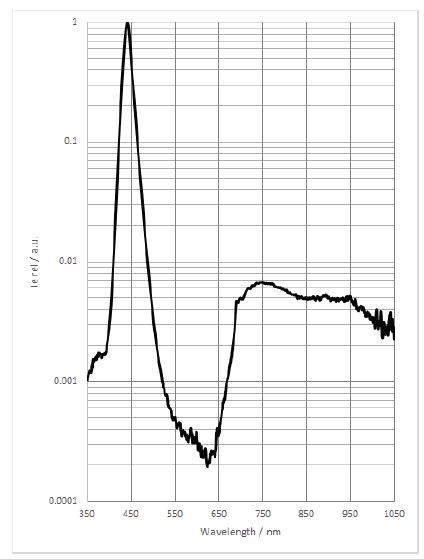
The OSRAM SFH4735 is purported to be a broadband IR source:
![]()
with a convenient blue glow (peak at 440 nm) to aid illumination (since the broad band IR above 700 nm can't be seen by humans). This is a great idea, but the problem is the IR is only significant when the current is cranked up pretty high (350 mA in the output spectrum above). My little Dragonfly has an output maximum of 150 mA. But the AS7265X maximum source led current is only 100 mA anyway. Let's see what we get.
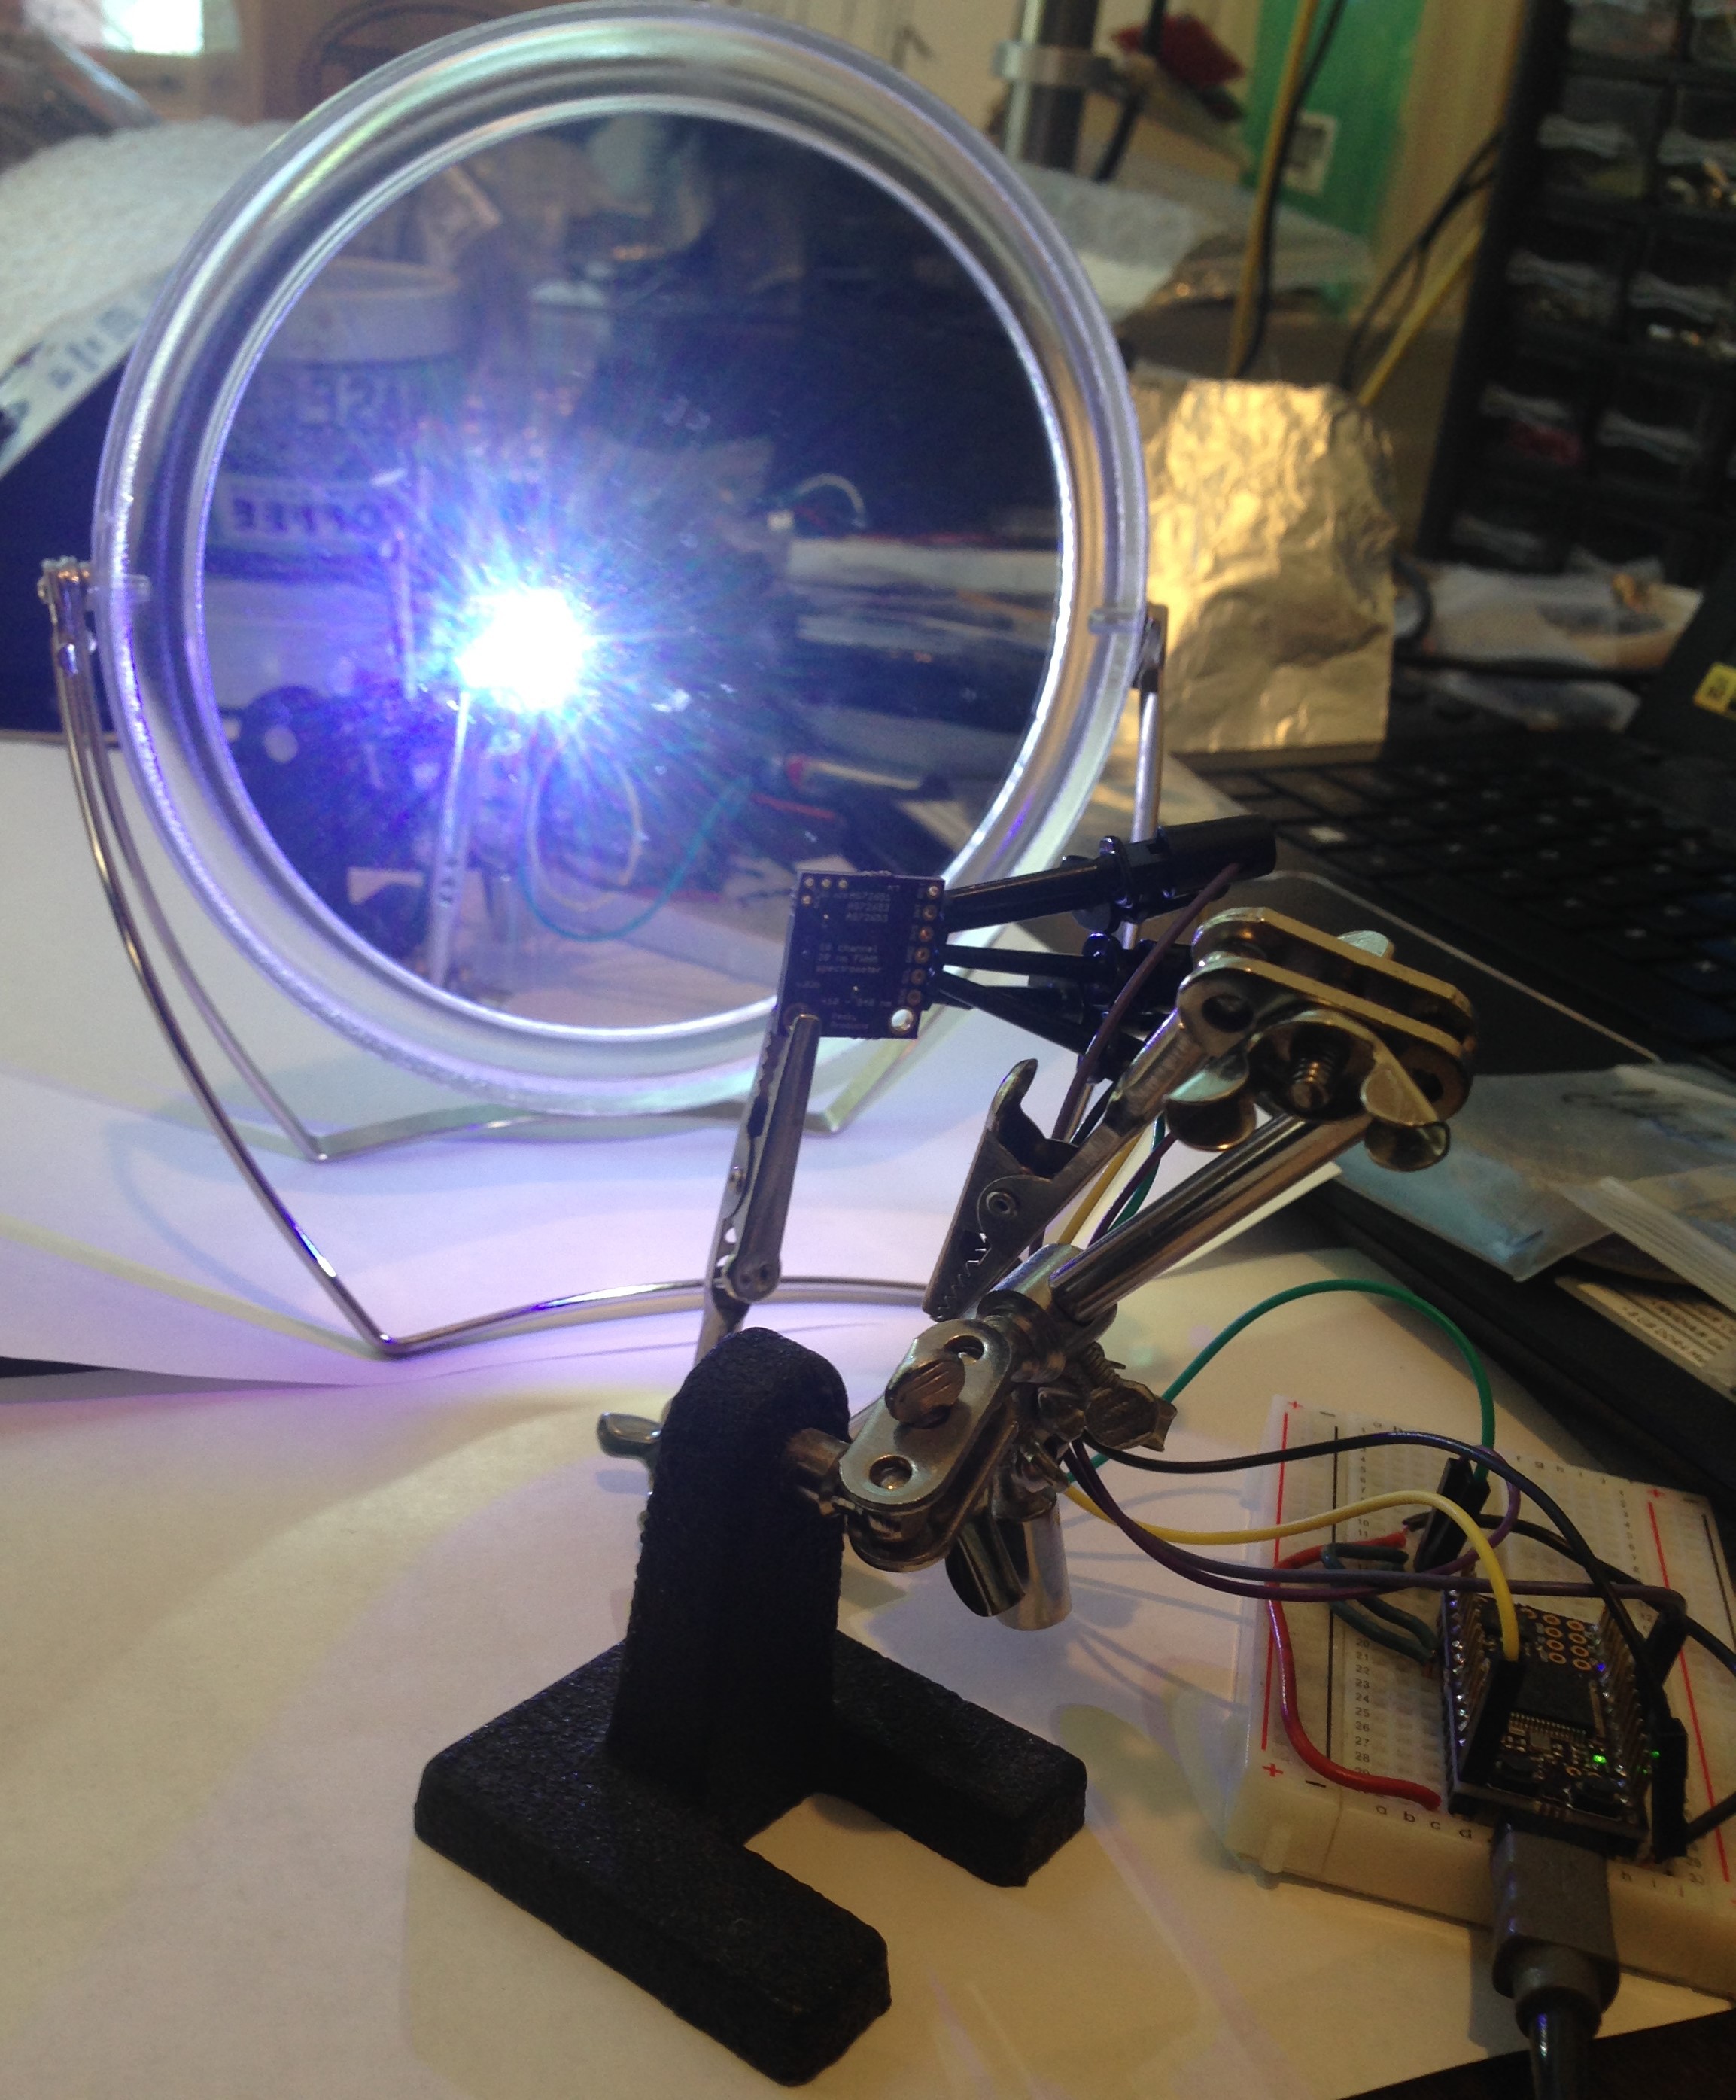
First of all, I procurred the wife's portable vanity mirror and made use of my $5 third hand to create a scientific laboratory for testing the latest version of the spectrometer:
![]()
![]()
The above is using both the broad-band Luxeon-Z-ES 5700 K 90 CRI led and the OSRAM SFH4735 at 50 mA output current.
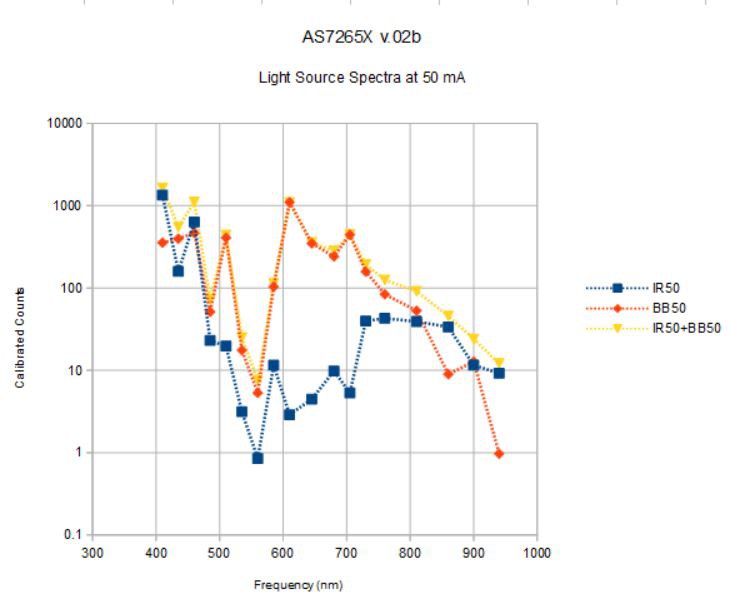
Under these conditions (16x gain, 100 ms integration time, 50 mA sources, ~6 cm distance from source to mirror), this is what I see:
![]()
These spectra are averages over ten or twenty seconds to eliminate variations due to fluctuating source current and anything else. I really should solder the wires onto the spectrometer, since the j-hooks are a bit dodgy. At 50 mA, the broadband IR (IR50) seems to add a bit to the white light (BB50) source (~10x at 850 and 940nm) above 750 nm, as it should, as well as adding to the blue end of the spectrum. The OSRAM SFH4735 is fairly expensive, and it is not yet clear that it is adding high value; more testing will tell.
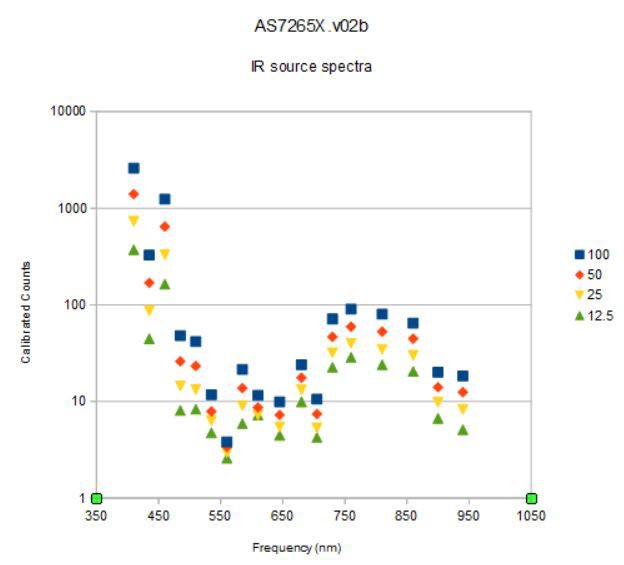
The IR spectrum looks a lot like the spectrum in the SFH4735 datasheet except that the peak at 440 nm is suppressed. This might have to do with the low current.
![]()
Looks like the spectra just increase monotonically with increasing led current, so any differences between what I measure and the data sheet spectrum are due to variations from led-to-led, or different sensitivity of the spectrometer at different light frequencies. Well, this is the whole point of using a good reference, and I am assuming the vanity mirror is such a reference (at least it is better than white copy paper).
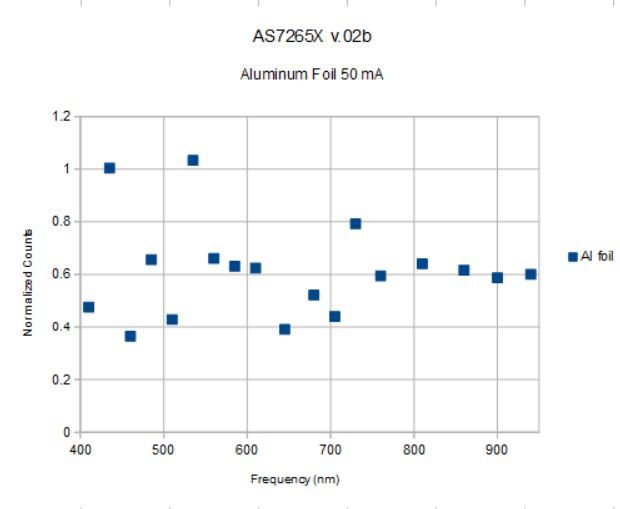
So let's measure something with the combination of white broadband and IR broadband sources at 50 mA. This is what aluminum foil gives:
![]()
This is the spectrum measured from aluminum foil divided by the source spectrum using both the broad-band sources (white light and IR) at 50 mA and the spectrometer settings above. Aluminum has a pretty high reflectance that is nearly constant over this spectral range so should give a horizontal line less than one (aluminum foil is not as reflective as a silvered mirror), and this is what we see, more or less. The line is at ~0.6 with most points lying within +/- 0.2 of 0.6
I have noticed that the relative strength of the signal at various frequencies (435 nm in particular) is somewhat sensitive to the specific orientation of the spectrometer to the test object. This might be due to the location of the interference filter for these frequencies inside the spectral elements in general, or due to the arrangment of the filters in this specific sensor on this board. But there does seem to be an acceptance angle problem of some sort. But rather than the three separate 6-channel sensors thwarting any attempt to use the AS7265X system as an integrated spectrometer as some feared, it looks more like one or two individual filters are hyper-sensitive to alignment issues, here the 435 and 535 nm channels.
Still, the spectrometer works well, is easy to use, and is very inexpensive. Only additional testing, and application to material discrimination/identification, will determine its ultimate utility.
For those following the design development, here is the latest iteration submitted to OSH Park. If anyone orders and assembles some of these, please let me know! -
Metals Spectra
06/21/2018 at 22:42 • 7 comments21 June 2018
I completed the Arduino sketch faster than I expected. I have everything working except I can't seem to get the interrupt to work. I will eventually.
Edit: It helps when you don't forget to declare the interrupt pinMode! Interrupt working now...
For the moment I am polling the data ready bit in the configuration register. I am updating the Arduino sketches I am using on github. I am reading the 18 data channels, both raw and calibrated, using simple C++ API functions like:
  AS7265X.readCalData(calData);
  for(int i = 0; i < 18; i++)
  {
   Serial.print(freq[i]); Serial.print(","); Serial.println(calData[i]);
  }
This makes it easy to average data, plot individual channels or all the channels at once. I might connect a Sharp TFT display and see if I can literally generate spectra but for now I am content to plot the data using a spreadsheet.
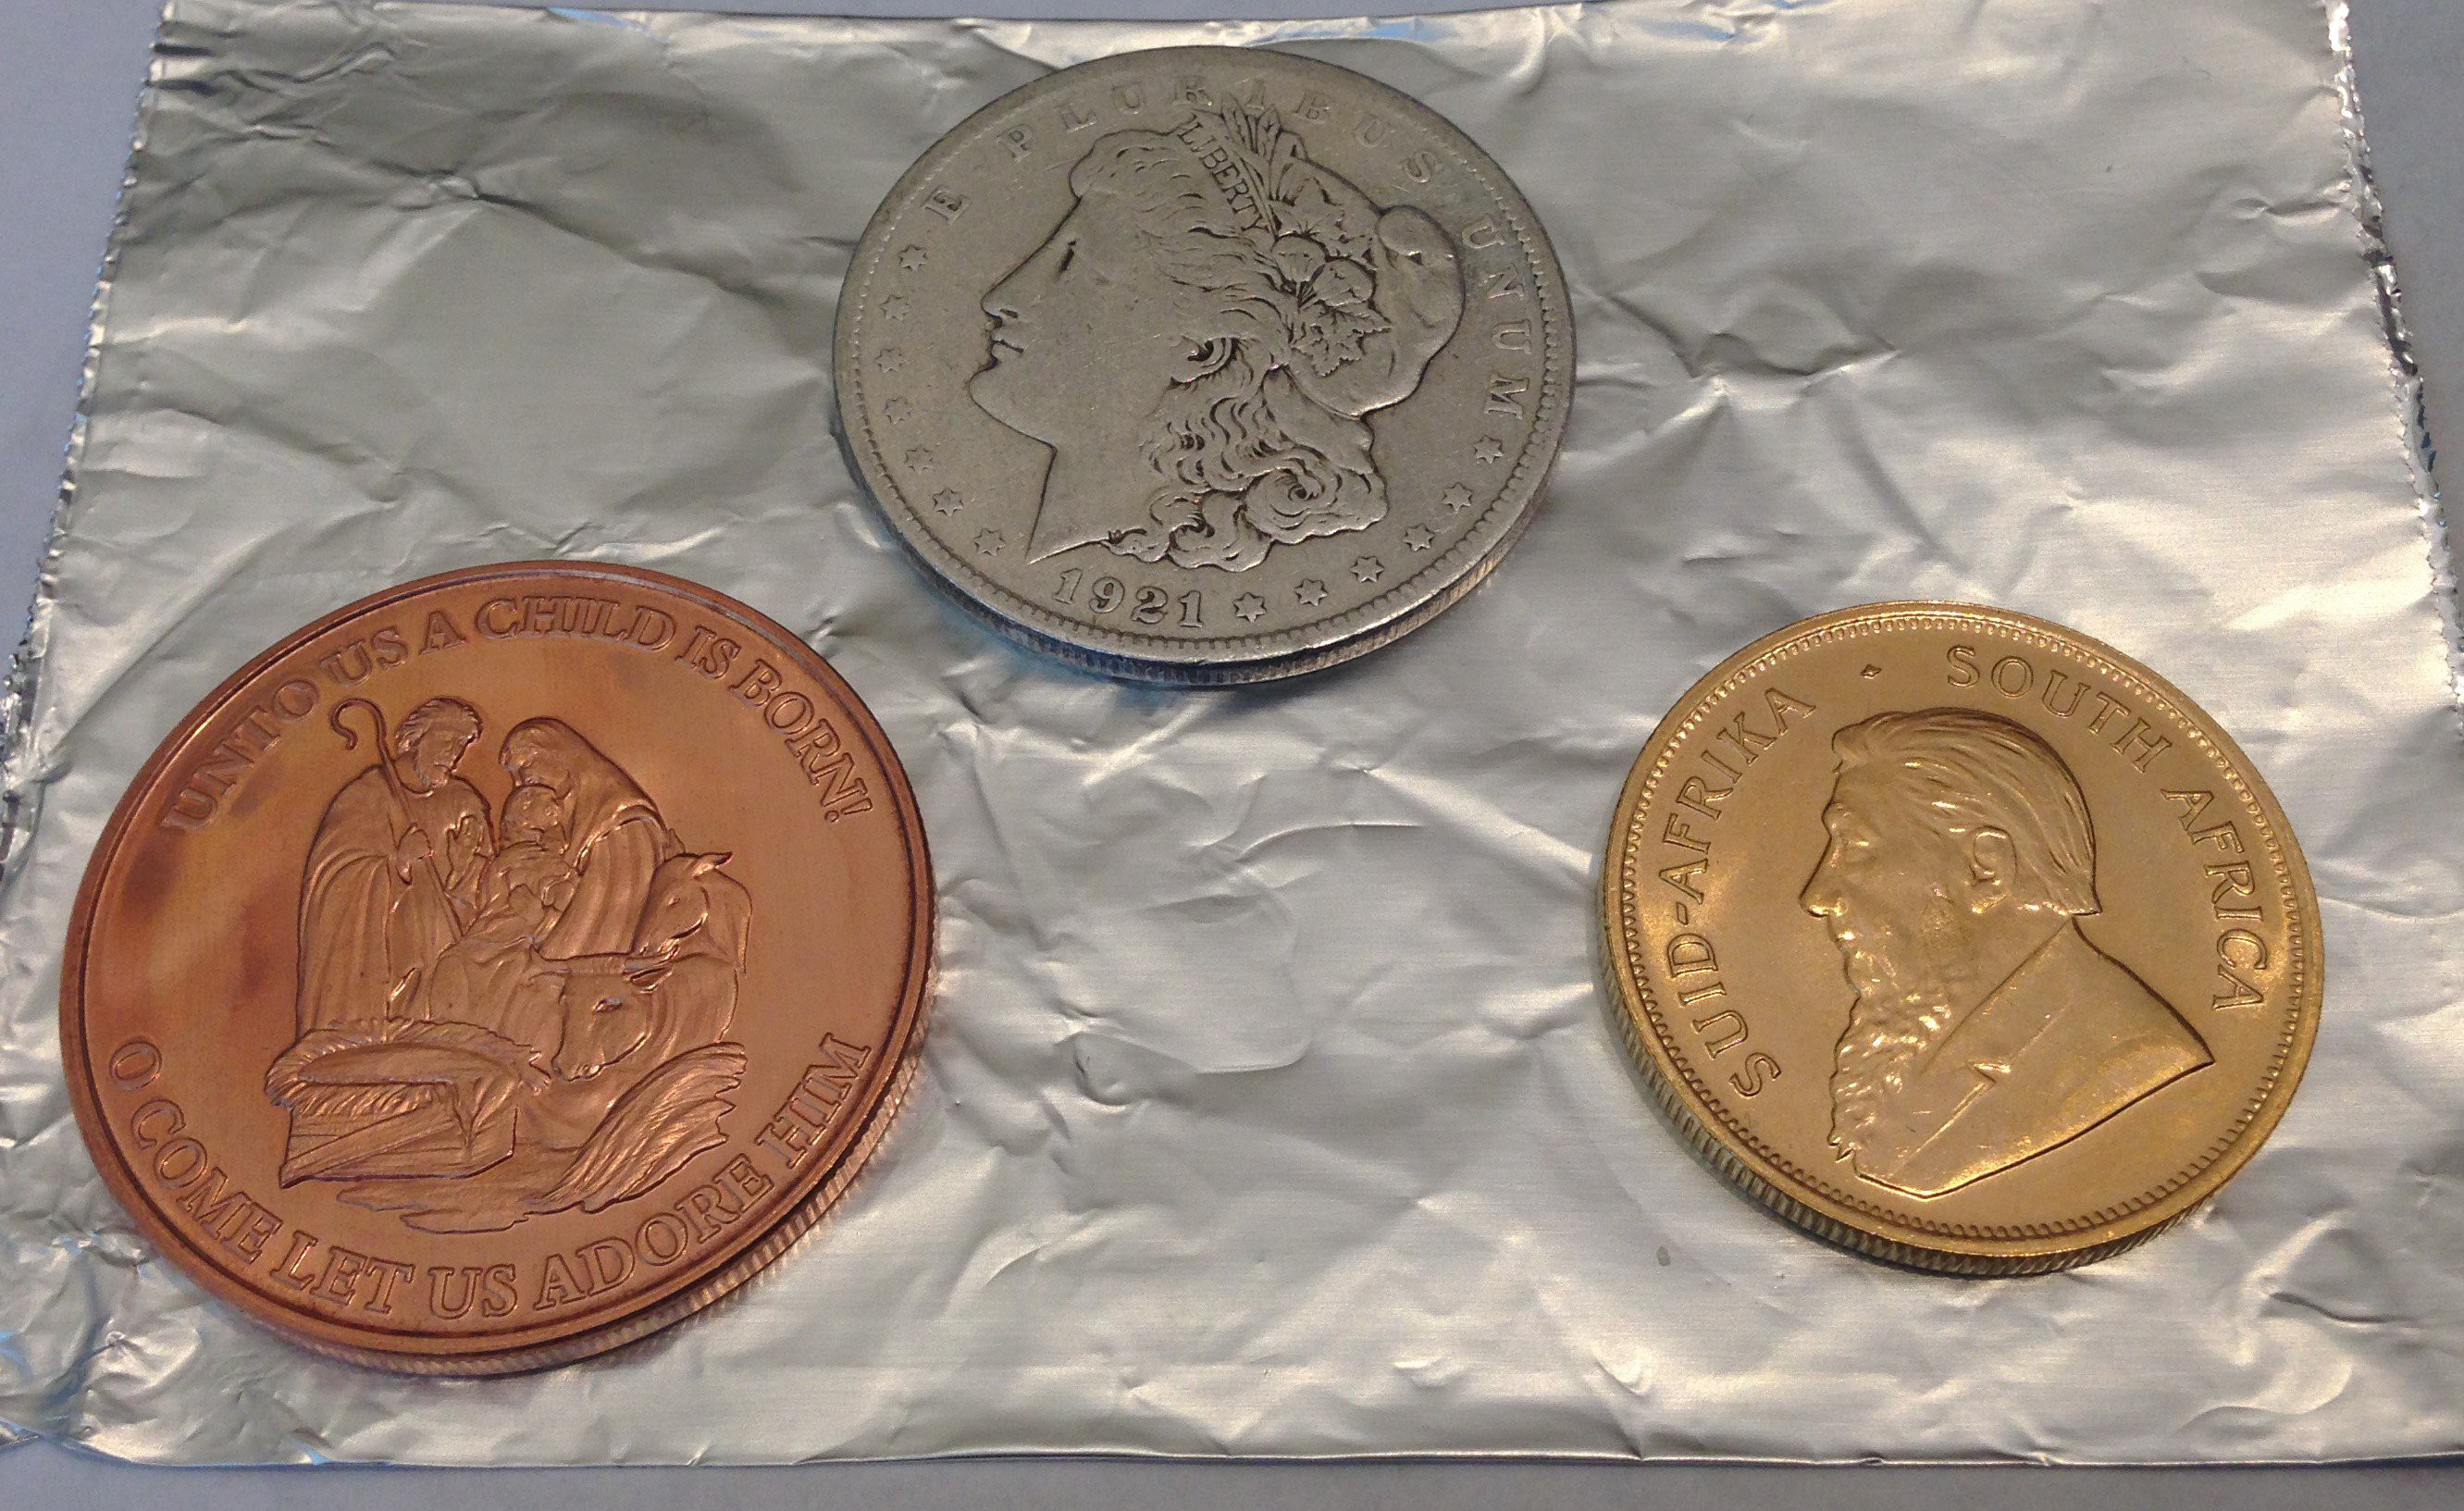
I set the broadband light source to 12.5 mA output (lowest setting), the sensor gain to 16x (default) and the integration time to 100 milliseconds and started taking spectra of the metal objects pictured below:
![]()
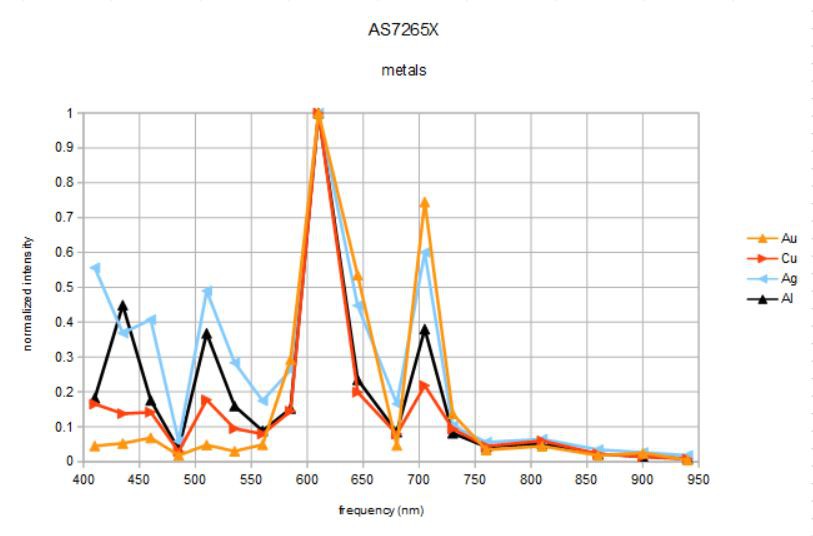
Aluminum foil, silver, copper, and gold (really 91.67% Au/8.33%Cu) coins. I held the spectrometer about 2 cm from each coin face and captured one set of data for each to the spreadsheet. I normalized the four individual spectra to one (they all had peaks at 610 nm).
![]()
The first thing to notice is that beyond 750 nm or so there is no signal. This is because the broadband source is more or less extinguished above this frequency. I need to find a broadband source centered at about 850 nm...
Next, I haven't done any kind of subtraction. The data are not raw data but calibrated data, presumably using some sort of calibration coefficients that correct for deviations from a standard set during factory testing. This spectra is the result of using the spectrometer like a hobbyist might; turn it on, point and plot!
What can we learn from this first attempt at "material identification"?
Well, I really mean looking at spectra from similar things and asking if there is anything about the spectra that might be used to distinguish these materials? I think the answer is yes!
For example:
Gold and silver have strong signals at 645 nm that the other two metals lack, and a stronger peak at 705 nm than the other two metals.
Silver has strong reflectance at 410 and 510 nm that gold lacks. In fact, this accounts for the main difference between gold and silver reflectance and how they appear to our eyes.
Silver and aluminum have very similar spectra but silver is bluer and whiter (flatter spectrum).
Copper is dominated by the peak at 610 nm, right at the orange/red color boundary.
Here is what the "textbook" says we should be seeing:
![]()
This is reflectivity, which is a little different, but it makes it clear that the AS7265X spectrum should be affected by the spectral distribution of the broad-band source, and needs to be corrected for best comparison.
If I use the same method on white paper as my reference (I know, not an ideal reflector), this is what I get:
![]()
I am not sure what to make of the peaks at ~900 nm, probably a result of very small counts there and not significant. Now the differences in the data are even more distinct. Gold and silver have several strong peaks at 585, 645, and 705 nm. In addition, silver has a broad blue response completely lacking in gold. Copper has a broad peak between 585 and 610 nm, as does aluminum, but aluminun also has significant blue and green components with strong peaks at 435 and 510 nm that copper and gold lack. Aluminum and especially silver have the flattest spectra, meaning they appear the most white.
So, assuming such results are typical (TBD, of course) could one devise a simple algorithm to distinguish between these four metals based on these characteristics? I think maybe yes.
If dominant peaks at 585, 645, and 705 nm, gold or silver.

If also dominant peak at 485 nm, then silver, otherwise gold.

If dominant peaks at 585 and 610 nm, but not 705 nm then either al or copper.

If also dominant peak at 435 nm then aluminum, else copper.
Do the distinctions become clearer with higher intensity illumination, higher gain, longer integration times, or spectral averaging? It will be interesting to find out...
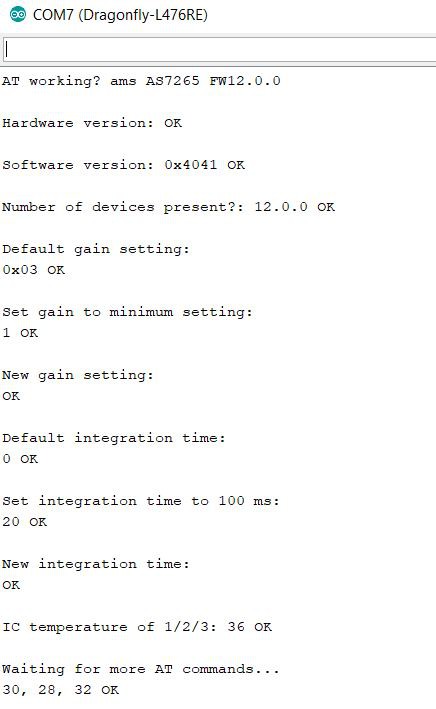
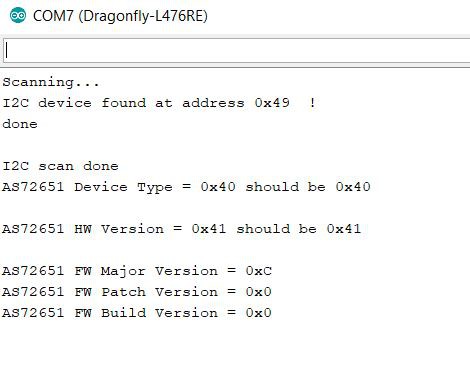
I also verified that by pulling I2C_EN LOW on the board I can no longer see any I2C device(s) on the I2C bus but if I connect SDA/SCL to Serial1 on my Dragonfly Development board I can use UART mode and AT commands just like before:
![]()
I am getting the same device type 40, and hardware version 41, software version of 12 with Patch and Build zero, even though the pokey serial output delays the output a bit.
This means the current version of the $25 Spectrometer is complete and fully functional and is operating according to design. Whew!
Now I might redesign it to make it even easier to use...
-
SUCCESS!
06/21/2018 at 00:27 • 0 comments20 June 2018
I received the pcbs with the Generation 2 design from OSH Park and finally put one together yesterday. Today I loaded the Generation 2 firmware onto the 4 MByte SPI flash and to my surprise I finally got an I2C ACK and discovered an I2C device at 0x49 just where it ought to be!
Here is the new board in action:![]()
And below a close up look. I replaced the rgb led with a simple blue one (bottom right corner). Sure enough, before the firmware was loaded it was blinking once a second and after firmware upload to the SPI flash the led stayed on. This is different from the behavior on Generation 1 where the led indicator went off when proper firmware was present. I will assume the "constant on" behavior is normal for Generation 2, but I'll ask AMS. I also didn't bother populating the source 1 & 3 leds, partly because the 850 nm led I was using for one of them before never seemed to work, and also because the broad band source (yellow square thing) is bright enough for initial testing and I don't want to complicate things too much just yet.
![]()
I started working on my I2C sketch for the photospectrometer which will take a while to get right. This is partly because there are 18 channels that have to be managed including the 20 pieces of calibration data and various gain and integration time settings, etc. I have a pretty good start and it's just a matter of slogging through the excel spreadsheet (provided by AMS) with the new I2C commands and learning how to use them to get calibrated spectral data output to the pc. The GUI that came with the evaluation kit was nice and easy to use but I want something that can allow easier plotting and scaling as well as simplified storage and comparison of the data. In other words, I want the total control of a fully functional Arduino sketch that I can tailor to my needs. Here is the output I have obtained so far:
![]()
I am pretty sure version 12 is correct; the zip file I got from AMS was labeled FW_AS7265x_12V0.0. I am not sure what the Patch and Build versions are supposed to be, but at least the results aren't 0xFF anymore!
By the way, I was sent this link today. It is another YouTube video showing a product from LinkSquare that is essentially a spectrometer with nearly the same spectral range as the AS7265X that is able to distinguish between aluminum, silver, gold, copper, and titanium. It does this by measuring the reflectance spectrum and comparing to a library of spectra to identify the likely target. This beautiful device can be yours right now for the low, low price of just $549!
I wonder if the $25 AS7265X Spectrometer can do the same?
Compact, $25 spectrometer
AMS's new AS7265X 3-chip set promises a compact, 18-channel, 20 nm FWMH spectrometer for less than $25