-
Project is not over
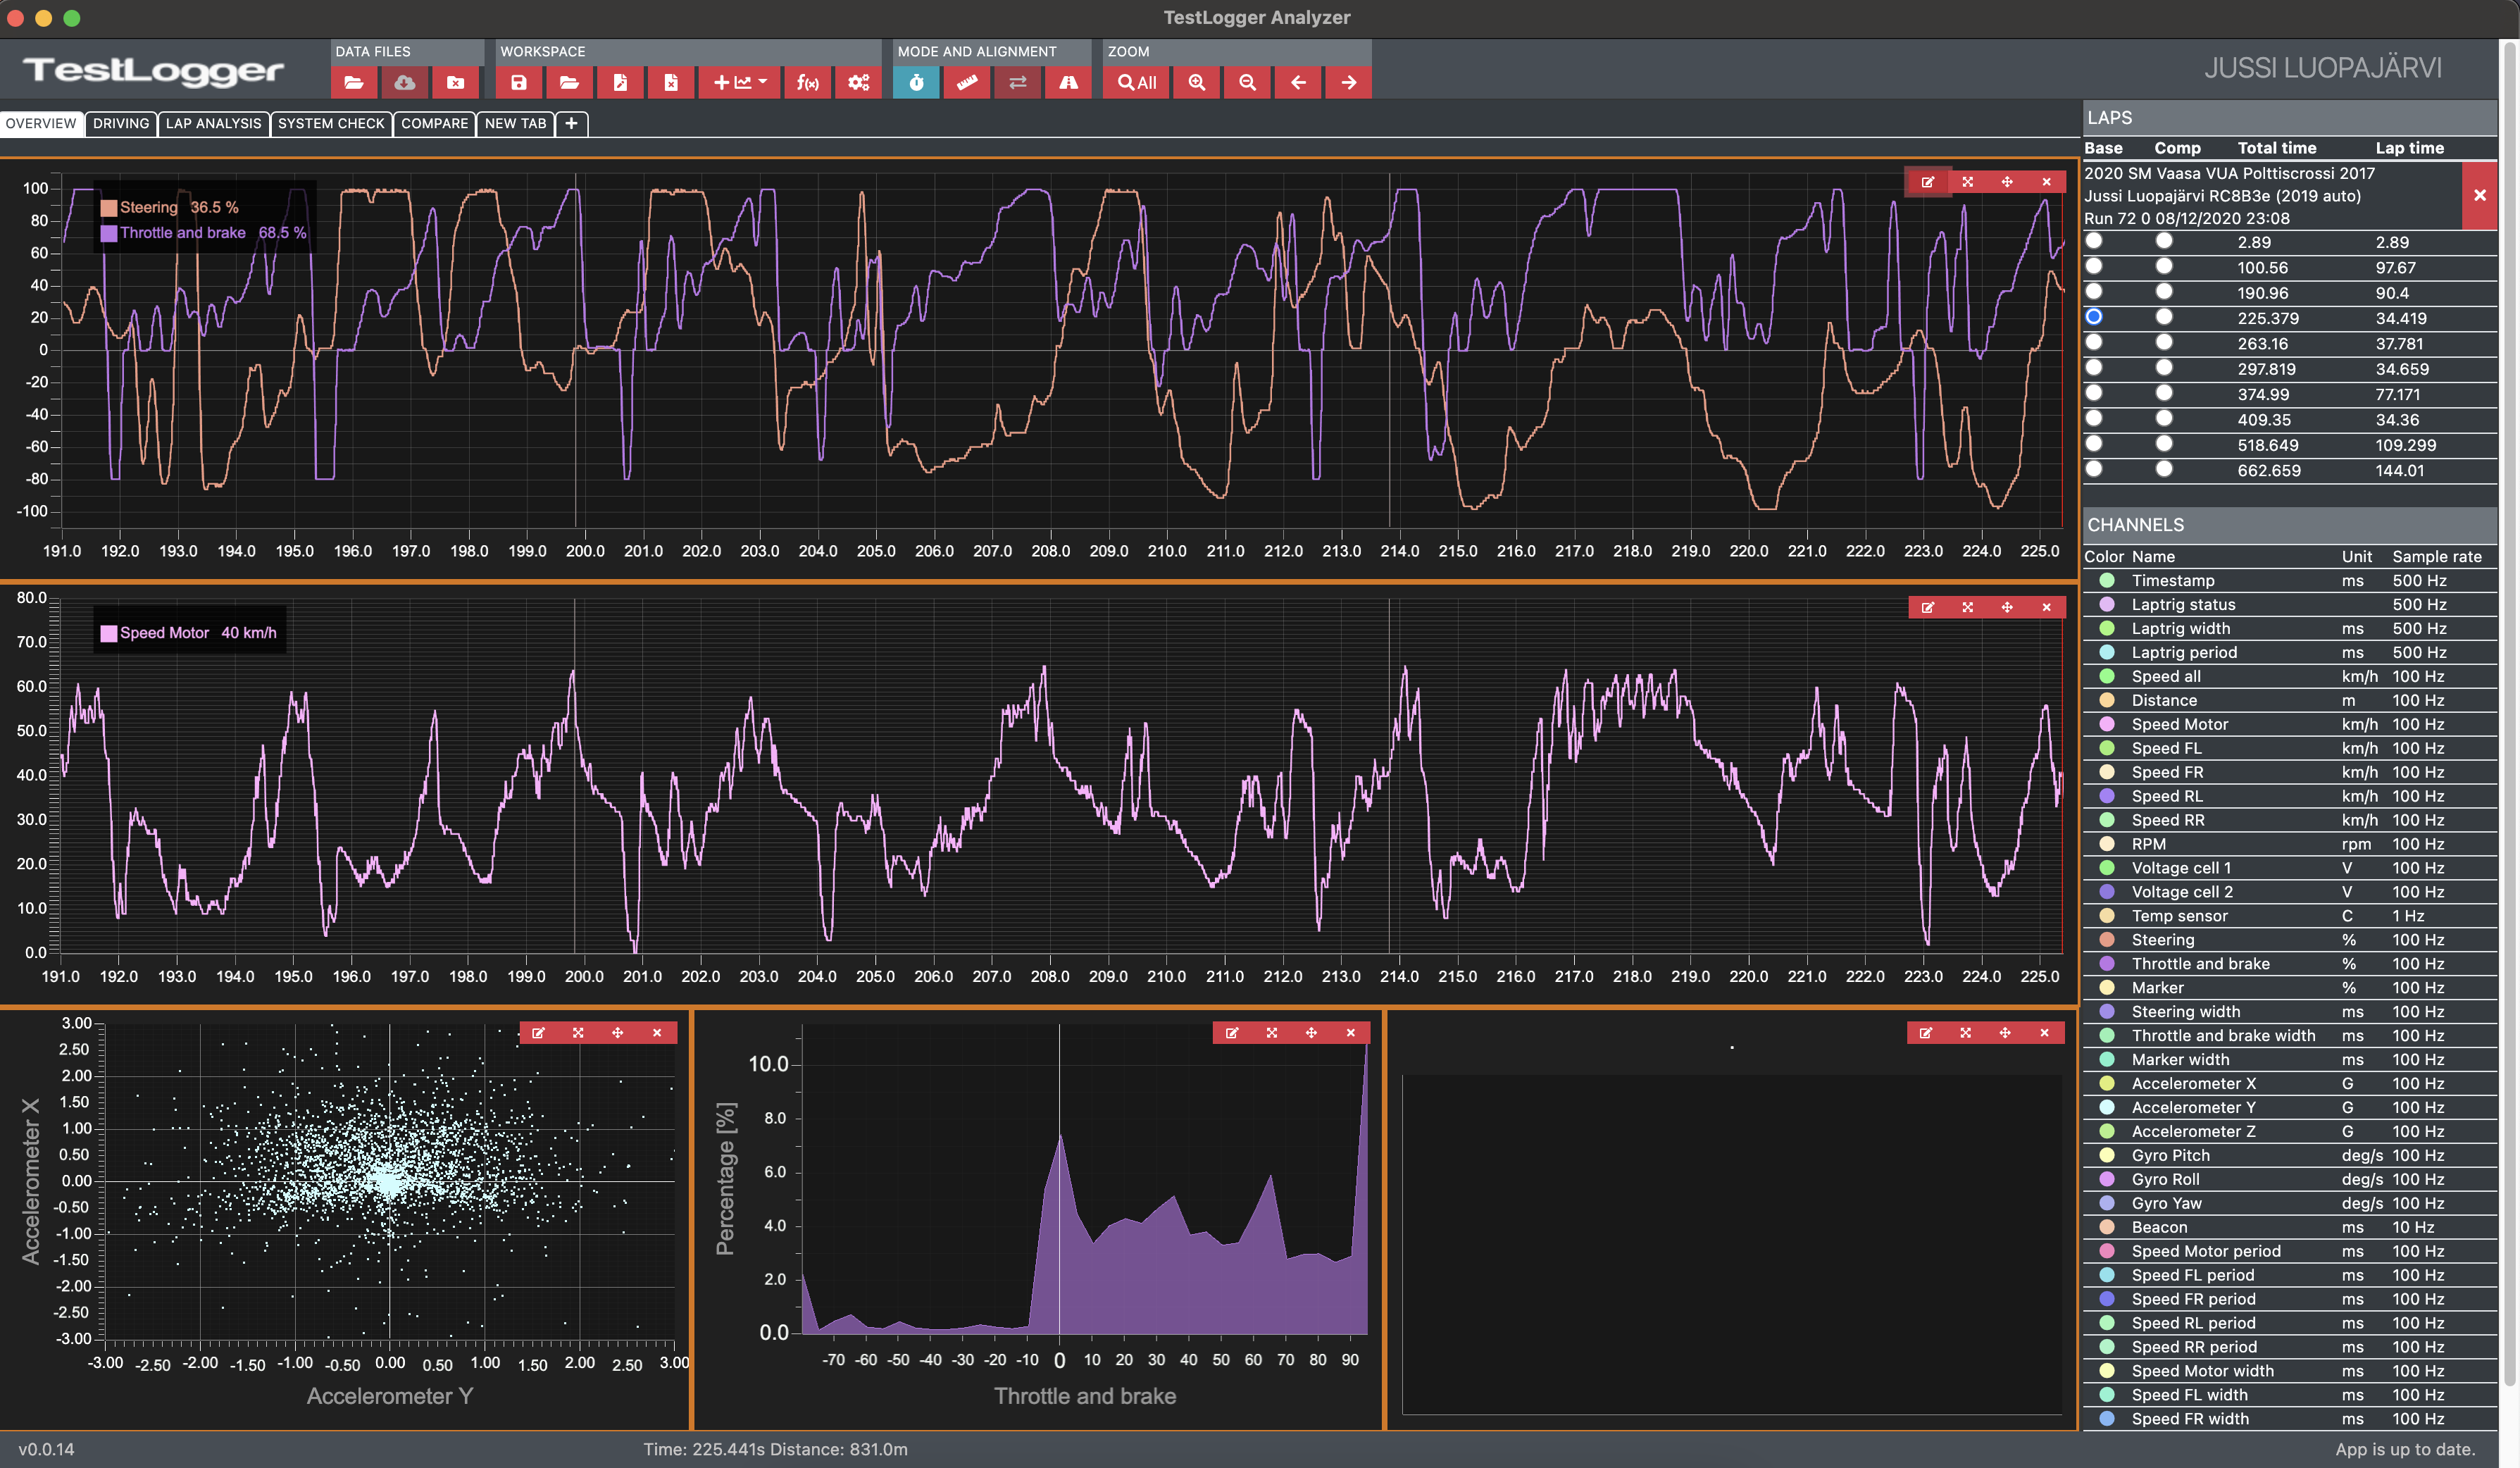
10/22/2020 at 11:19 • 0 commentsLong time without any updates and with same reason as before, just too lazy and busy to write updates. All the time have been used to for developing the system. Maybe the biggest news is that the project has become a bit more serious and target is to make a commercially available product. Best place to follow up the project TestLogger Facebook and Instagram pages.
Basically every single aspect of the project has progressed a lot since last update. HW is redesigned, configuration application is redesigned and most importantly there is our own analysing application available!
I have also designed a custom binary format for the analysing application and that will be open source. About that I will make a post soonish...
![]()
-
Big progress on the background
02/07/2020 at 06:51 • 1 commentFinally I got my act together and write some update about the project. Even though I haven't written any updates, the project has progressed quite much, so here is an overview of the all the components.
Software
The software for desktop has been completely done from scratch to have more functionality, better user experience and to work cross platform. Previously the desktop app was just simple CLI app for Windows.
Because web technologies are close to my heart and from those I have the best understanding (still not good I would say), I decided to give a try for Electron to create the desktop application as it's Node.js based (First time using Node.js) and allows compiling for Mac, Windows and Linux from the same source code. This is a big benefit for me as I'm doing everything by myself.
So far I've had good experience with Electron and only downside has been the large application size (over 100MB). See https://www.electronjs.org for more info. If you quickly need to make simple desktop app, I definitely recommend to have a look. I'm not sure if it is enough for applications where high performance is needed, but looks really good for my use case.
So I made app called Connector which has two main features. First one is the data import from memory card and converting it to Motec i2 or CSV file format. Second feature is the configuration of logger. In the configuration section you can generate the config file via UA but you can also calibrate the device. In other words you connect the device via USB and it sends the current measurement values to the configuration application where you can use the numbers for calibration purposes.
Here is a video how it works.
Analysing too for the data is the tricky part. As mentioned I'm using Motec i2 which I think is a brilliant piece of SW, but no one else can use the file converter except myself. I have now contacted multiple tool vendors and asked if they have any interest to start co-operation with my project. Let's see if that brings any results.
Mean time I've been preparing for the worst which means I need to develop my own analysing tool. Probably I will create some simple prototype with Electron, Vue-grid-layout (see https://github.com/jbaysolutions/vue-grid-layout) and LightningChart (see https://www.arction.com/lightningchart-js/) to see if I could create my own analysing tool. But this is just an idea in my brains for the moment to get something done quickly and probably proper developers would kill me for this idea. Benefit of this would be to have both desktop and web interface for the analysing tool. Of course the possibility to use data either from remote DB or locally generated files. One thing I would like to achieve is easy sharing of data.
---------- more ----------Firmware
As the base of the firmware was copied from the internet with my own additions on top of it, I felt that I needed to rebuild it from scratch. Also the original FW had its flaws. For example I had separate config files for the logger and data processor. Other problems were that you had one logging rate for all channels (not sensible to measure temperature with 2ms logging rate) and it file was in CSV format, which is not good from performance point of view.
So I have completely reworked the FW. It's still based on Chibios (see http://www.chibios.org) as I have now started to learn the way it works and the performance is good. Architecture of the FW is my own and of course still evolving when the time goes on. The main highlights are as follows.
- Only one configuration file for initiating the logger and processing the data files
- USB serial communication to enable easier configuration from desktop application. See SW section of this post
- Each channel can be configured separately instead of hard coding. For example logging rate, amount of decimals, channel name and measurement unit can be defined. The video above shows the things what can be configured.
- Data is written in binary format
I still have some challenges to sort out and mainly these are related how to handle the USB connection and config files. Also the FW doesn't handle error situations very well.
Data is written in binary format and I made a simple format how to write the data to SD card. Each measured sample is own package where the package size is 8 bytes. First four bytes includes header, channel id and data length. Last four bytes includes the data in integer format.
Hardware
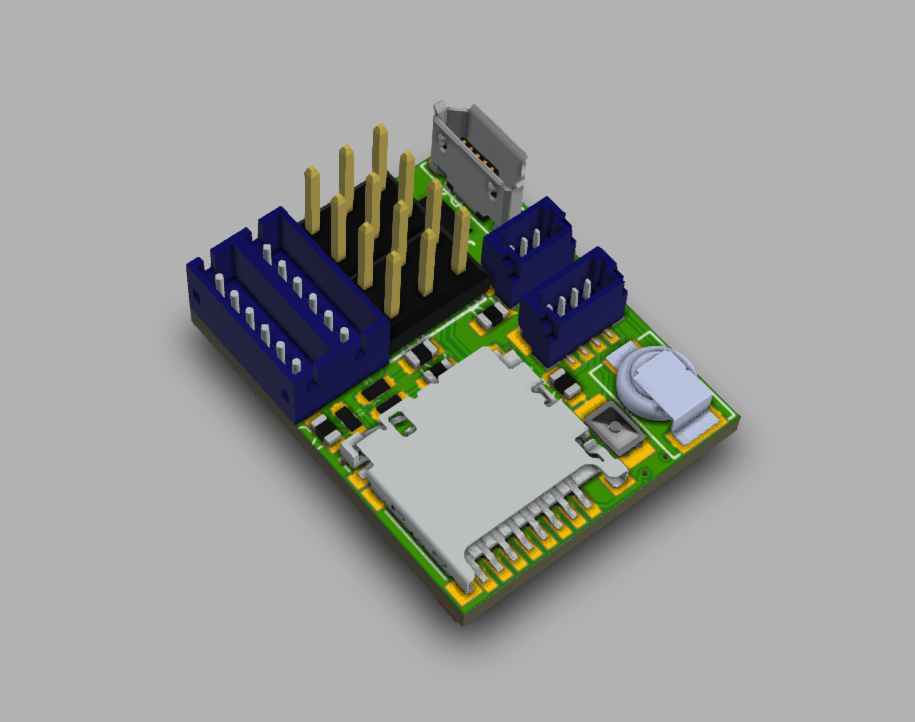
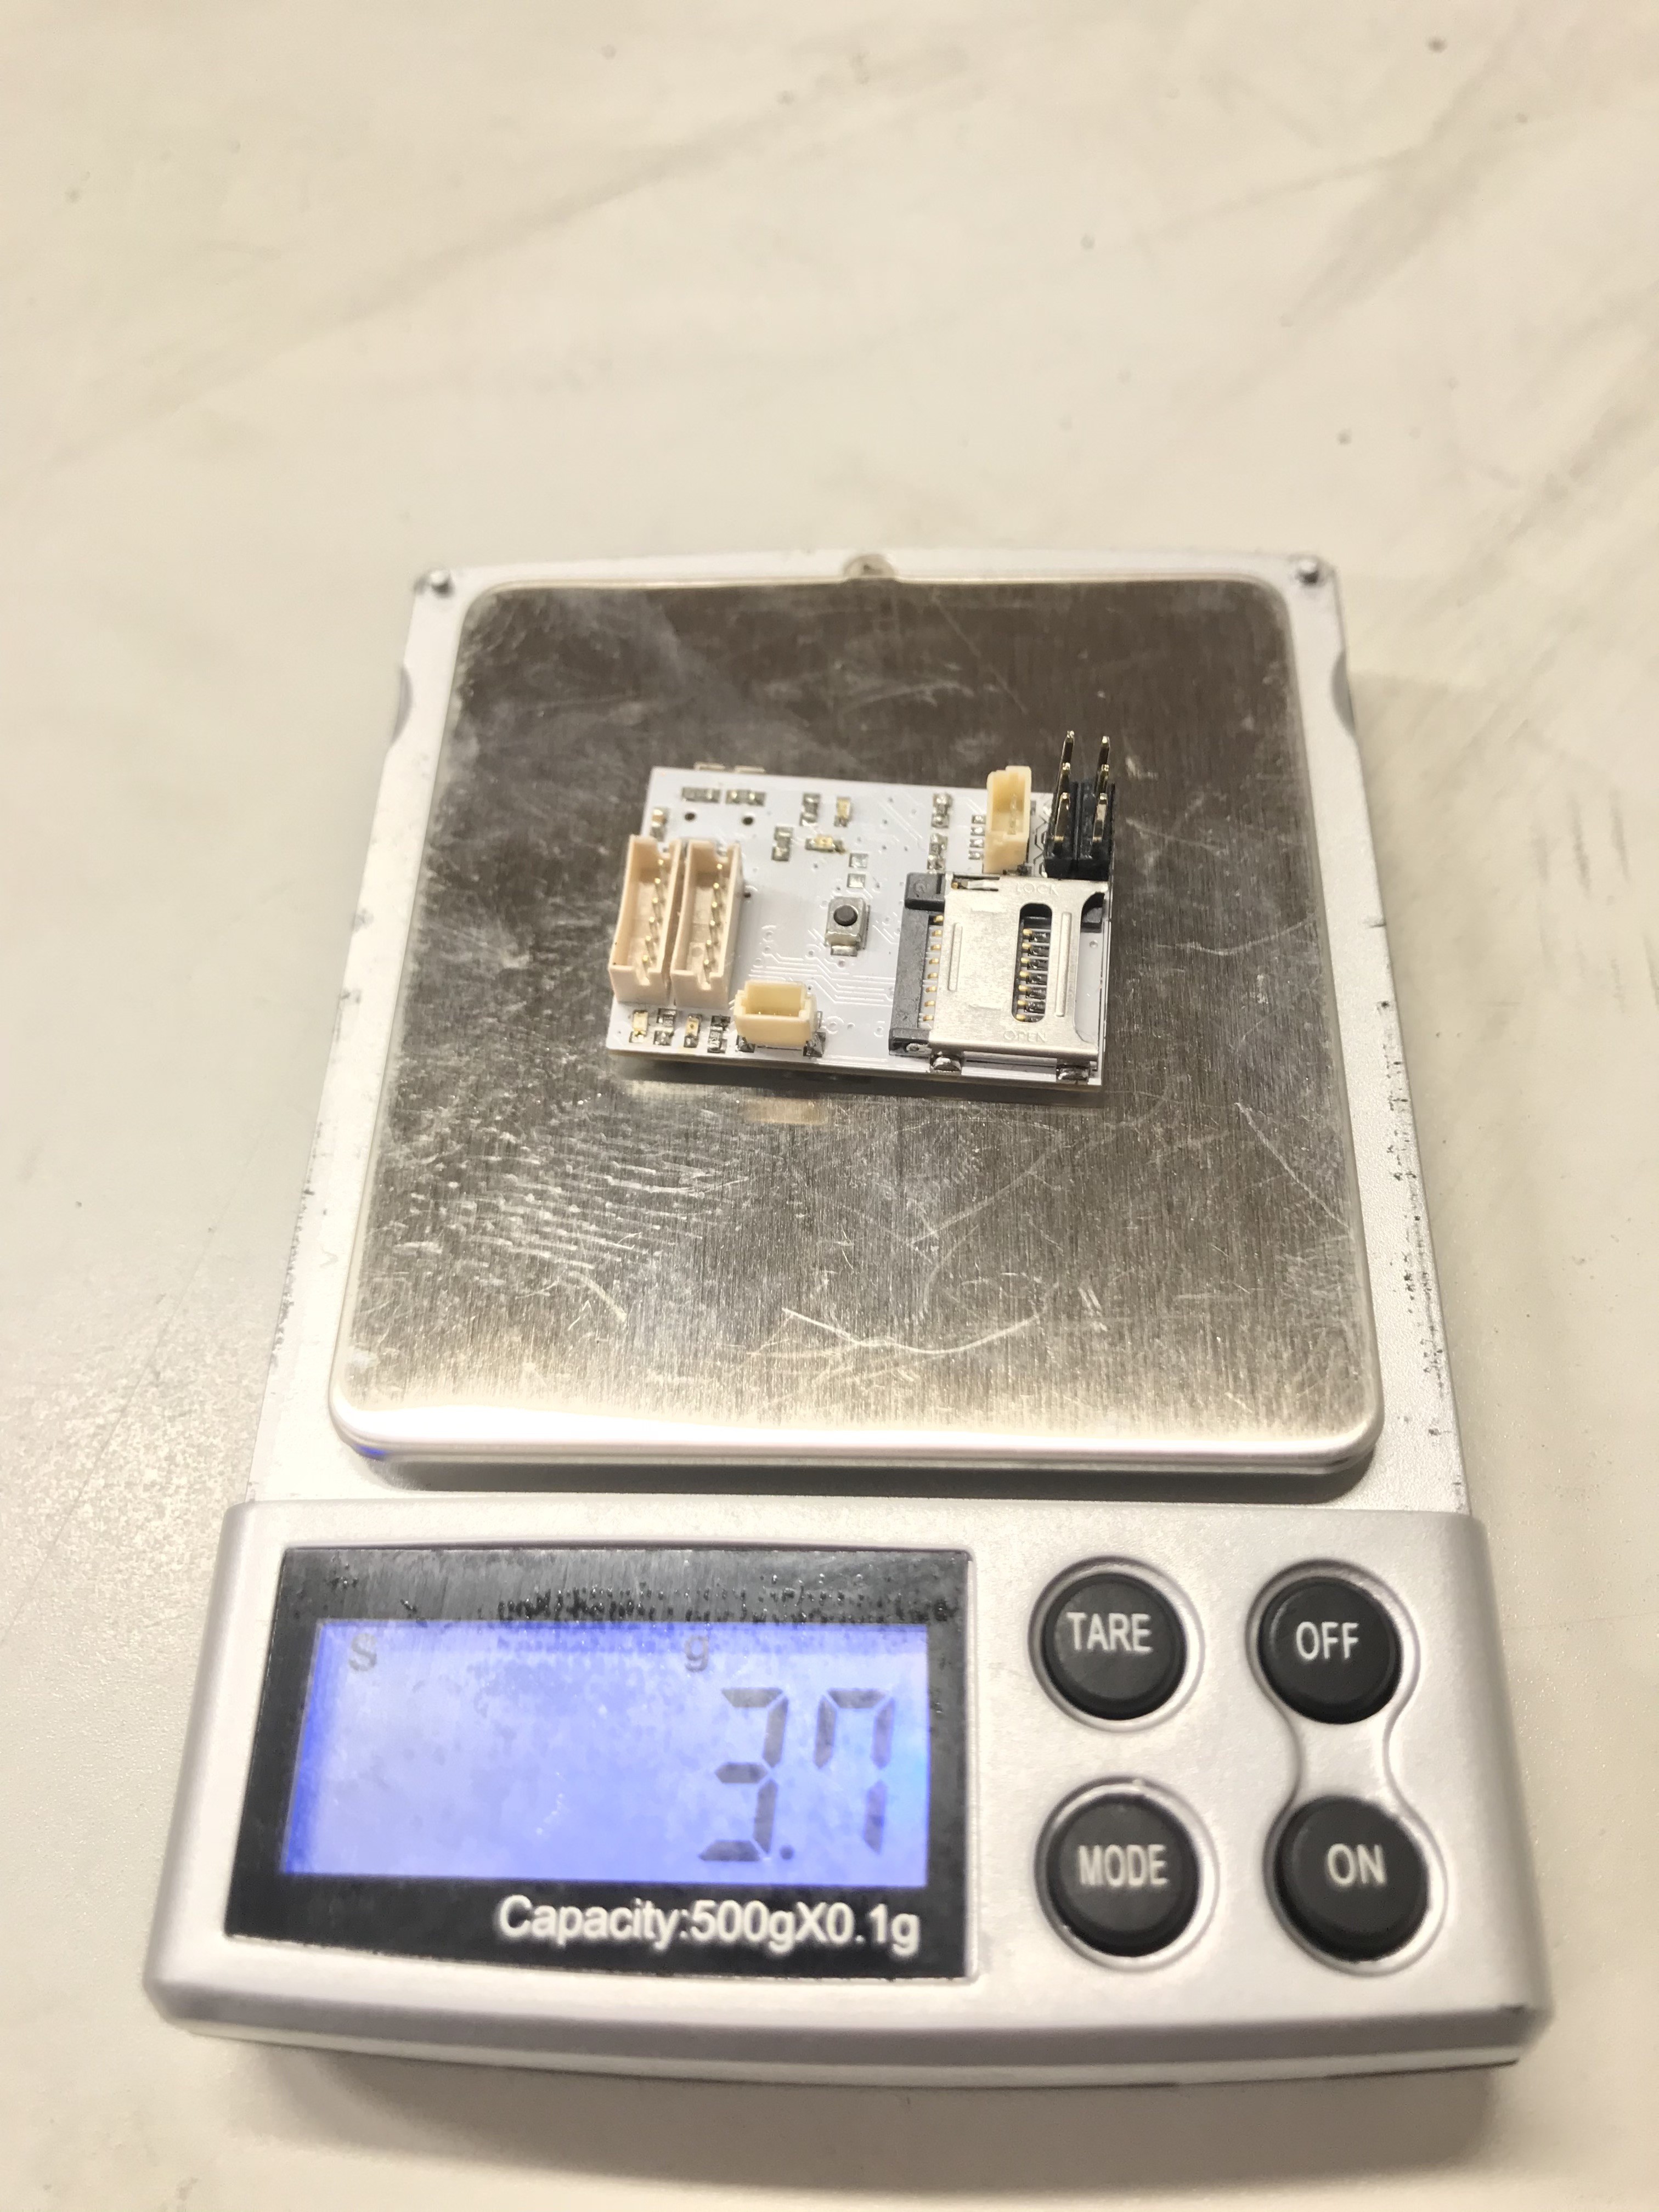
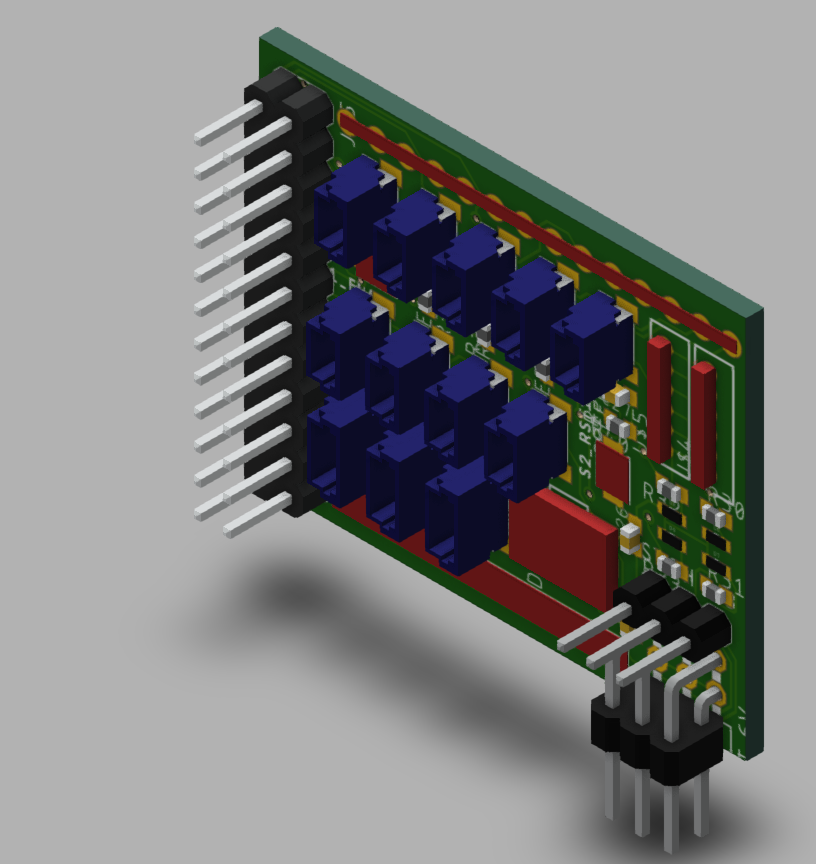
So there is two different versions from the logger which are Mini and Full. Mini was completely redesigned at the end of last year. Main target was to minimise the footprint and still to have necessary channels to analyse driver behaviour. Assembled PCB weighs only 4.5 gramms and foot print is 21 x 26mm. It is logging steering, throttle, laptimes, motor RPM, G forces and angular speeds.
All the sensors are now modular. In other words this means that logging unit has JST-SH connectors for all external sensors and similar connector can be found from the sensor side. This allows to change the connecting wire very easily depending on the car used and needed cable length. it's easier to keep the wiring neat and tidy without making custom wiring looms for each car model.
But in general the hardware starts to be pretty stable and it's only minor tweaks and improvements I have done lately. More development would be needed on device cases and sensor brackets.
![]()
That's all for this time, thanks for reading the update :)
-
IR Beacon and laptimes
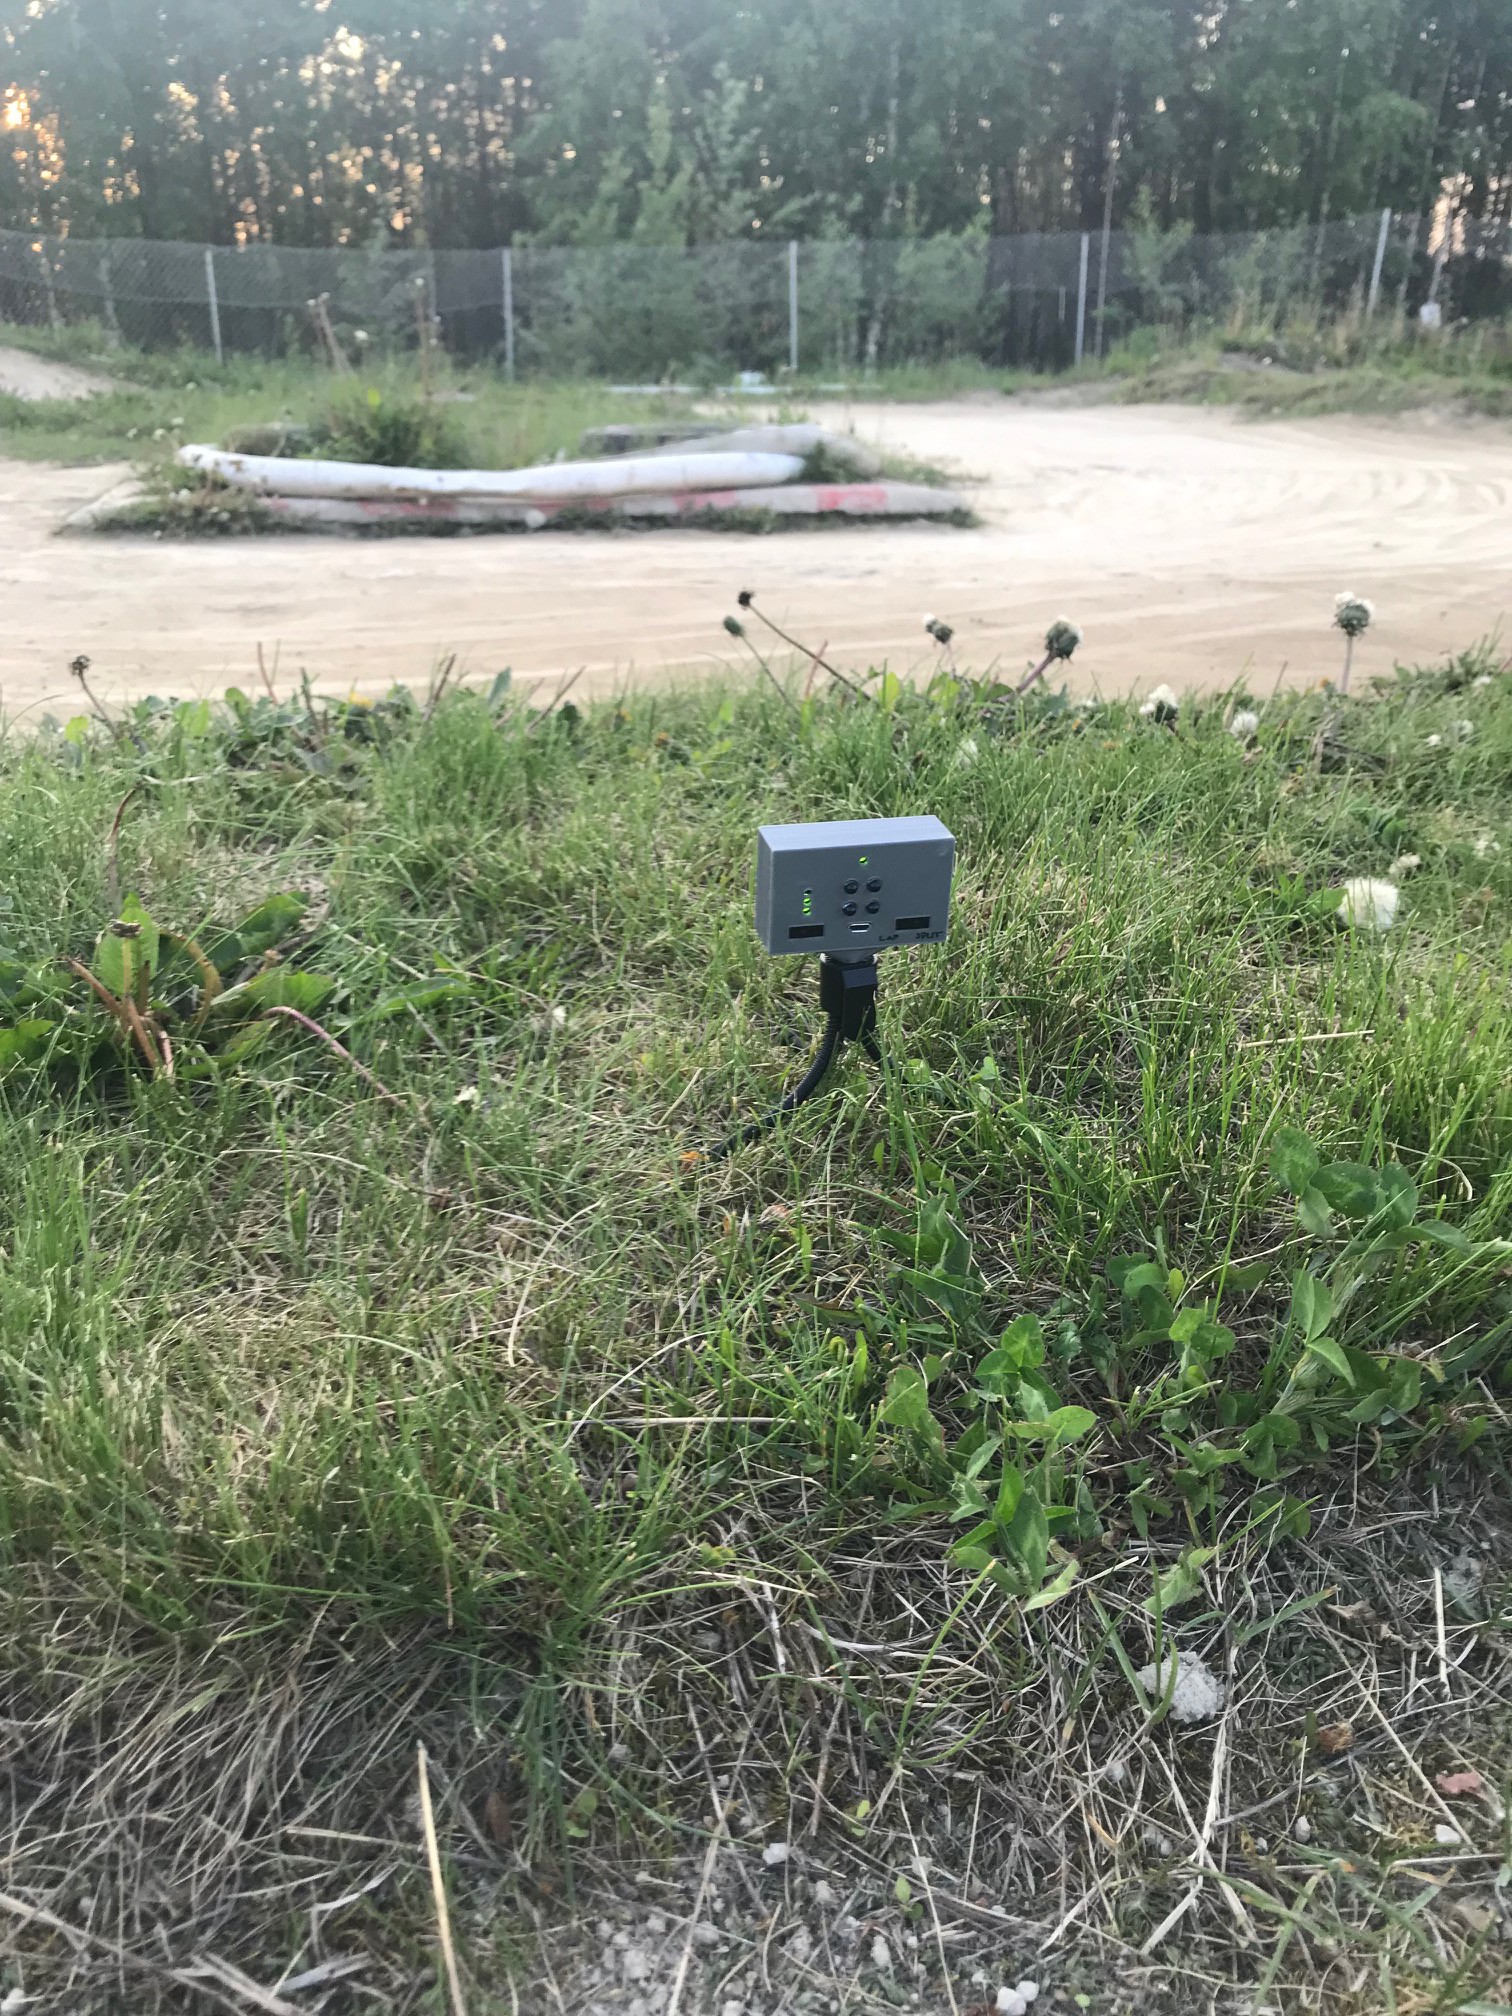
05/05/2019 at 19:50 • 0 commentsLaptimes is a key element when analysing performance and in this case these are generated with a help of IR beacon(s). Generating laptimes can be achieved with one beacon and by adding one or more beacons it’s possible to generate split times.
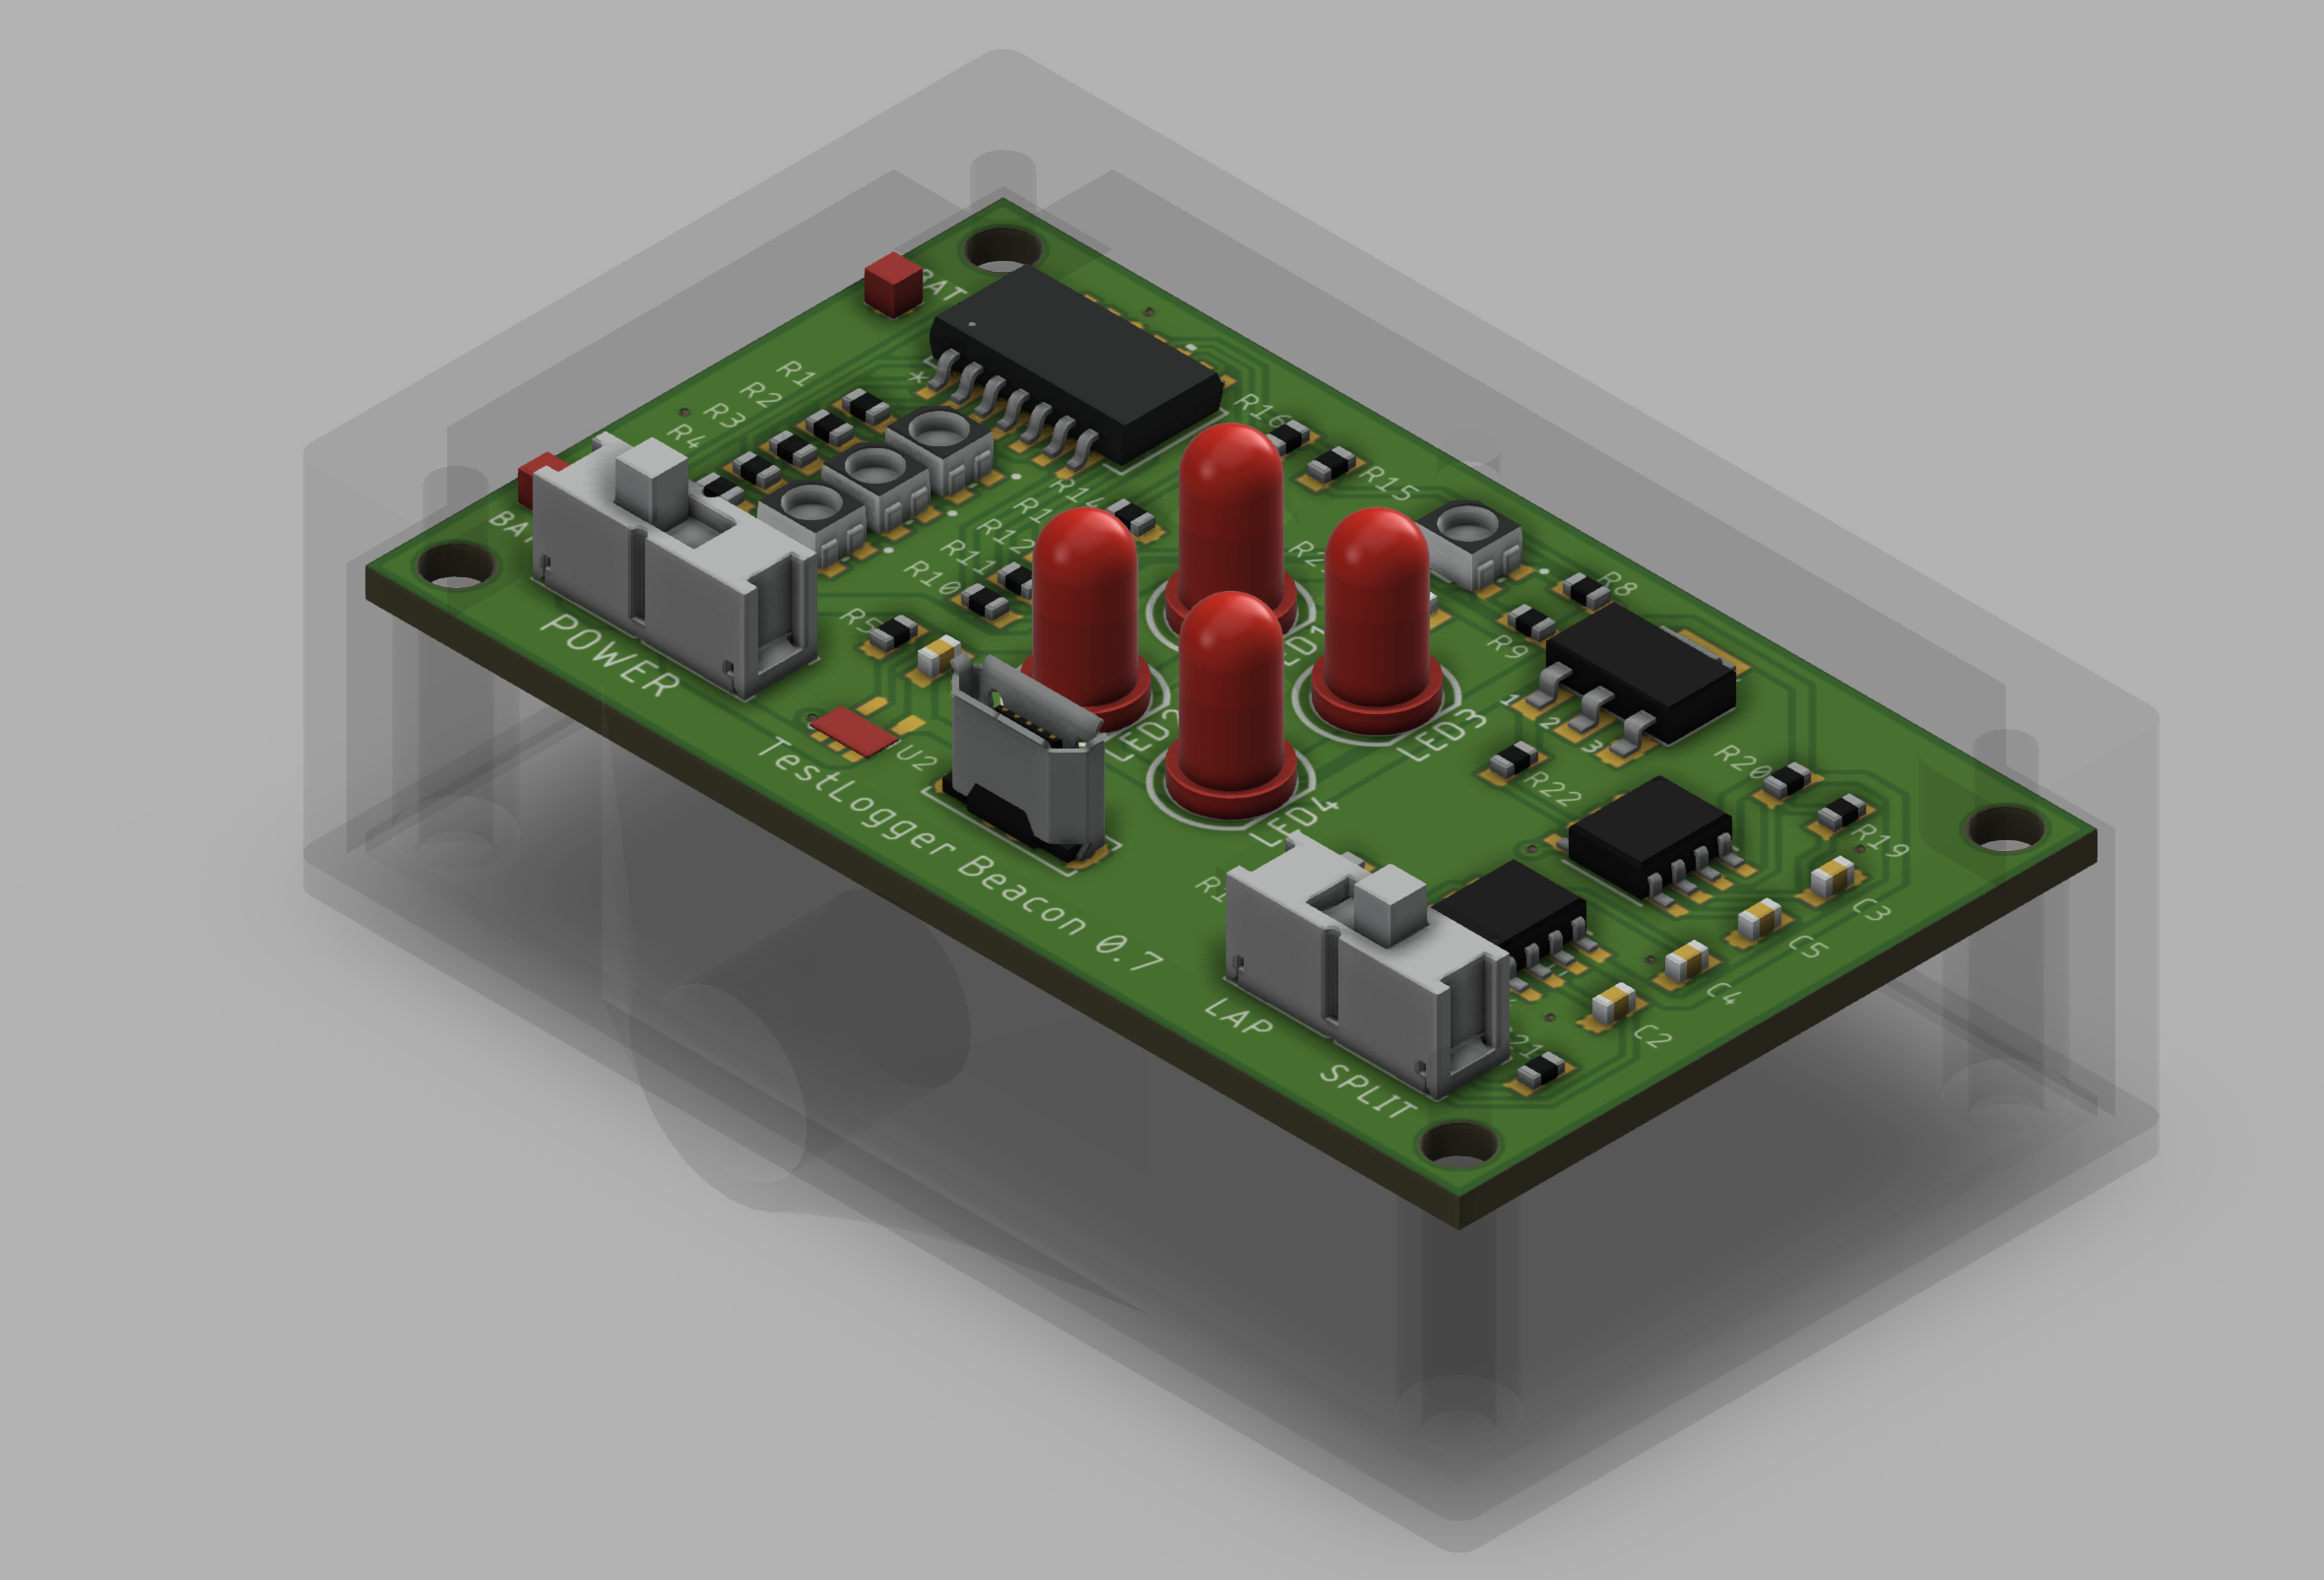
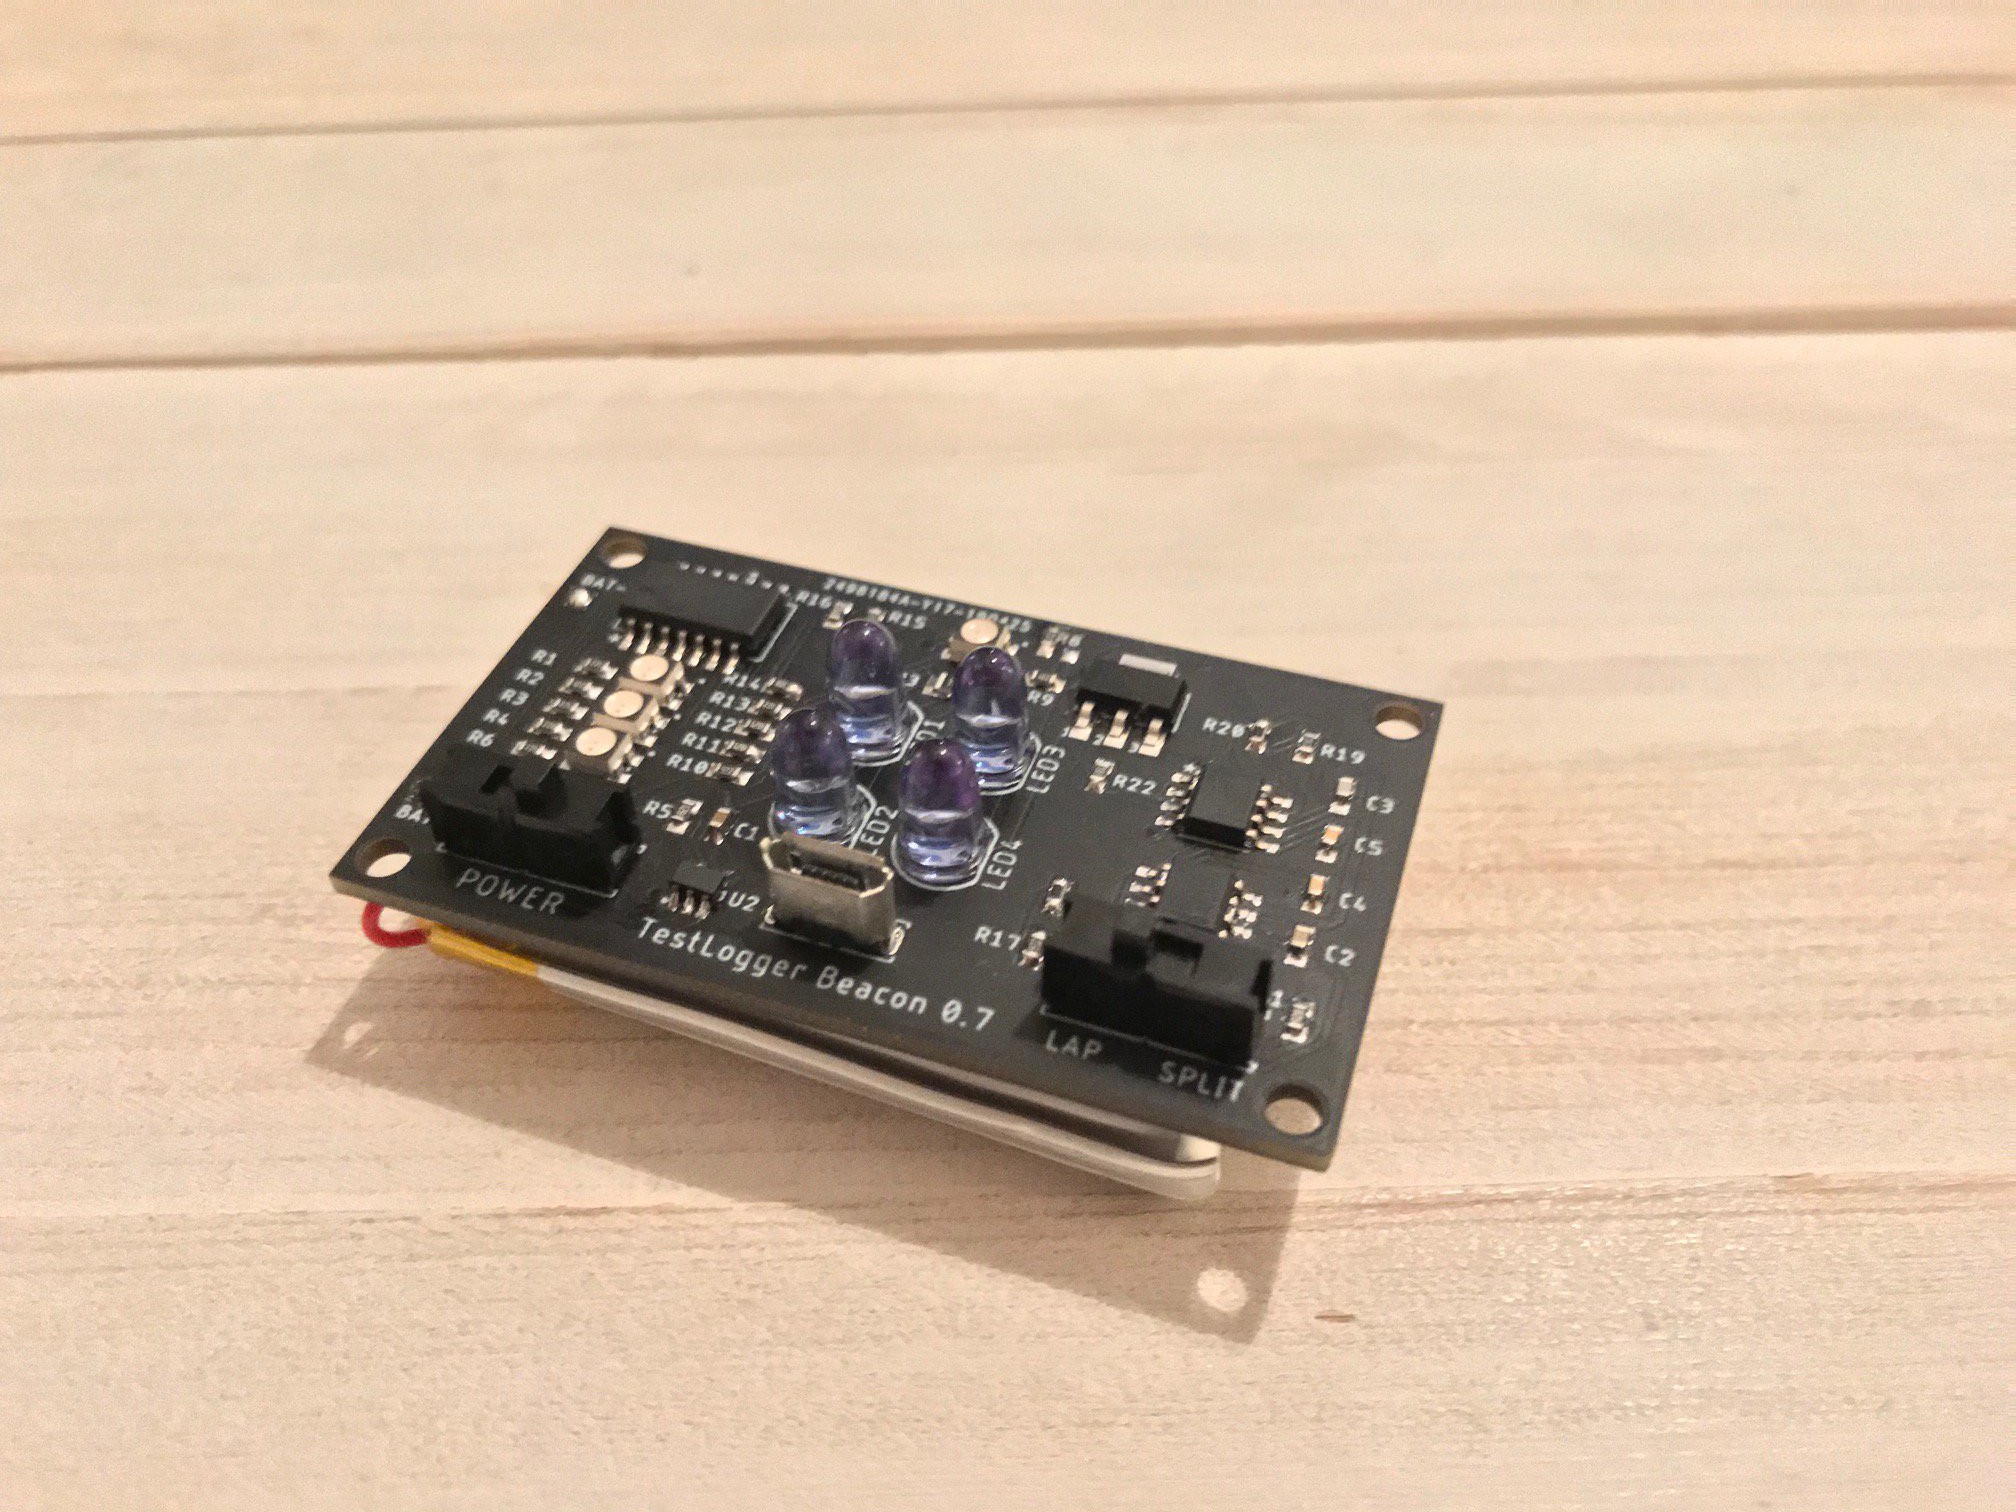
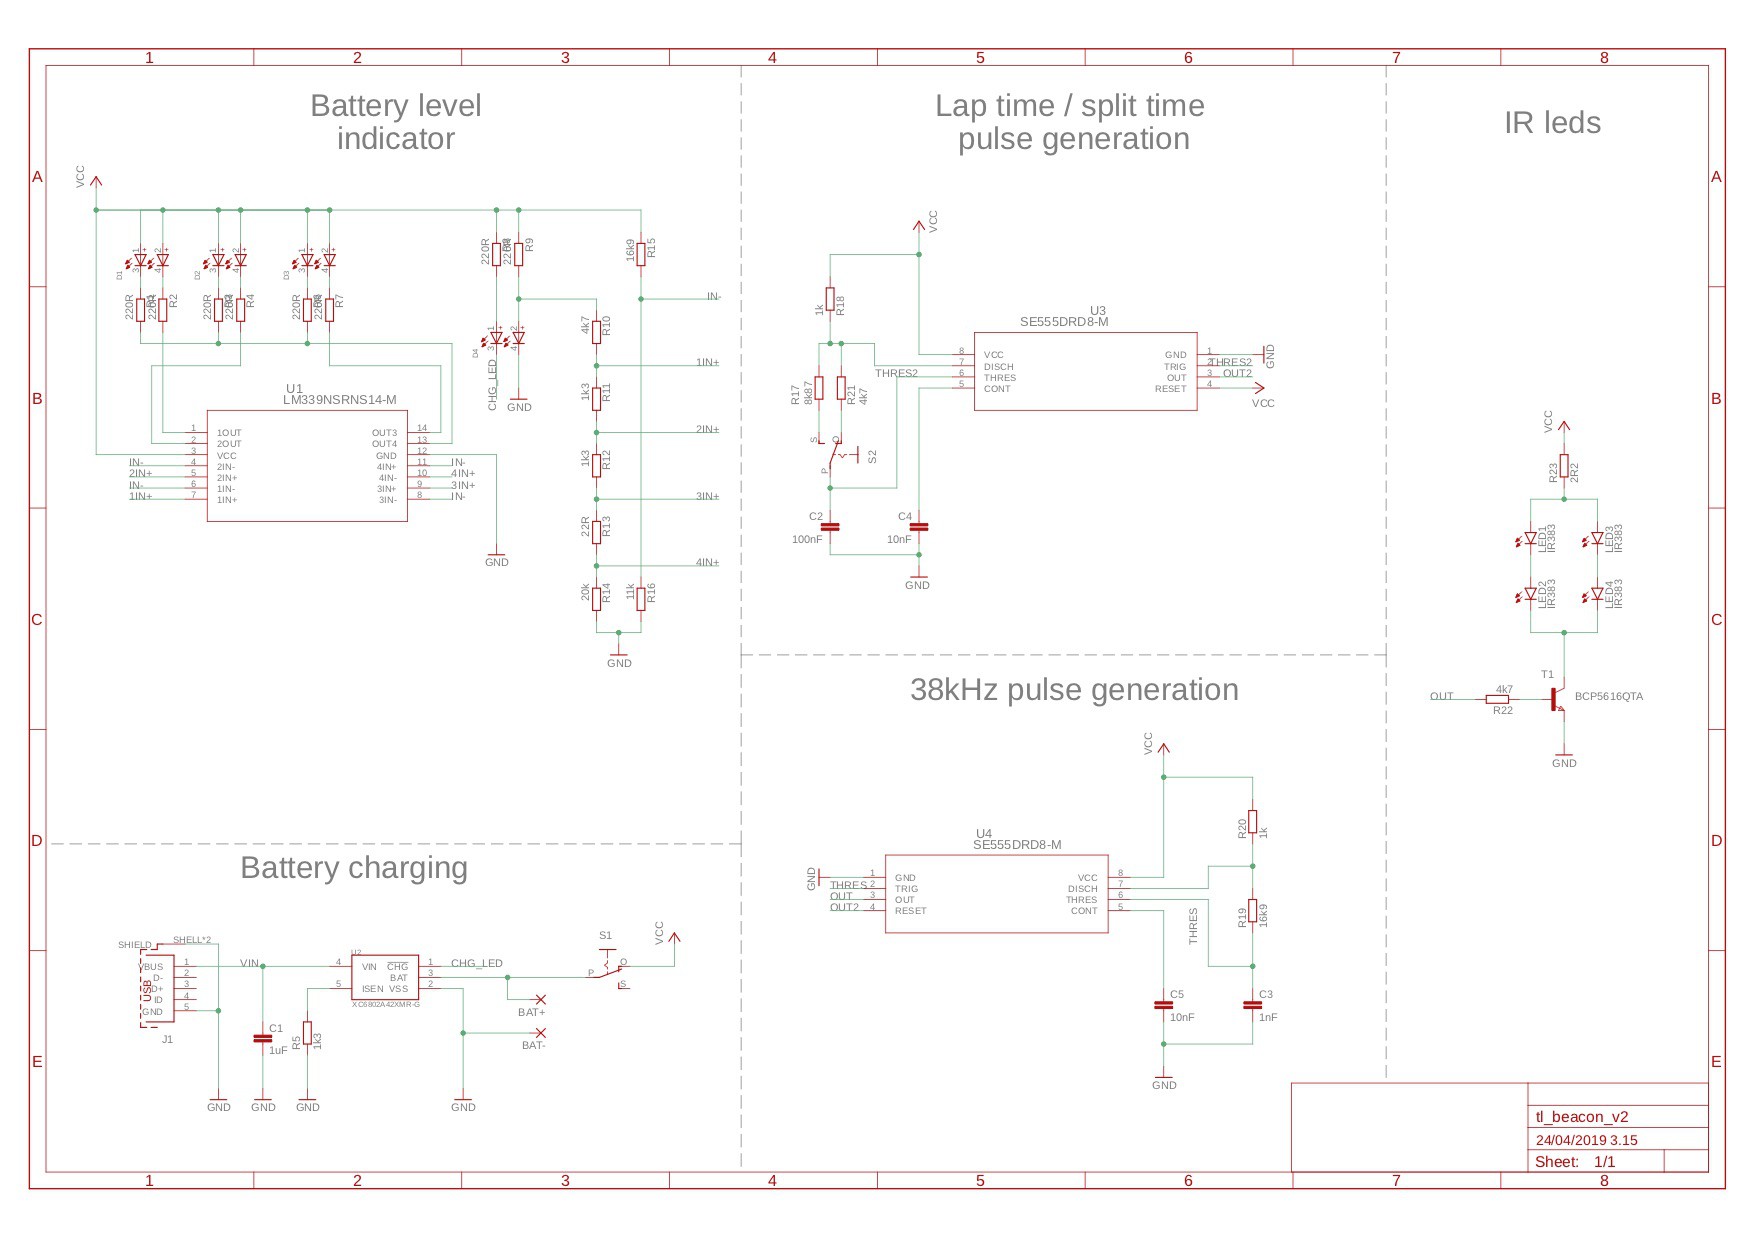
Beacon sends 38 kHz infrared signal on selected pulse length which is then received in the car and logger triggers the lap indicator. Beacon has a switch where the 38kHz pulse length can be changed and this is used to identify if beacon signal is main laptime or split time.
Beacon also has a lithium based battery which has 2000mAh capacity and nicely fits behind the PCB. To control the battery, there is also battery charging circuit where charging done via micro USB. Battery level indicator is built with four input comparator and bi-colour leds.
![]() ---------- more ----------
---------- more ----------![]()
![]()
Operation principle
The 38kHz signal with around 50% duty cycle is generated with 555 timer and second 555 timer is used to control how long the 38kHz signal is transmitted and how long it is paused. This is done for IR receiver to reocognize different pulse lenghts. IR leds are controlled via NPN transistor as 555 timer don’t have that much capacity to pass current from the output. IR383 were selected for use and reasons were narrow transmission angle (20 degrees), wavelength (940nm) and max current level (peak forward current 1A).
Currently I'm using 1R resistor in front of the IR leds and take drains the battery in around 3 to 4 hours and to be honest the transmitting power is maybe even too much. So try with 2R2 and see how that works.
![]()
Battery charging and charge status
Battery charging has nothing special built. Just used XC6802A42XMR-G with a reference design from the data sheet.
Battery level indication is done with LM339NSR and I used this article as a base https://www.instructables.com/id/Li-Ion-battery-level-indicator/. I have just adjusted the resistor values to my needs and last step is done inverse as I wanted to turn on red LED's when voltage below threshold. I created a excel sheet where I calculated the suitable resistor values.
How does it show in data?
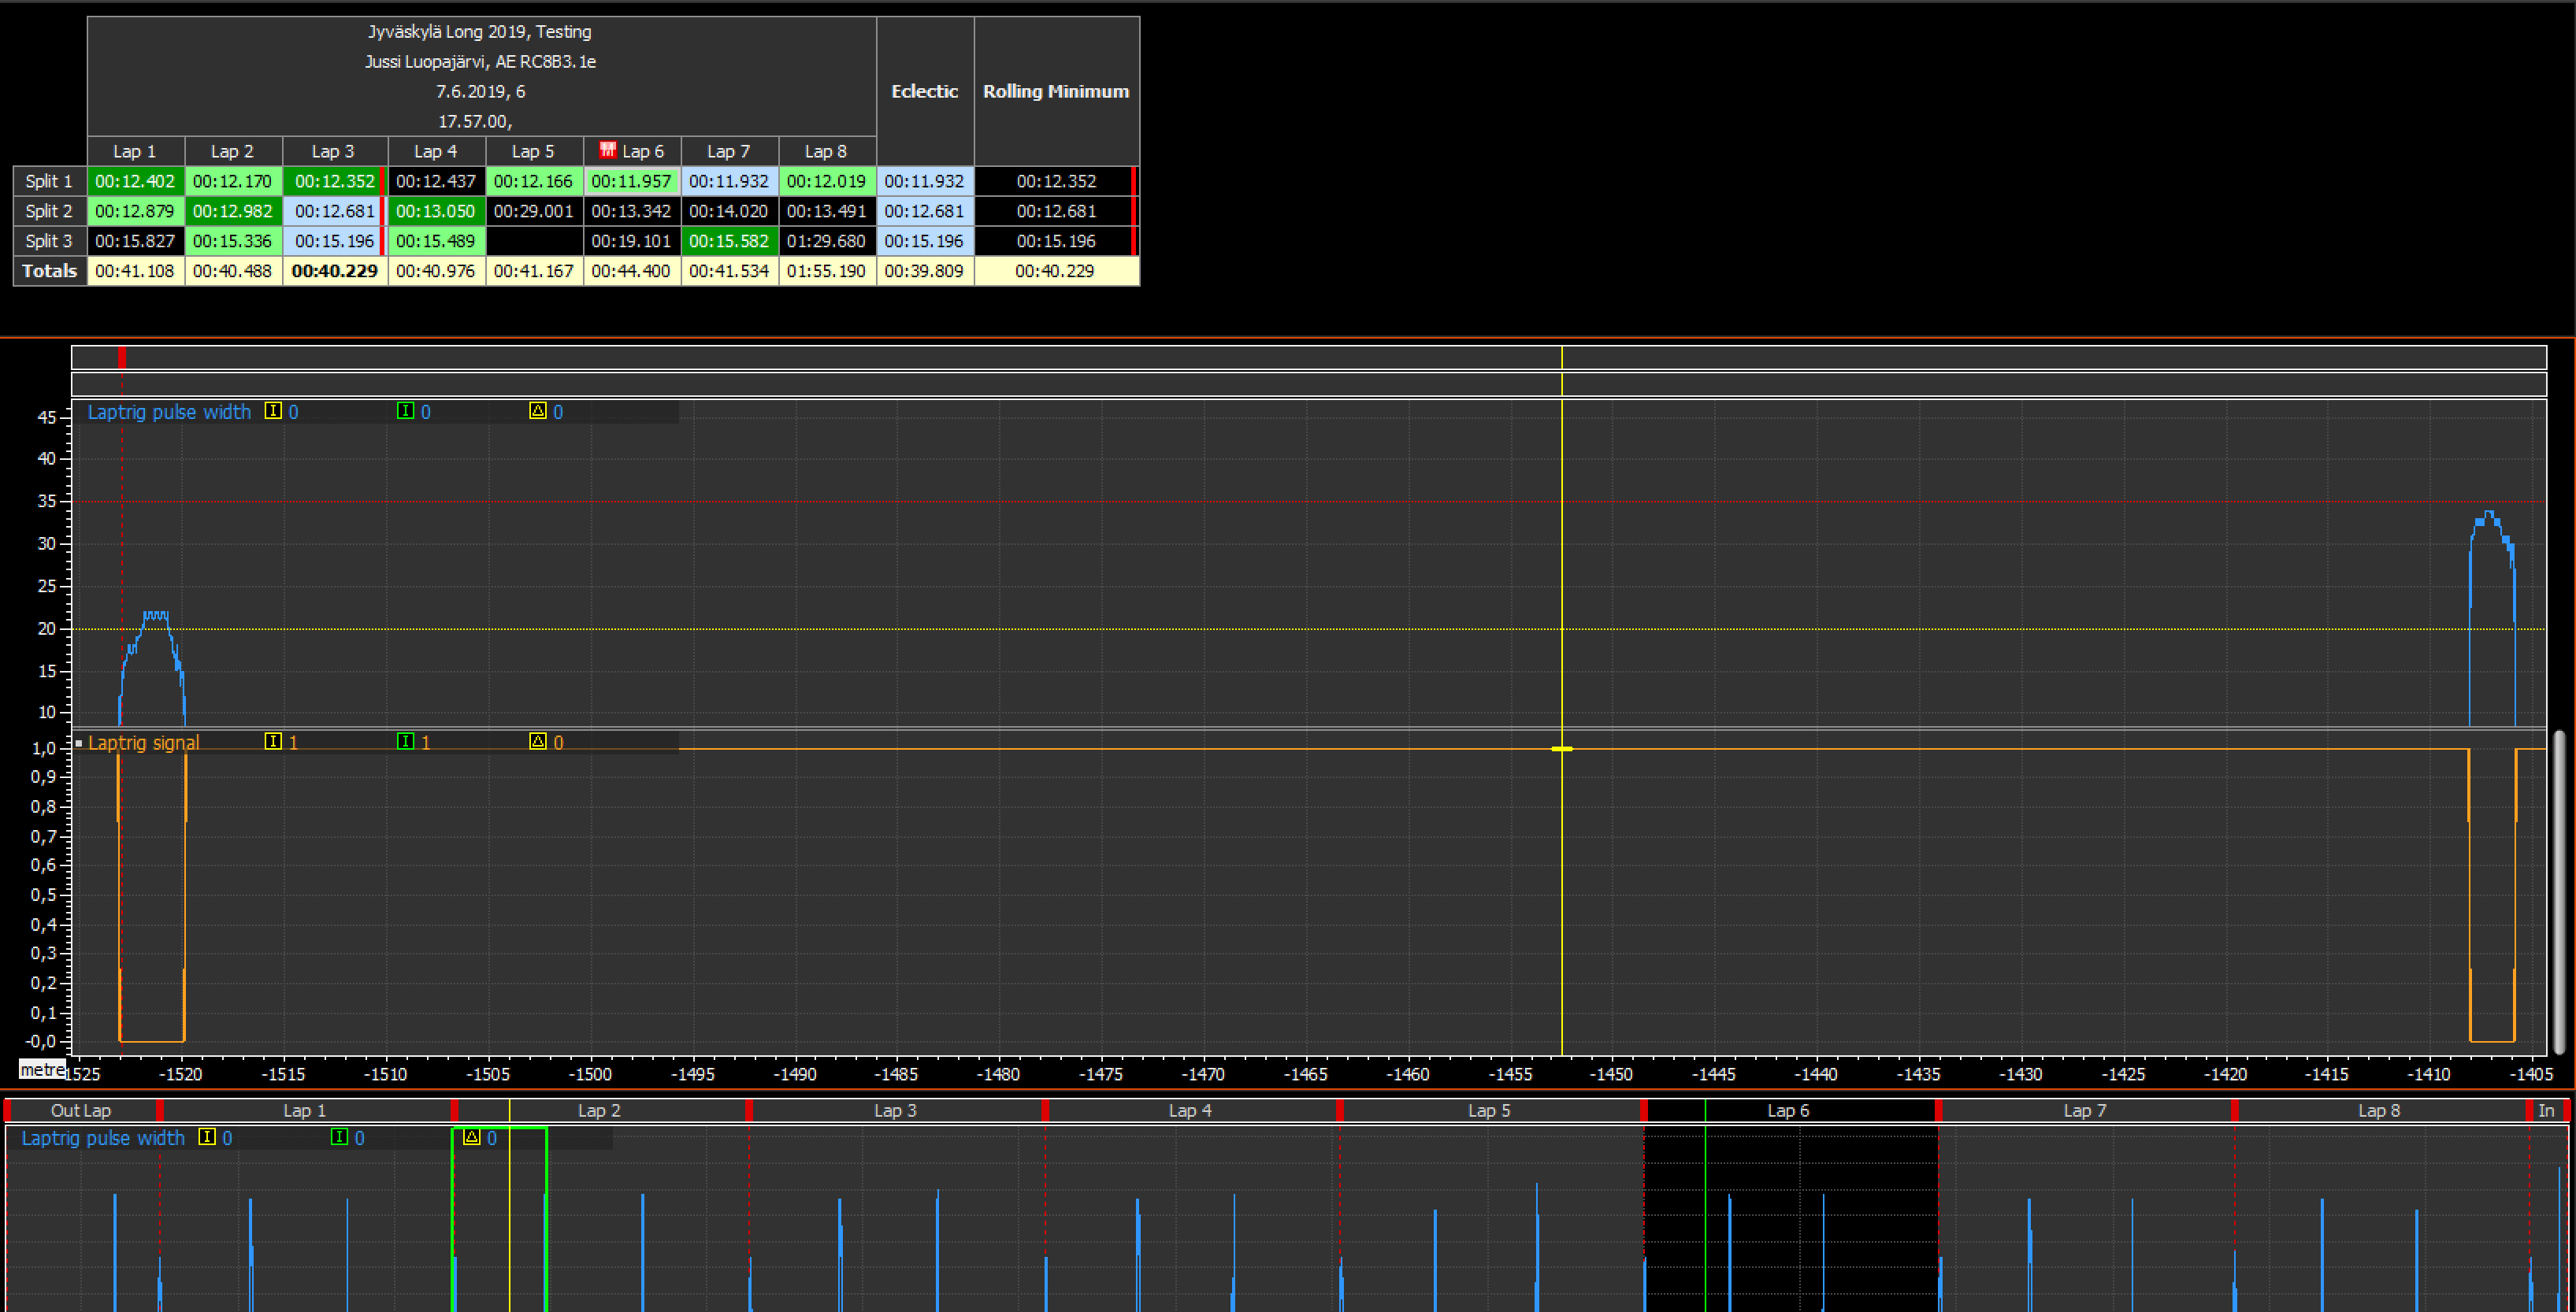
Below there is picture of data where there is one pulse from main beacon and one from split beacon. In the data you can see the blue line which has two pulses and these are points were beacon is active. Basically the logger measures the pulse width and this value is logged which is the pulse you can see in the picture. Then average is calculated from certain amount of samples to see if the signal is from main beacon or split beacons.
The thing get's slightly tricky as pulse is not square shaped but instead it is round, so calculation of the average can't be started from the first pulse but instead after e.g. ten samples. I haven't investigated the physics behind the phenomem, but it is related to the fact that moving car is passing the beacon and on the edges the measured pulse width gets shorter. I might need a IR led with even more narrow distribution angle?
![]()
-
What the data shows?
01/28/2019 at 14:19 • 0 commentsIt's been a while since last post and things have progressed a fair bit on HW side like Collector Full V2.2 and completely new IR beacon, but that's not the topic for today. Finally I'm posting about something else than HW development and it's about the collected data.
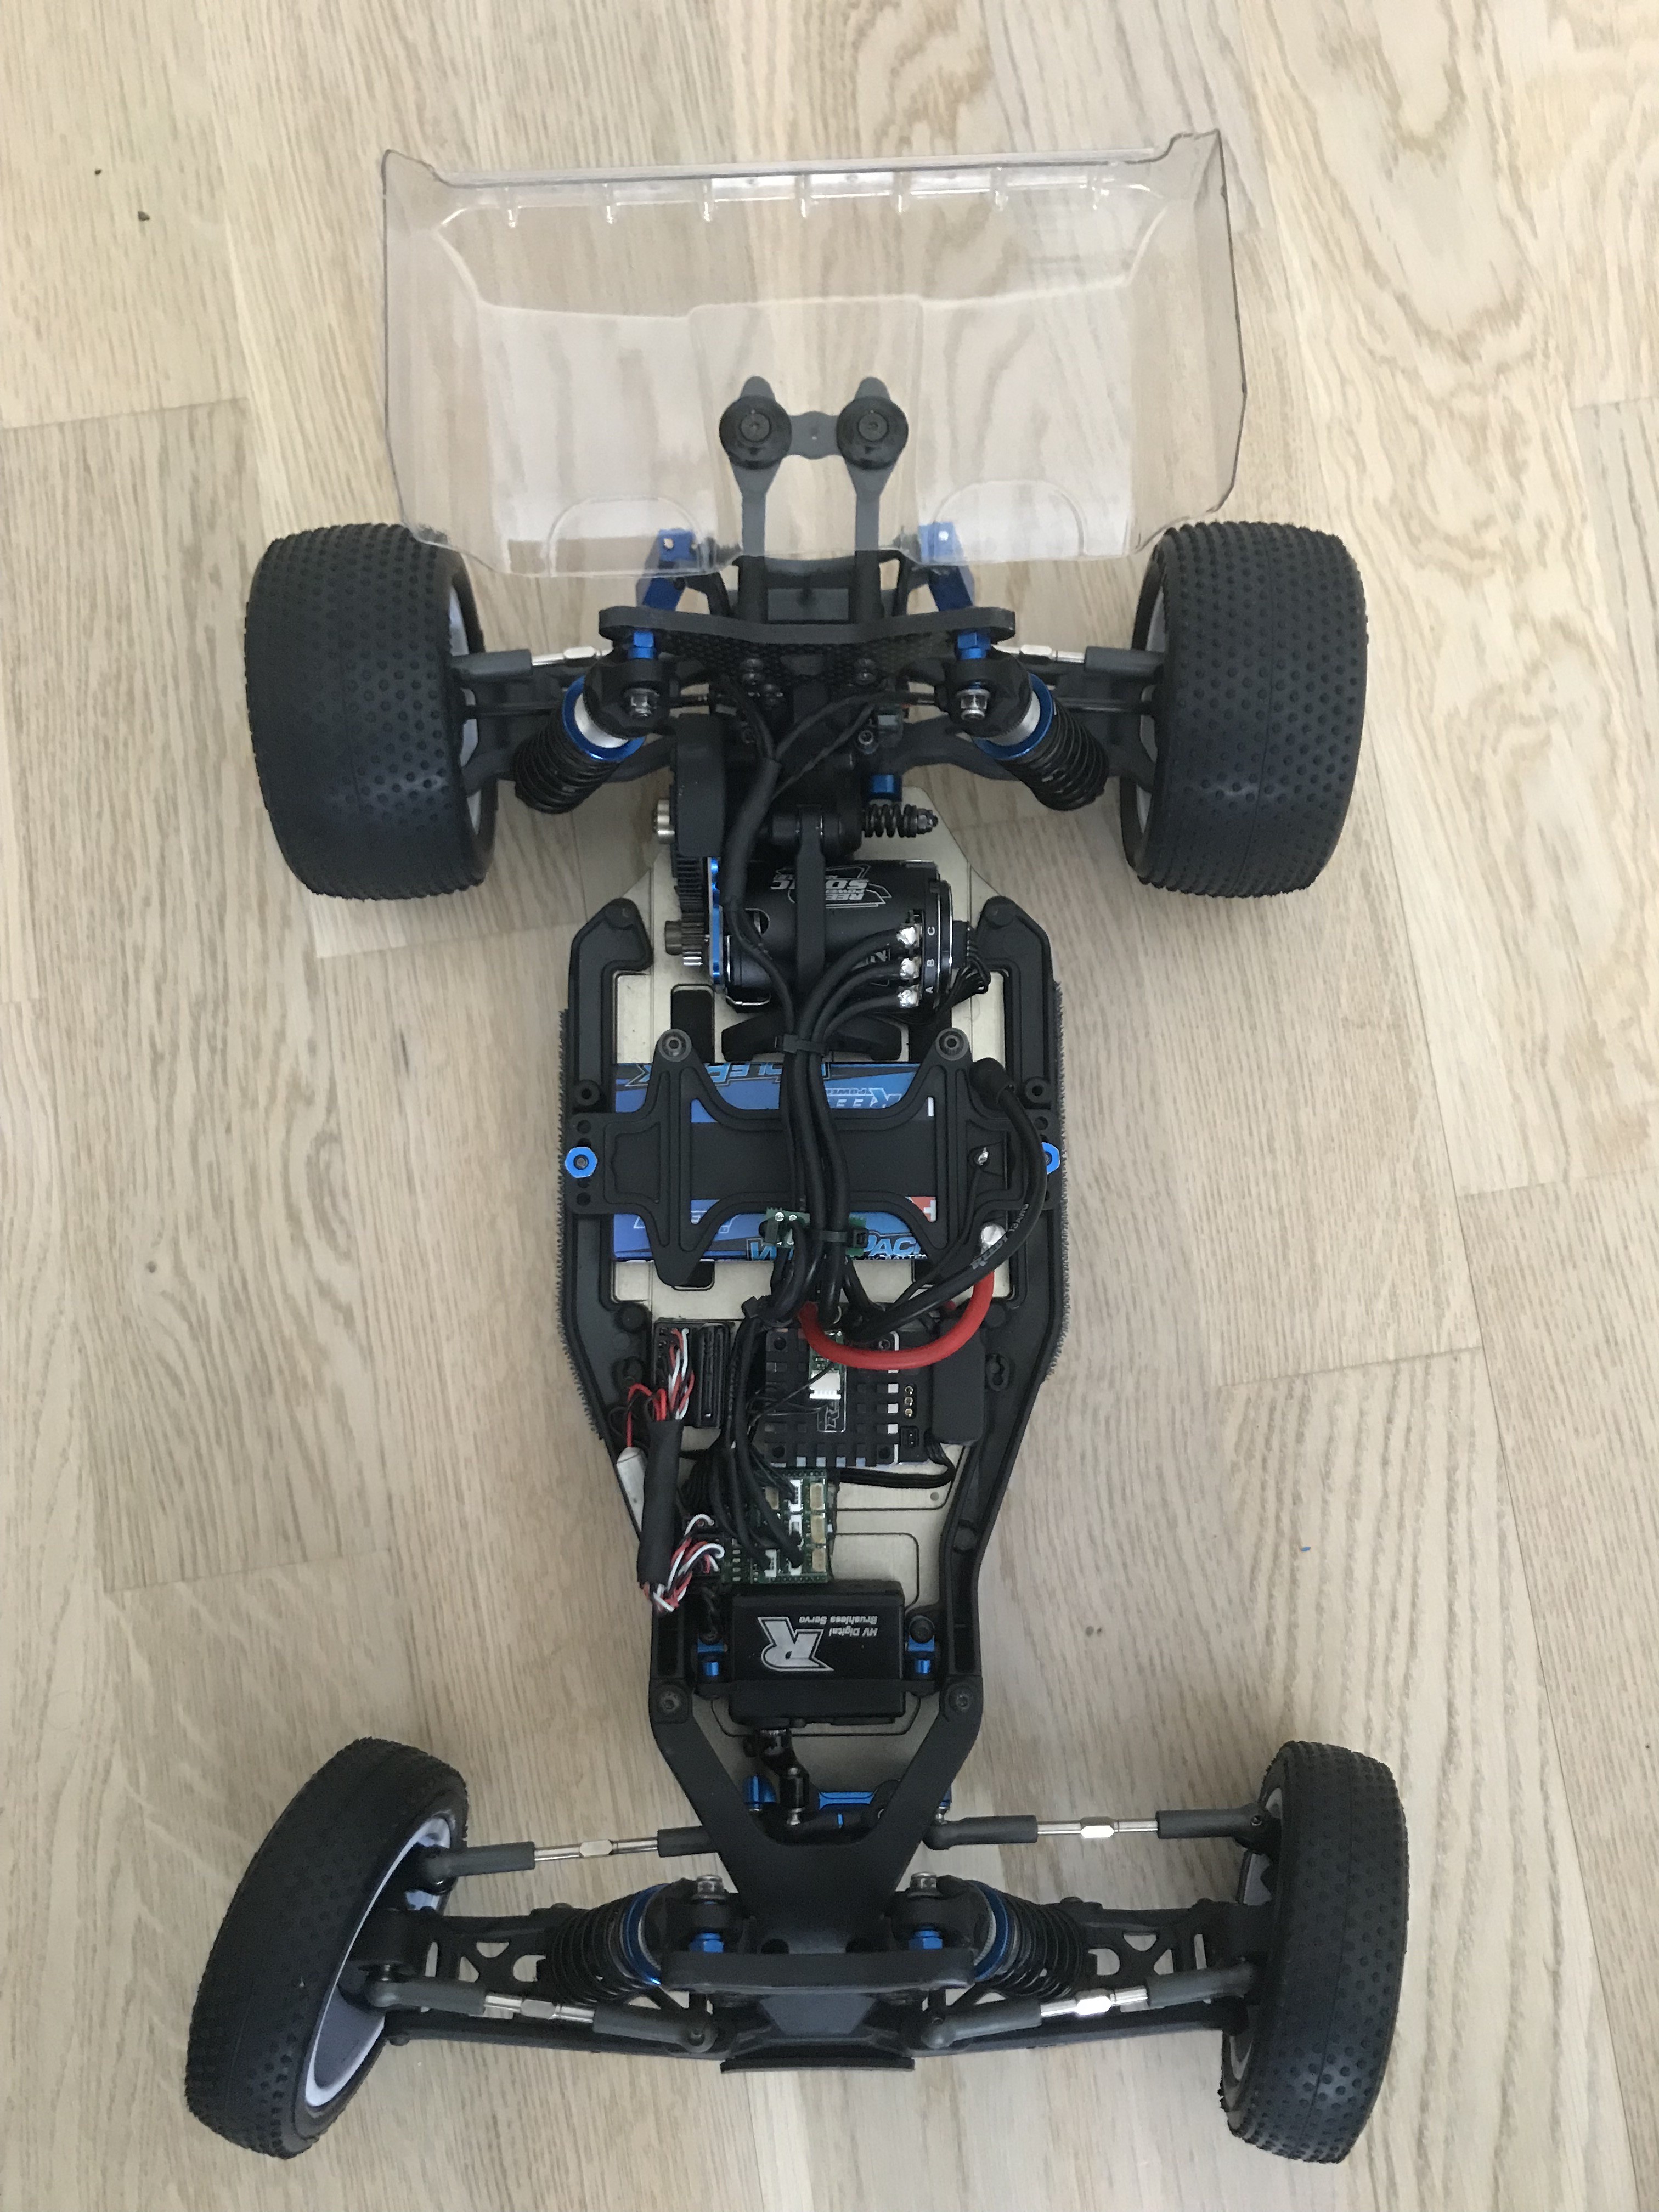
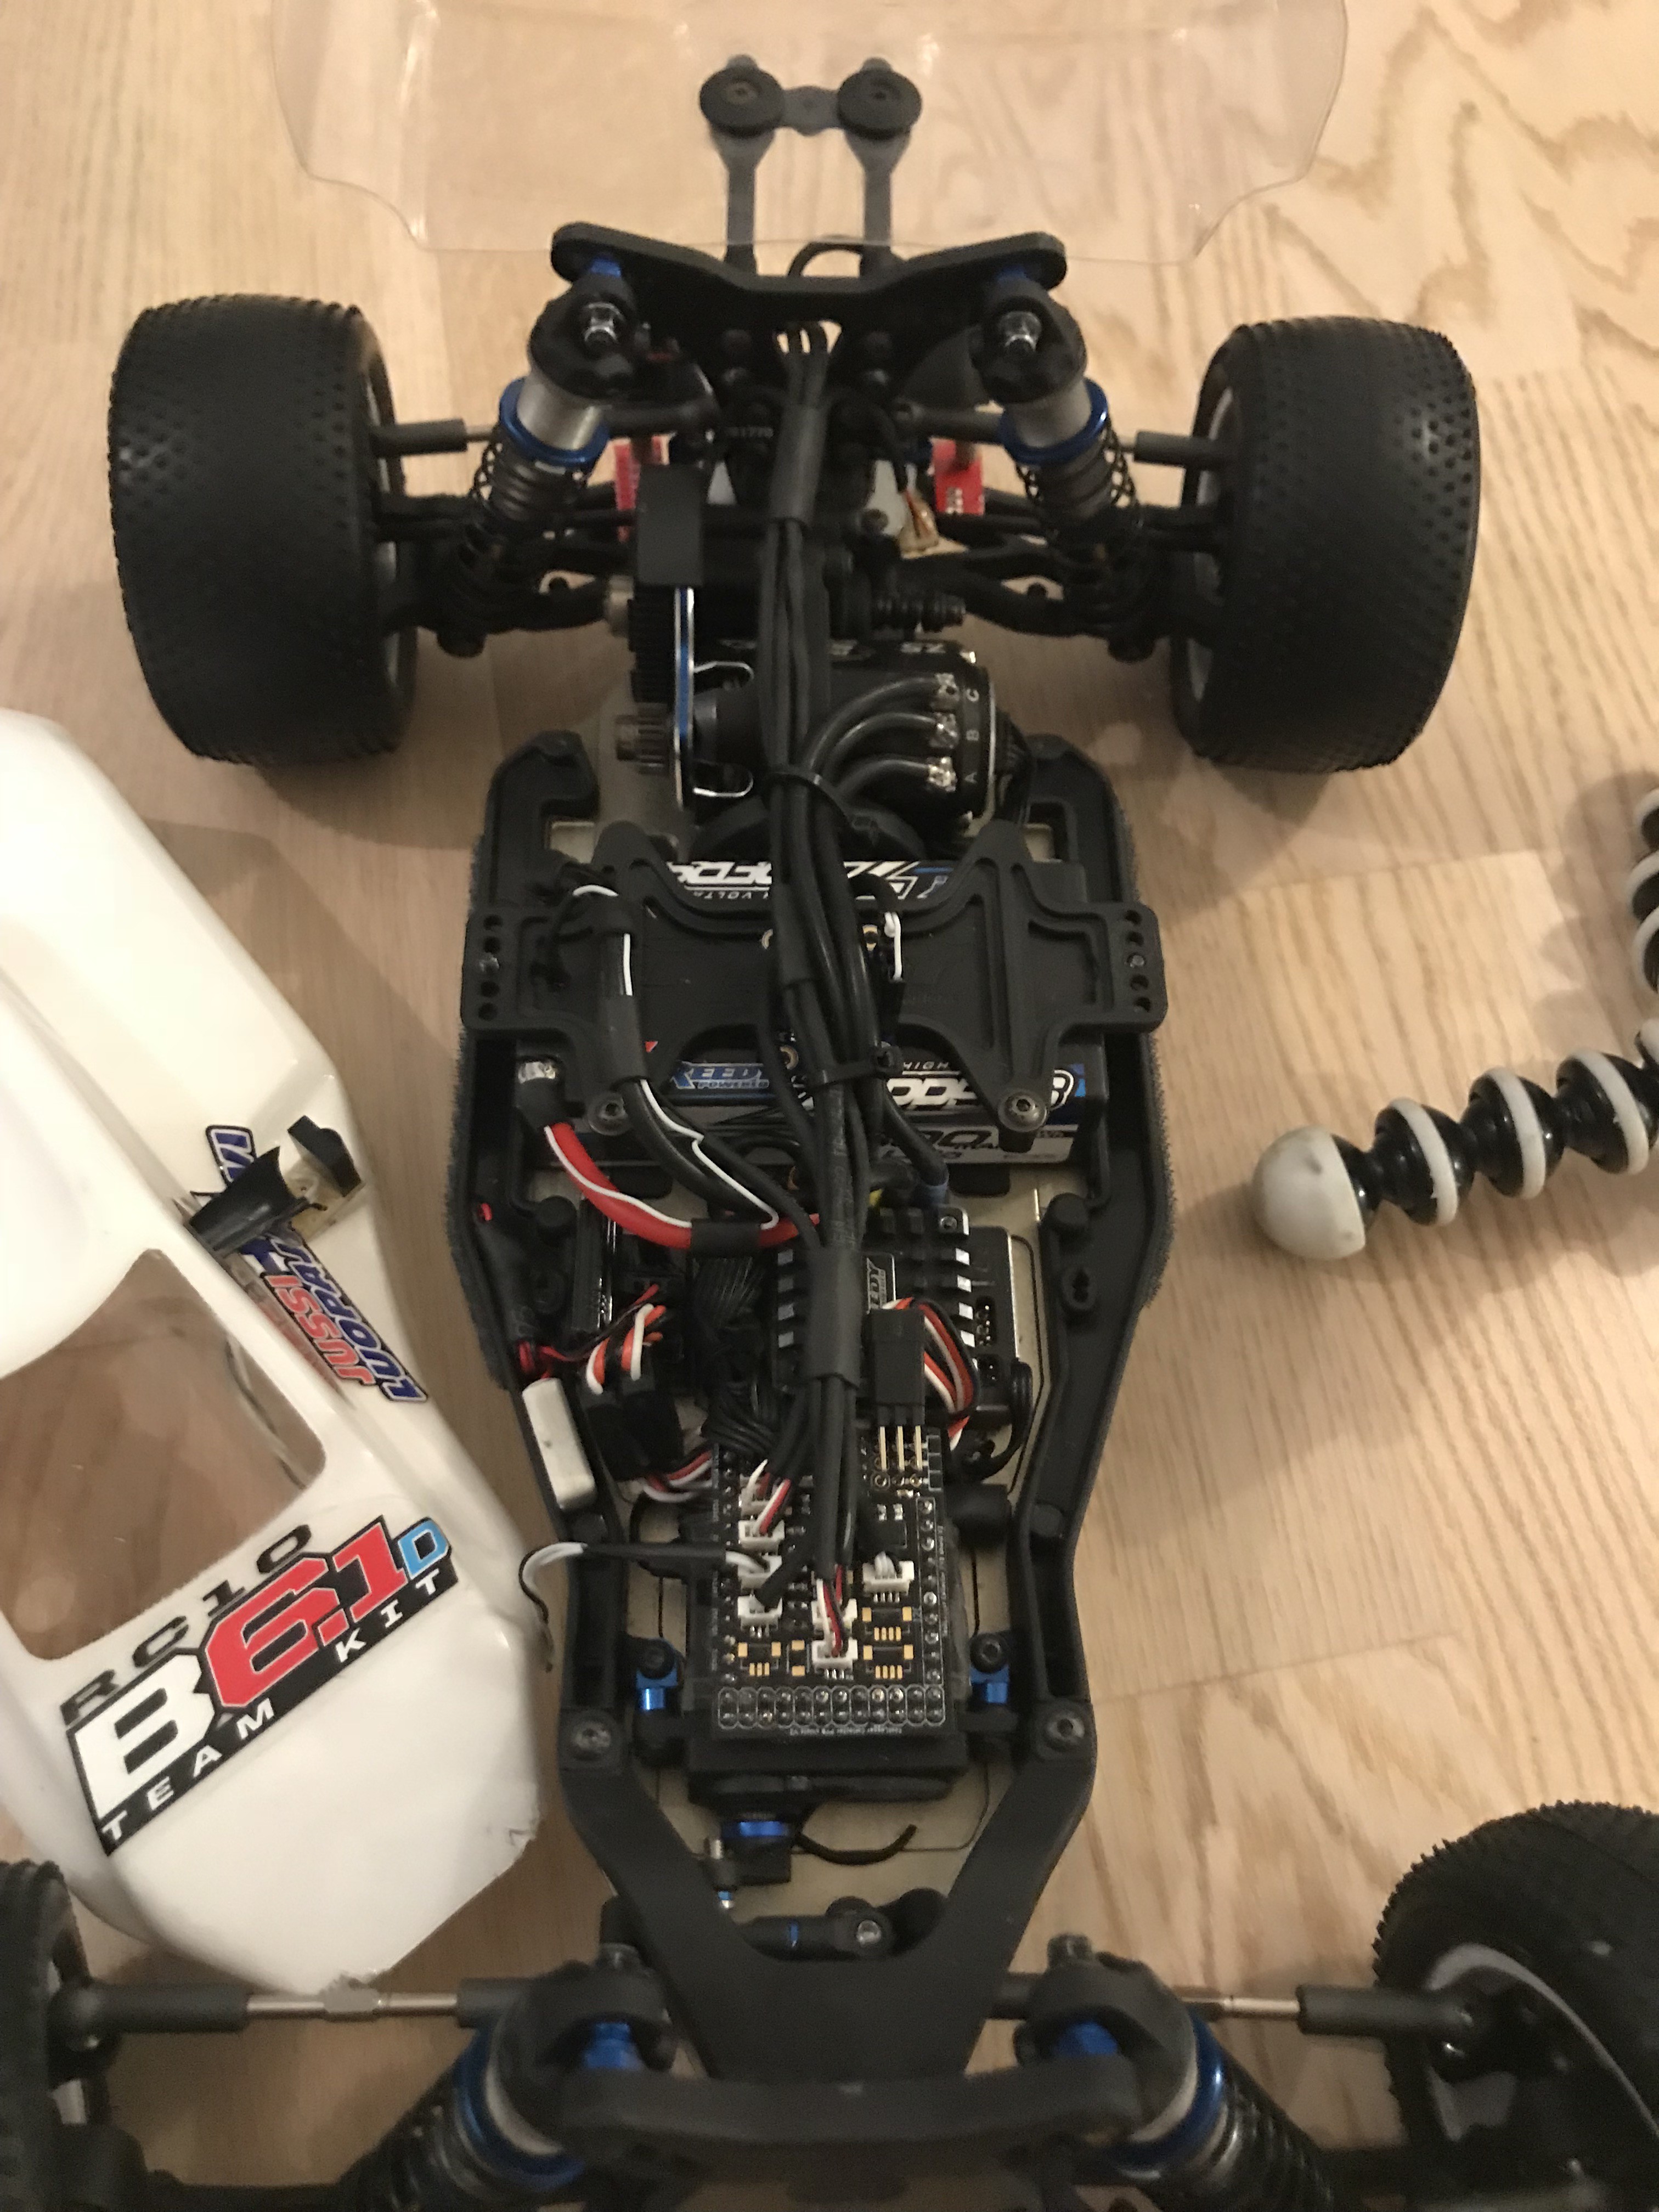
I've been using the Full V2.1 with my 2WD buggy (It's Team Associated B6.1D, see https://www.teamassociated.com/cars_and_trucks/RC10B6.1D/Team/) and I've logged the channels as follows.
- Steering
- Throttle/Brake
- RPM/speed from motor sensor port
- Wheel speed from both rear axle outdrives
- Battery voltage from two cells
- G forces on three axis
- Angular velocity with gyro
- Damper movement on rear corners
- Laptimes
Of course this amount of channels gives you a massive possibilities to analyze both car and driver, but here few simple examples to start with where you need only steering, throttle, speed and vertical acceleration.
---------- more ----------Here is the car with the setup above.
![]()
Top Speed
I dare to say that most common question any RC driver have ever heard is the magical question how fast the car goes. Well, without data it's quite hard to say but now we have that and we can finally give an answer.
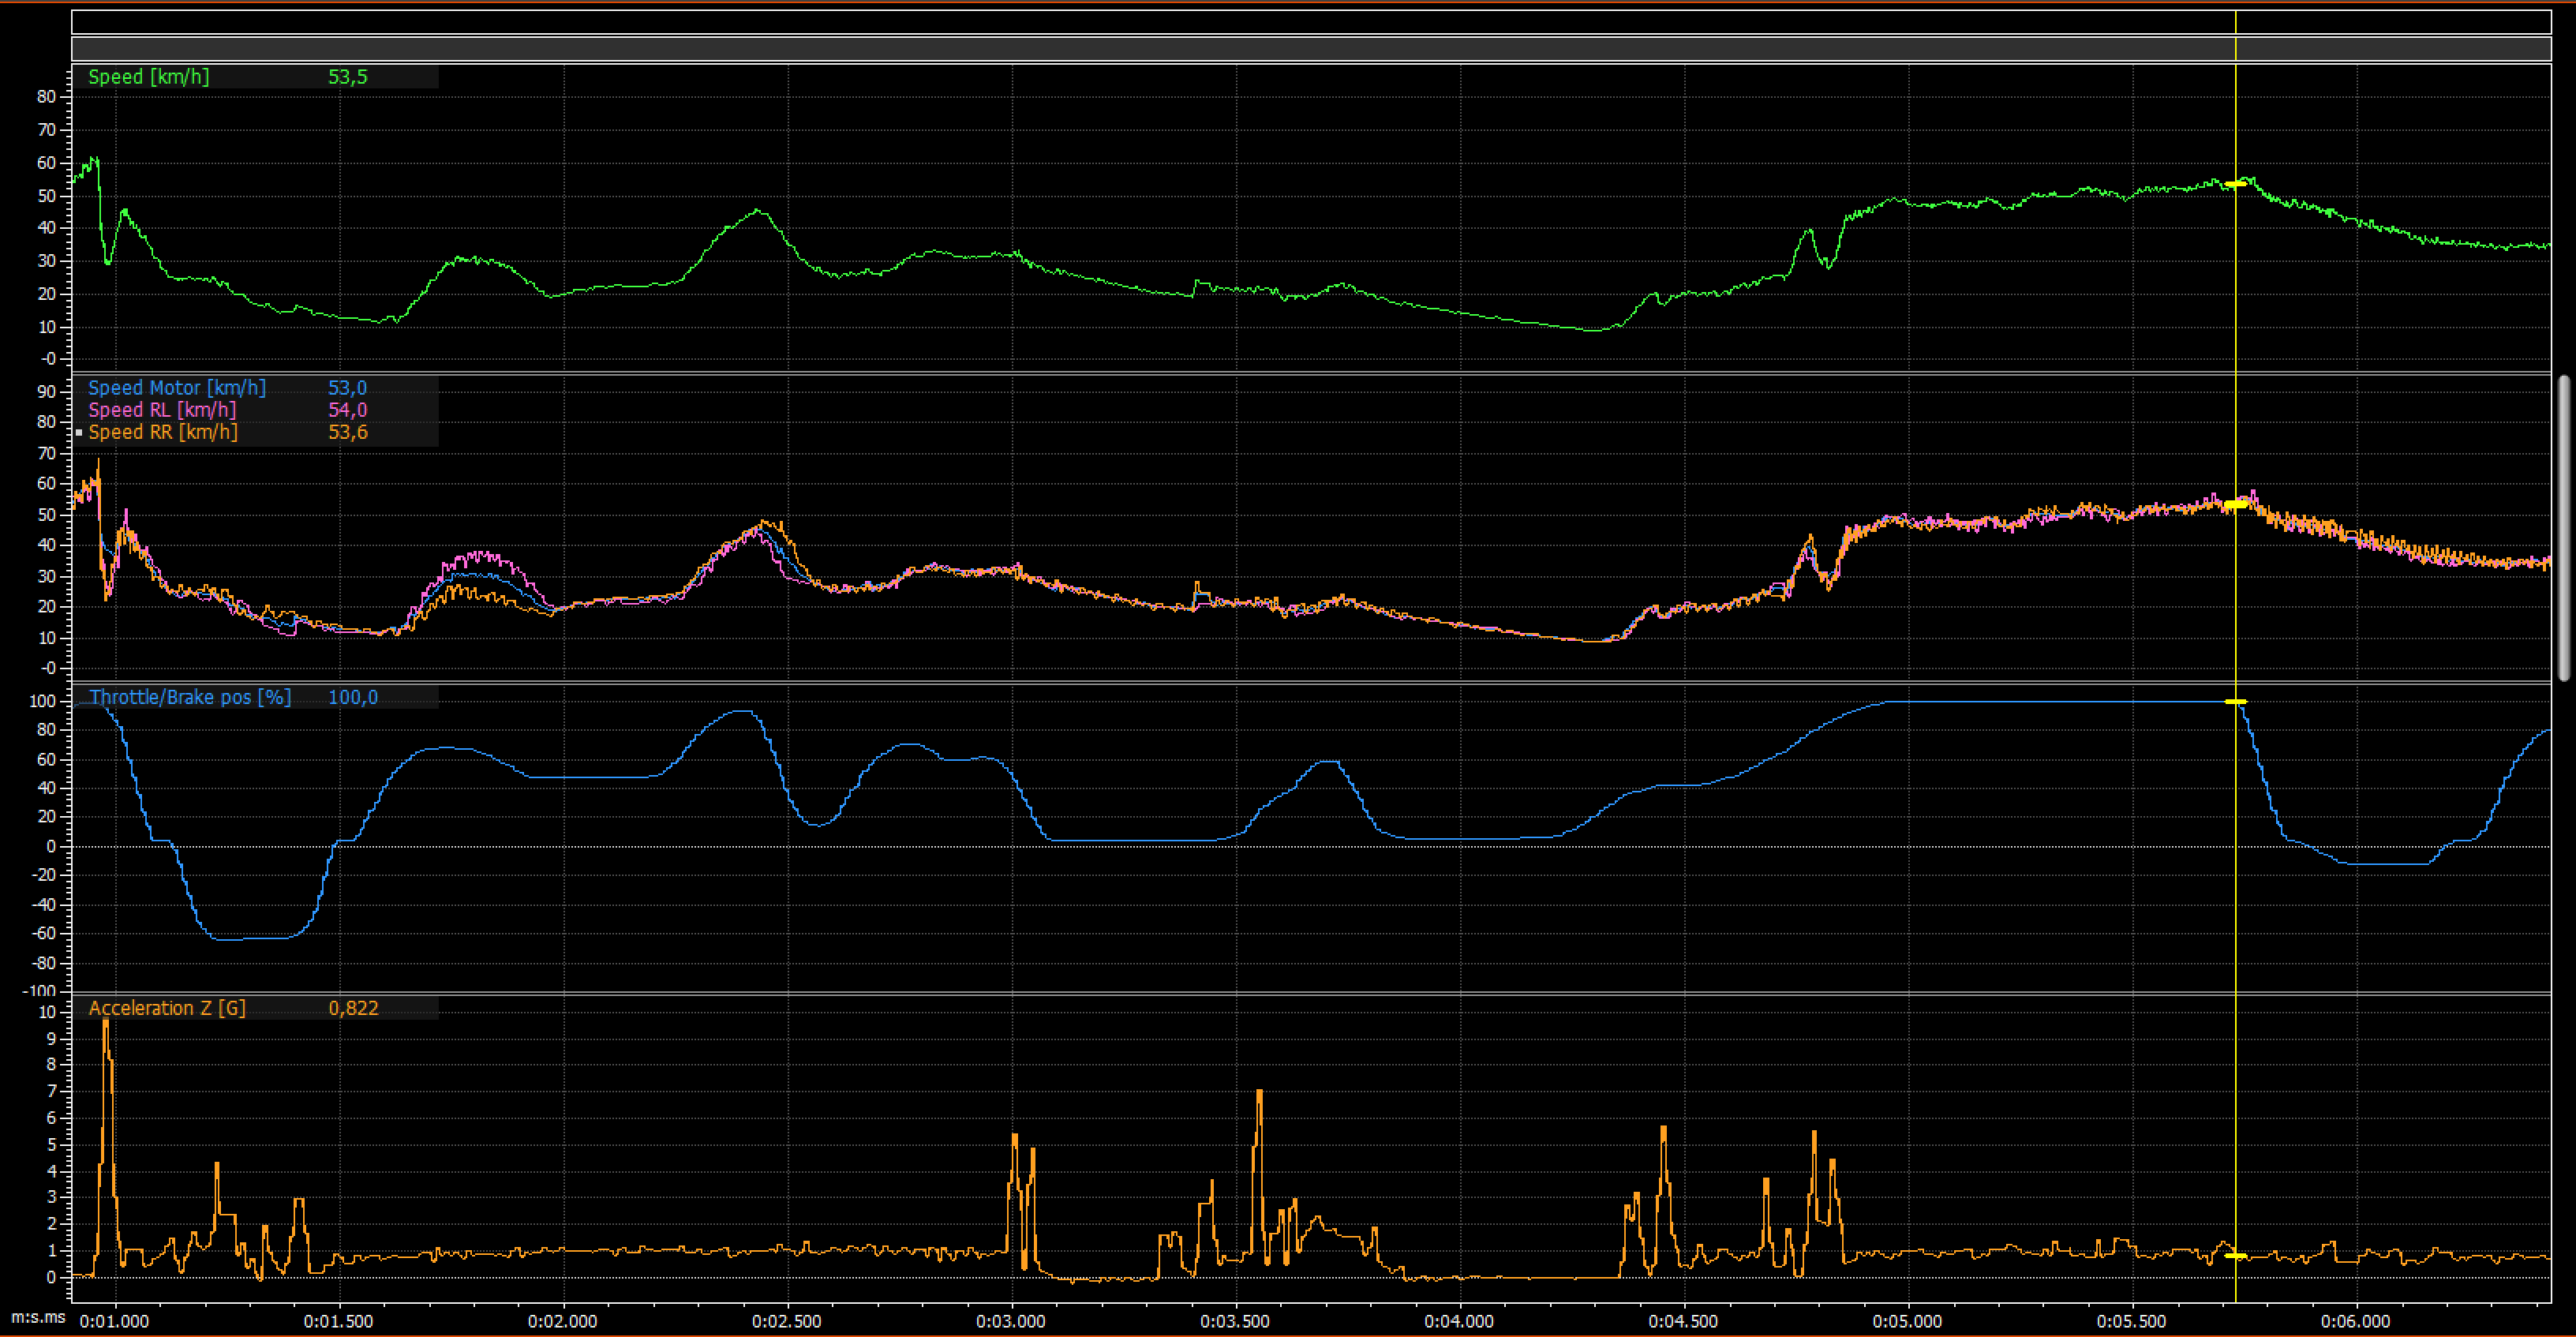
Below is a screenshot of speed trace. Green line is an average of all speed channels, second area has all three recorded speed channels, third area has throttle position and fourth area shows vertical acceleration. The yellow cursor is placed at the end of a straight and that tells us the speed which is 53.5 km/h and throttle is 100% and after that it drops to zero and the speed starts to reduce as well.
![]()
Why to use common sense when the computer tells you a number? In the first scenario you can see some noise on the second area where you have all the speed measurements, so then you can already say there is some error margin in the value.
We also need to consider if there is any wheel slip which increase the speed, but in this case I don't see that it would be the case.
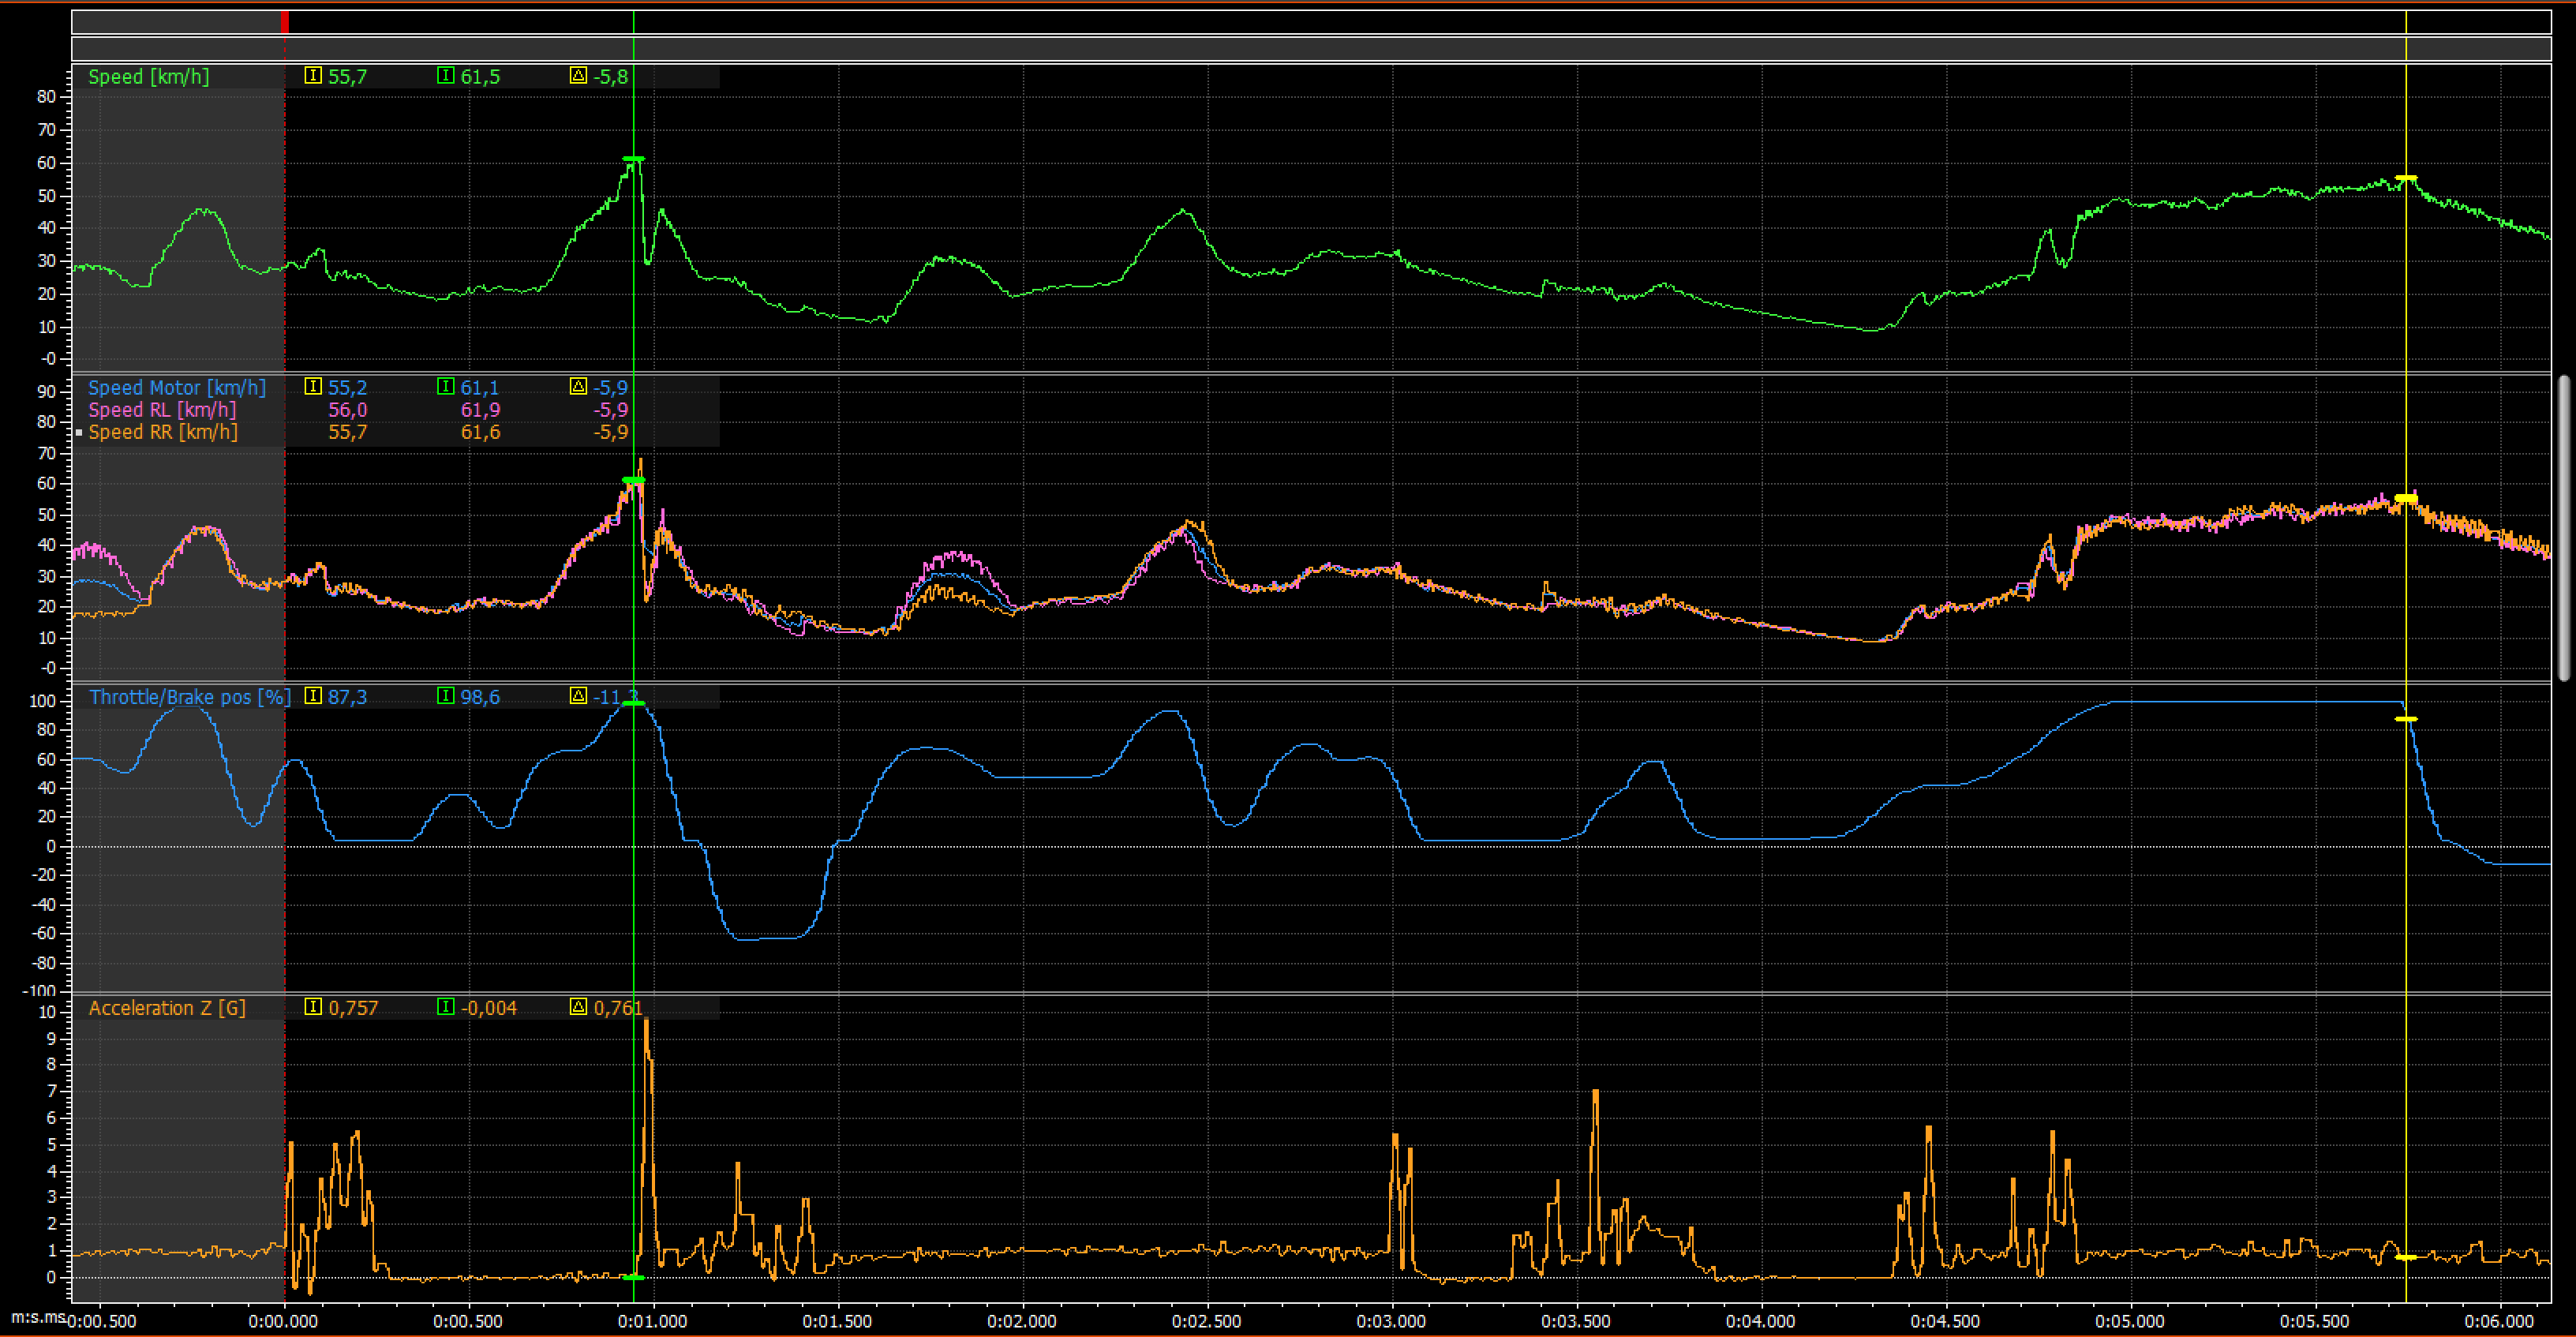
So that around 55 km/h was from the end of fastest straight, but when you look the whole lap and there is a point where the speed is actually higher. So what is going on in here? The picture below shows you the highest speed and the end of the straight and I have cursors in both locations and delta is 5.8 km/h where the speed at end of the straight is slower.
This is the reason why I wanted to have vertical acceleration visible in the screen because that shows zero in the point where speed is highest and in static situation it should be 1. This tells us that the car is in the air and I press the throttle already in the air. If you look closely after the green cursor the vertical acceleration goes to around 10 Gs and speed drops very quickly and this tells that the car lands. So this tells us that this isn't real top speed of the car and we need to use the speed from end of the straight.
How to utilize the speed information when testing? One simple example is to compare different gear ratios and what is the effect on acceleration phase as well as the top speed. You can also try different driving styles e.g. taking different lines in the corner before the straight and see if it has an impact on the speed on the straight.
This picture already shows something else what is interesting but we come to that later on in the future posts ;-) And that is not my sh*t driving :D
![]()
Driver behaviour
The only input what driver can do is to turn the wheels and accelerate/decelerate the car. Target for those driver inputs is to make the car go around the track as fast and consistent as possible within the limits of car's capabilities. Then what can you tell about the driver based on the data? For example it's possible to see if the driver smooth or aggressive. What techniques driver uses to for example workaround oversteering and understeering.
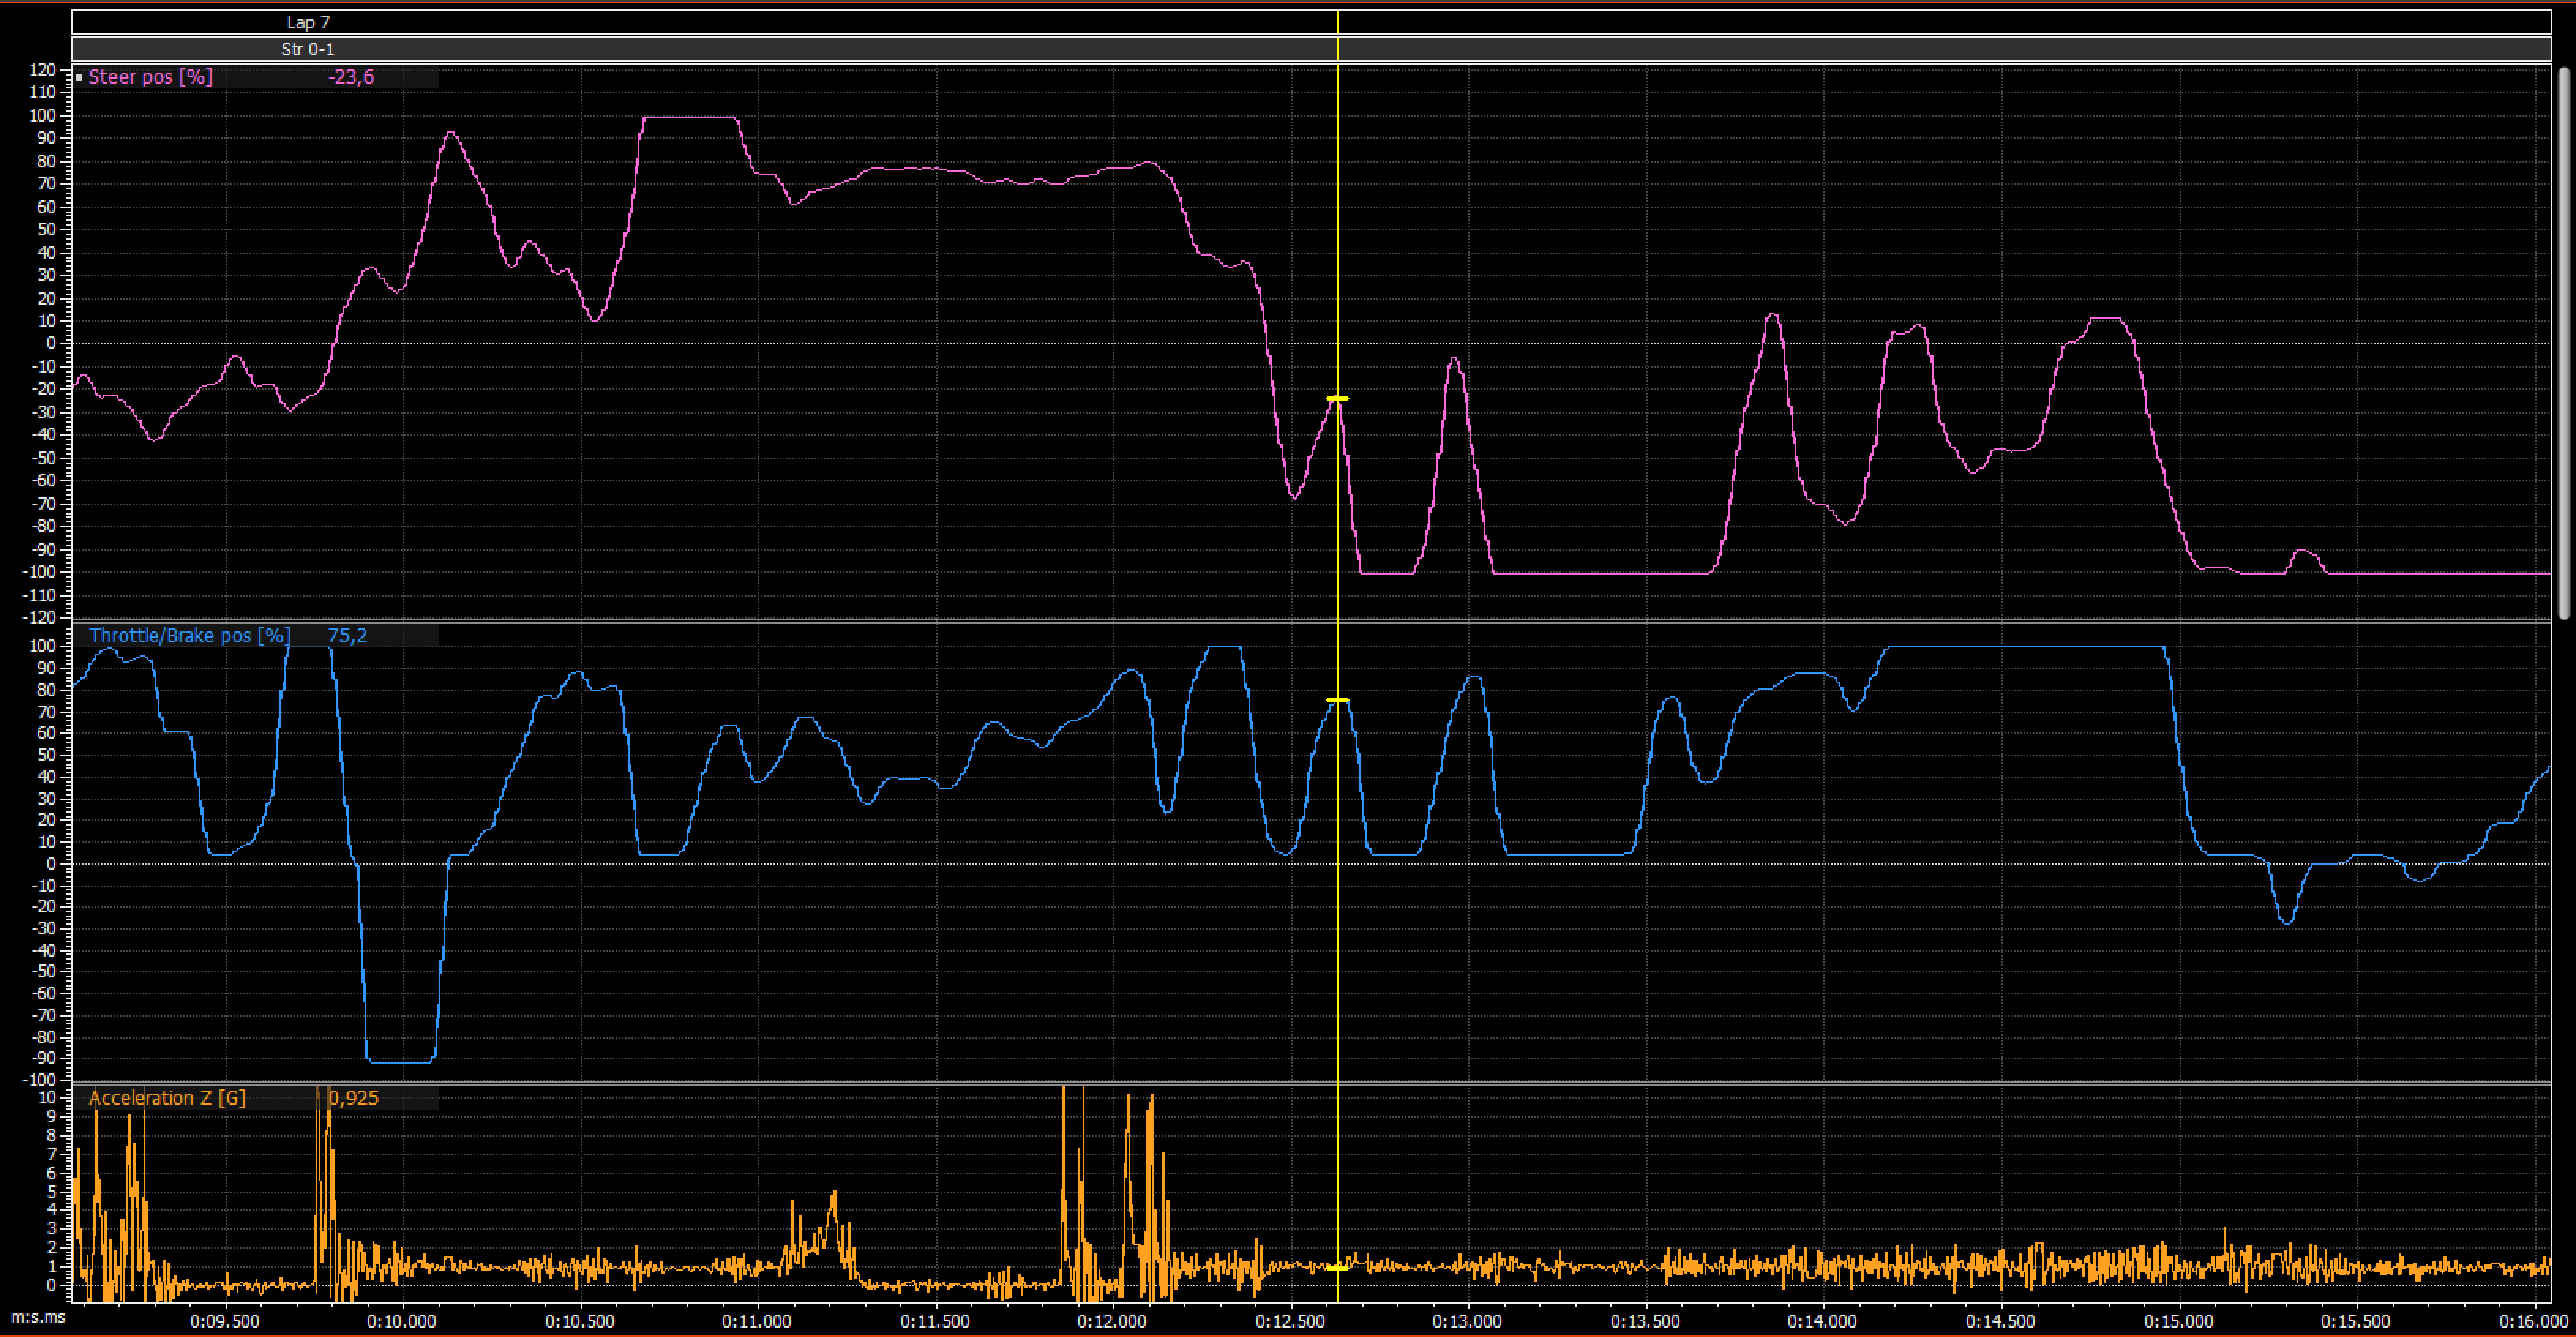
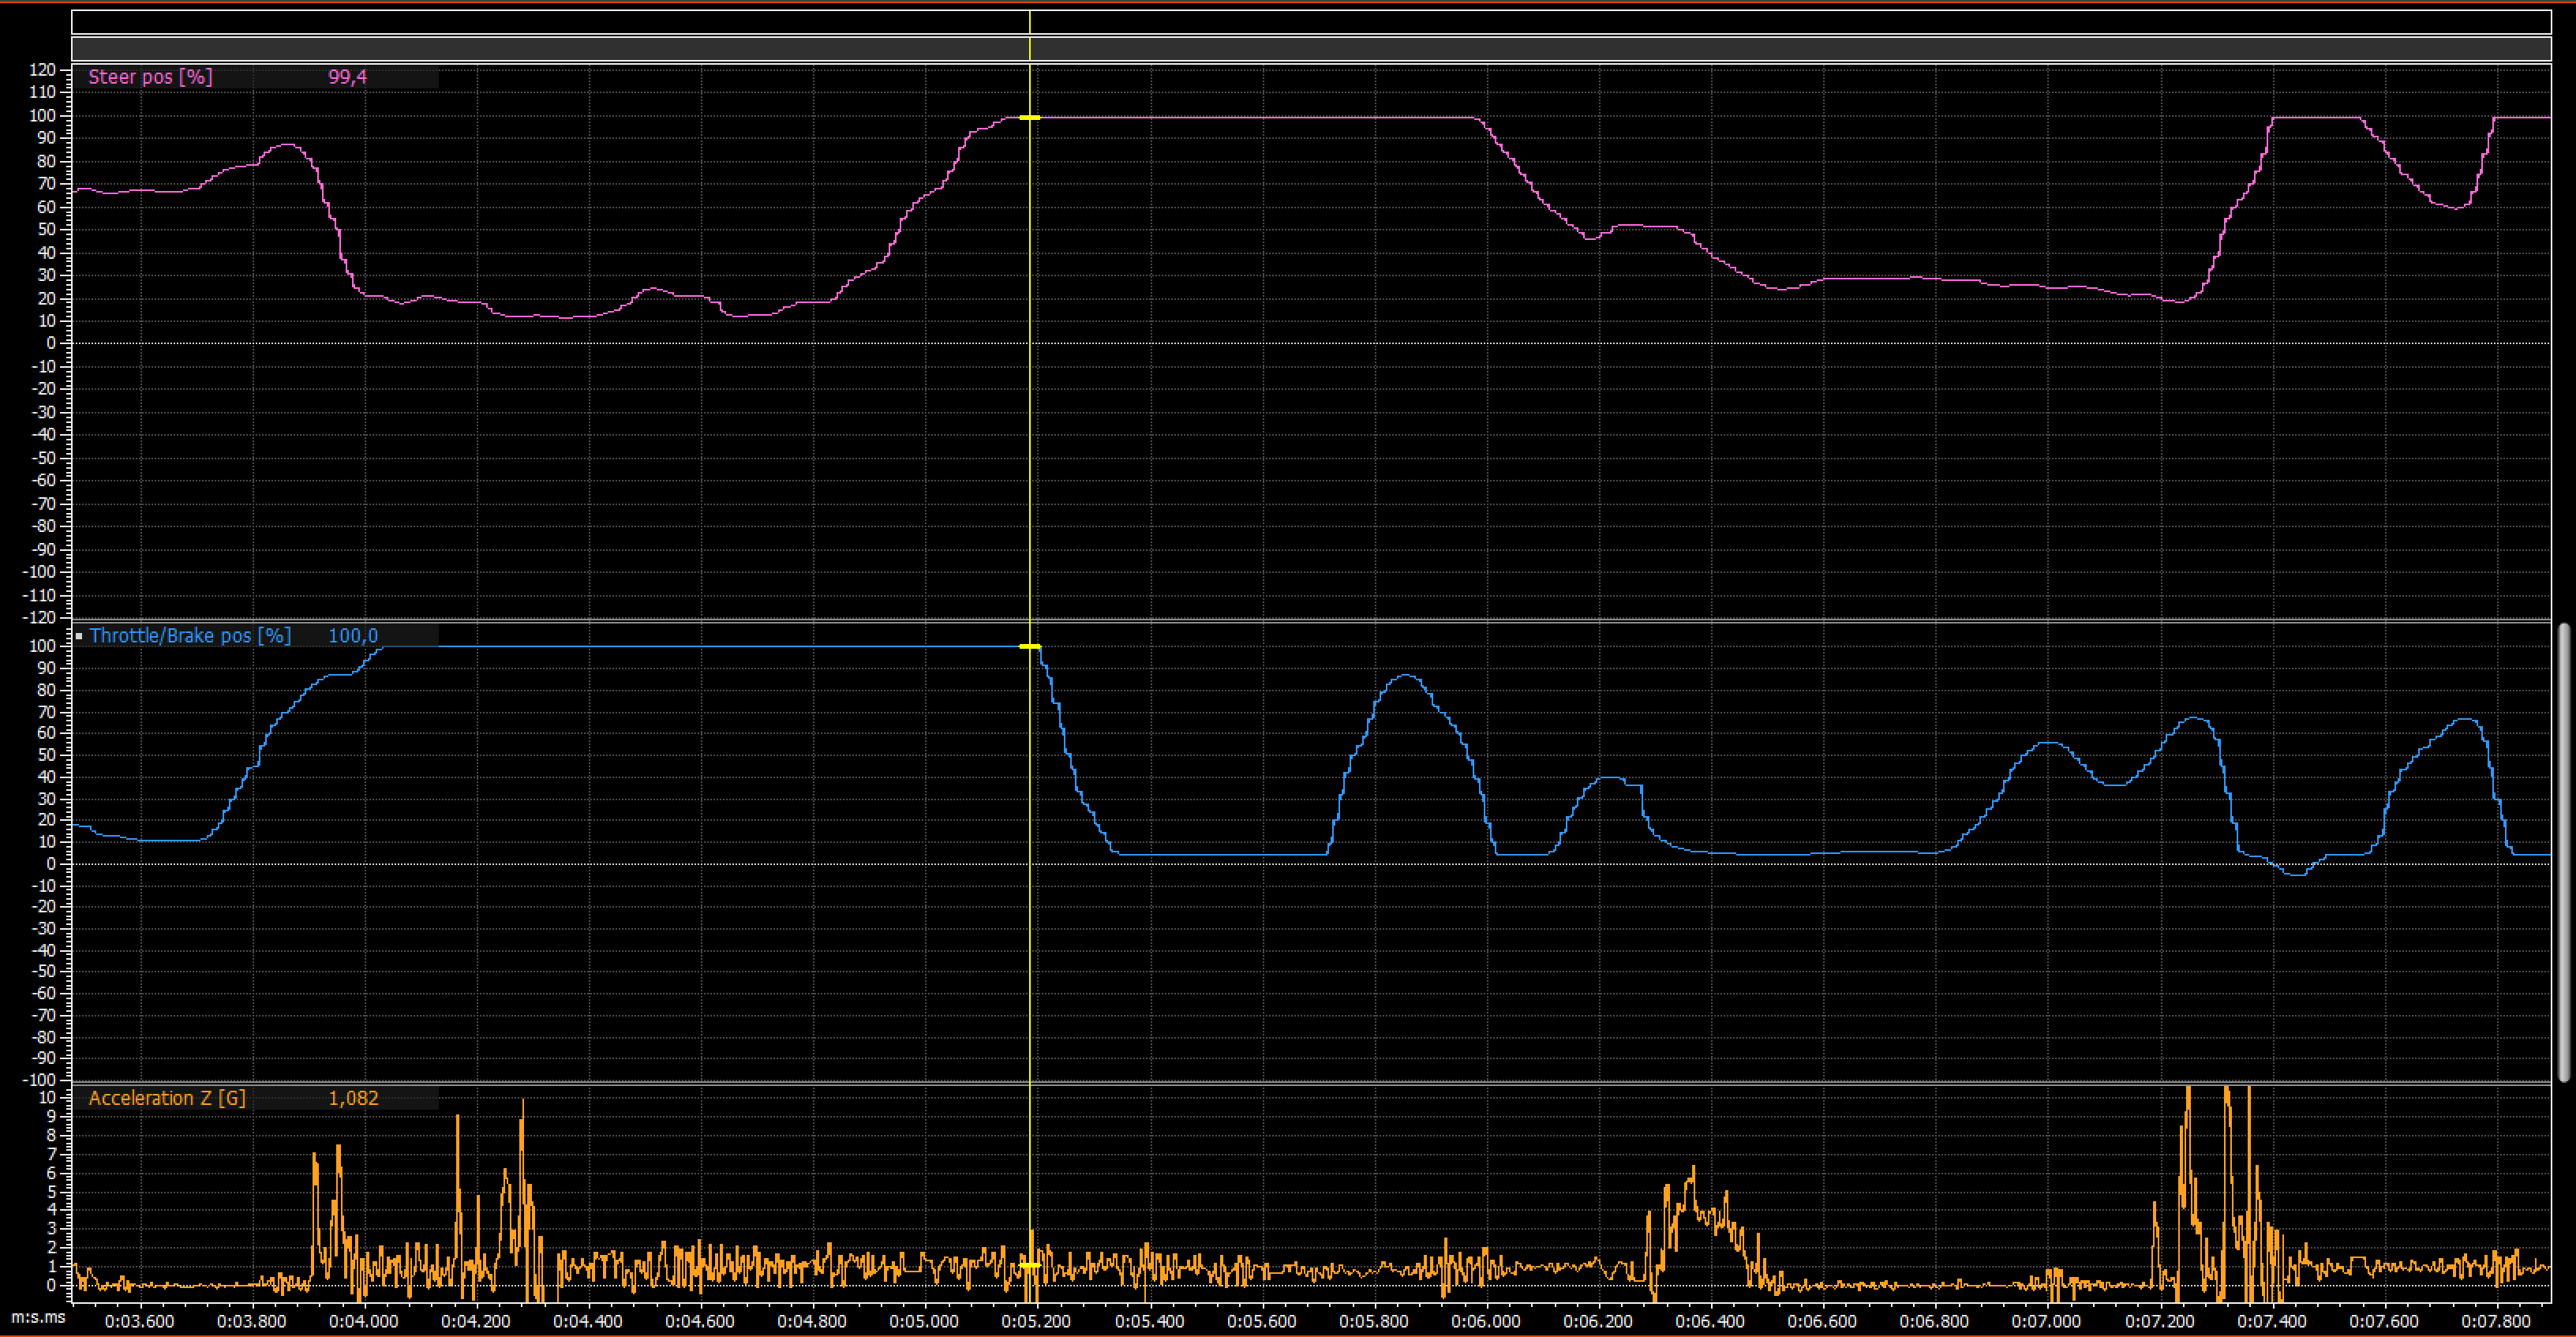
Here is two examples to show what can be seen in the data. Purple line shows steering input where positive values are wheels turning to left and negative values are wheels turning right. Blue line shows throttle usage where positive values is throttle and negative values is braking side.
The image below is from medium speed right hand turn and what can be seen here is the massive amount of corrections. You can see the corrections from the cursor location onwards where both steering and throttle have massive spikes. Very likely the car behaviour is not something what I wanted and tried correct it with both throttle and steering input. Likely this is a situation where car is understeering and now I disturb the chassis movement all the time by adding throttle and reducing steering. Probably I have complained about the understeering and chassis setup needs appropriate changes, but could I try smaller adjustments and different timing with both steering and throttle? Now I make steering adjustment at the same time as the throttle adjustment, so maybe I didn't the have confidence that is able adjust the possible oversteer what only throttle adjustment brings?
![]()
The second situation is from the same straight as the top speed example but different run. At the location of the cursor you can see the steering input is 99,4% and throttle is 100%. You also see the steering input will be in max position for a very long time and throttle stays in zero. This already tells us very clearly even we don't check any other channels that the car is understeering a lot and I'm just waiting for the car to turn in. At time 5.7 you can see that I'm able to go back on throttle for a short while, but it's a very long time (around 0.5 seconds) in a fast corner without throttle. This makes the speed decrease and the outcome is a slower lap time.
In RWD car most of the weight is on rear wheels when you are on full throttle and front wheels don't have that much effect, so maybe I could try to ease the throttle before starting to turn in and get weight moved to the front wheels to get better turn in. It might have the wanted effect but then I might have problem make it happen consistently each lap.
Key element here is the driver feedback and how it also needs interpretation. If driver complains either understeering or oversteering, then next thing is to find those situations from the data and link the comments to data based on feedback. Then it possible to analyse if the driver does something unusual when approaching the corner or if something can be done for the setup.
But it might be that the driver might not have complained anything because the car feels easy to drive and he is on a comfort zone. Unfortunately then it's difficult improve the car or the driving (i.e. improve the laptimes) and with help of data these points are possible to see and discuss with the driver if something different could be tried.
![]()
What's next
I hope this opens a little bit what data analysing enables. There would a lot examples to write about and you could definitely write a book about it but that's not the purpose in this case. I hope to get at least few people to get interested about data analysing and investigate it a bit. Data is not the absolute truth when it comes to improving the performance but it can be very valuable tool and give guidance.
I will write more about the topic and maybe get even more skilled persons to write something? Topics could be e.g. dampers, differentials, slipper clutch or driver comparison. Let's see what the future brings.
Hopefully next post is about sensors. What sensors I'm using and how those are fixed to the car. Thank you for reading!
-
Remember the f*ing review
01/12/2019 at 07:22 • 0 commentsI designed the V2 for Full version in a bit of rush and guess what, it was a massive failure. The boards were working nicely, but microSD slot was placed 180 degrees in a wrong direction (slot was facing against USB connector...), analog 3V3 was not connected to upper board due to an issue in schema plus few other minor issues.
What did I learn from this? REVIEW YOUR SCHEMA AND BOARD DESIGN BEFORE SENDING IT TO PCB MANUFACTURER!
One positive learning from this episode was the possibility to move SD card slot outside the device. Usually the logger needs to be installed on very tight place, so sometimes it's actually good to have an option that you can bring the SD card slot to more accessible location.
![]()
-
Firmware architecture depression?
01/01/2019 at 10:55 • 0 commentsFirst of all Happy New Year everyone!
Last couple of weeks I've been starting to do a spec for the firmware as the hardware starts to be good enough that I can live with the limitation. The firmware design just feels overwhelming task and even difficult to decide where to start. I've never done a spec for embedded SW and last time I've been doing UML charts was probably around 10 to 15 years ago. I already know quite technical challenges I need to resolve, but before I go that far I need to find a how present the firmware on paper. I bought this book to get some guidance https://www.amazon.com/Real-Time-Embedded-Systems-Principles-Engineering/dp/0128015071
Next step is to learn some good practices what to follow when doing design decisions which is also a challenge as my experience in programming is quite limited. Especially with C.
Last big step is to actually actually resolve the technical challenges and writing the code. For example how to get each channel to log data on correct logging rate. How handle the buffer. In which format the data should be written because data is coming to buffer on different rates.
Do you have any suggestions how to start designing FW architecture based on RTOS? If you have good articles to read and learn, please share. This is probably going to be a long project and just need to take the needed time to do it one step at a time and avoid doing shortcuts.
---------- more ----------If you are interested what I've done so far, here is few images for you.
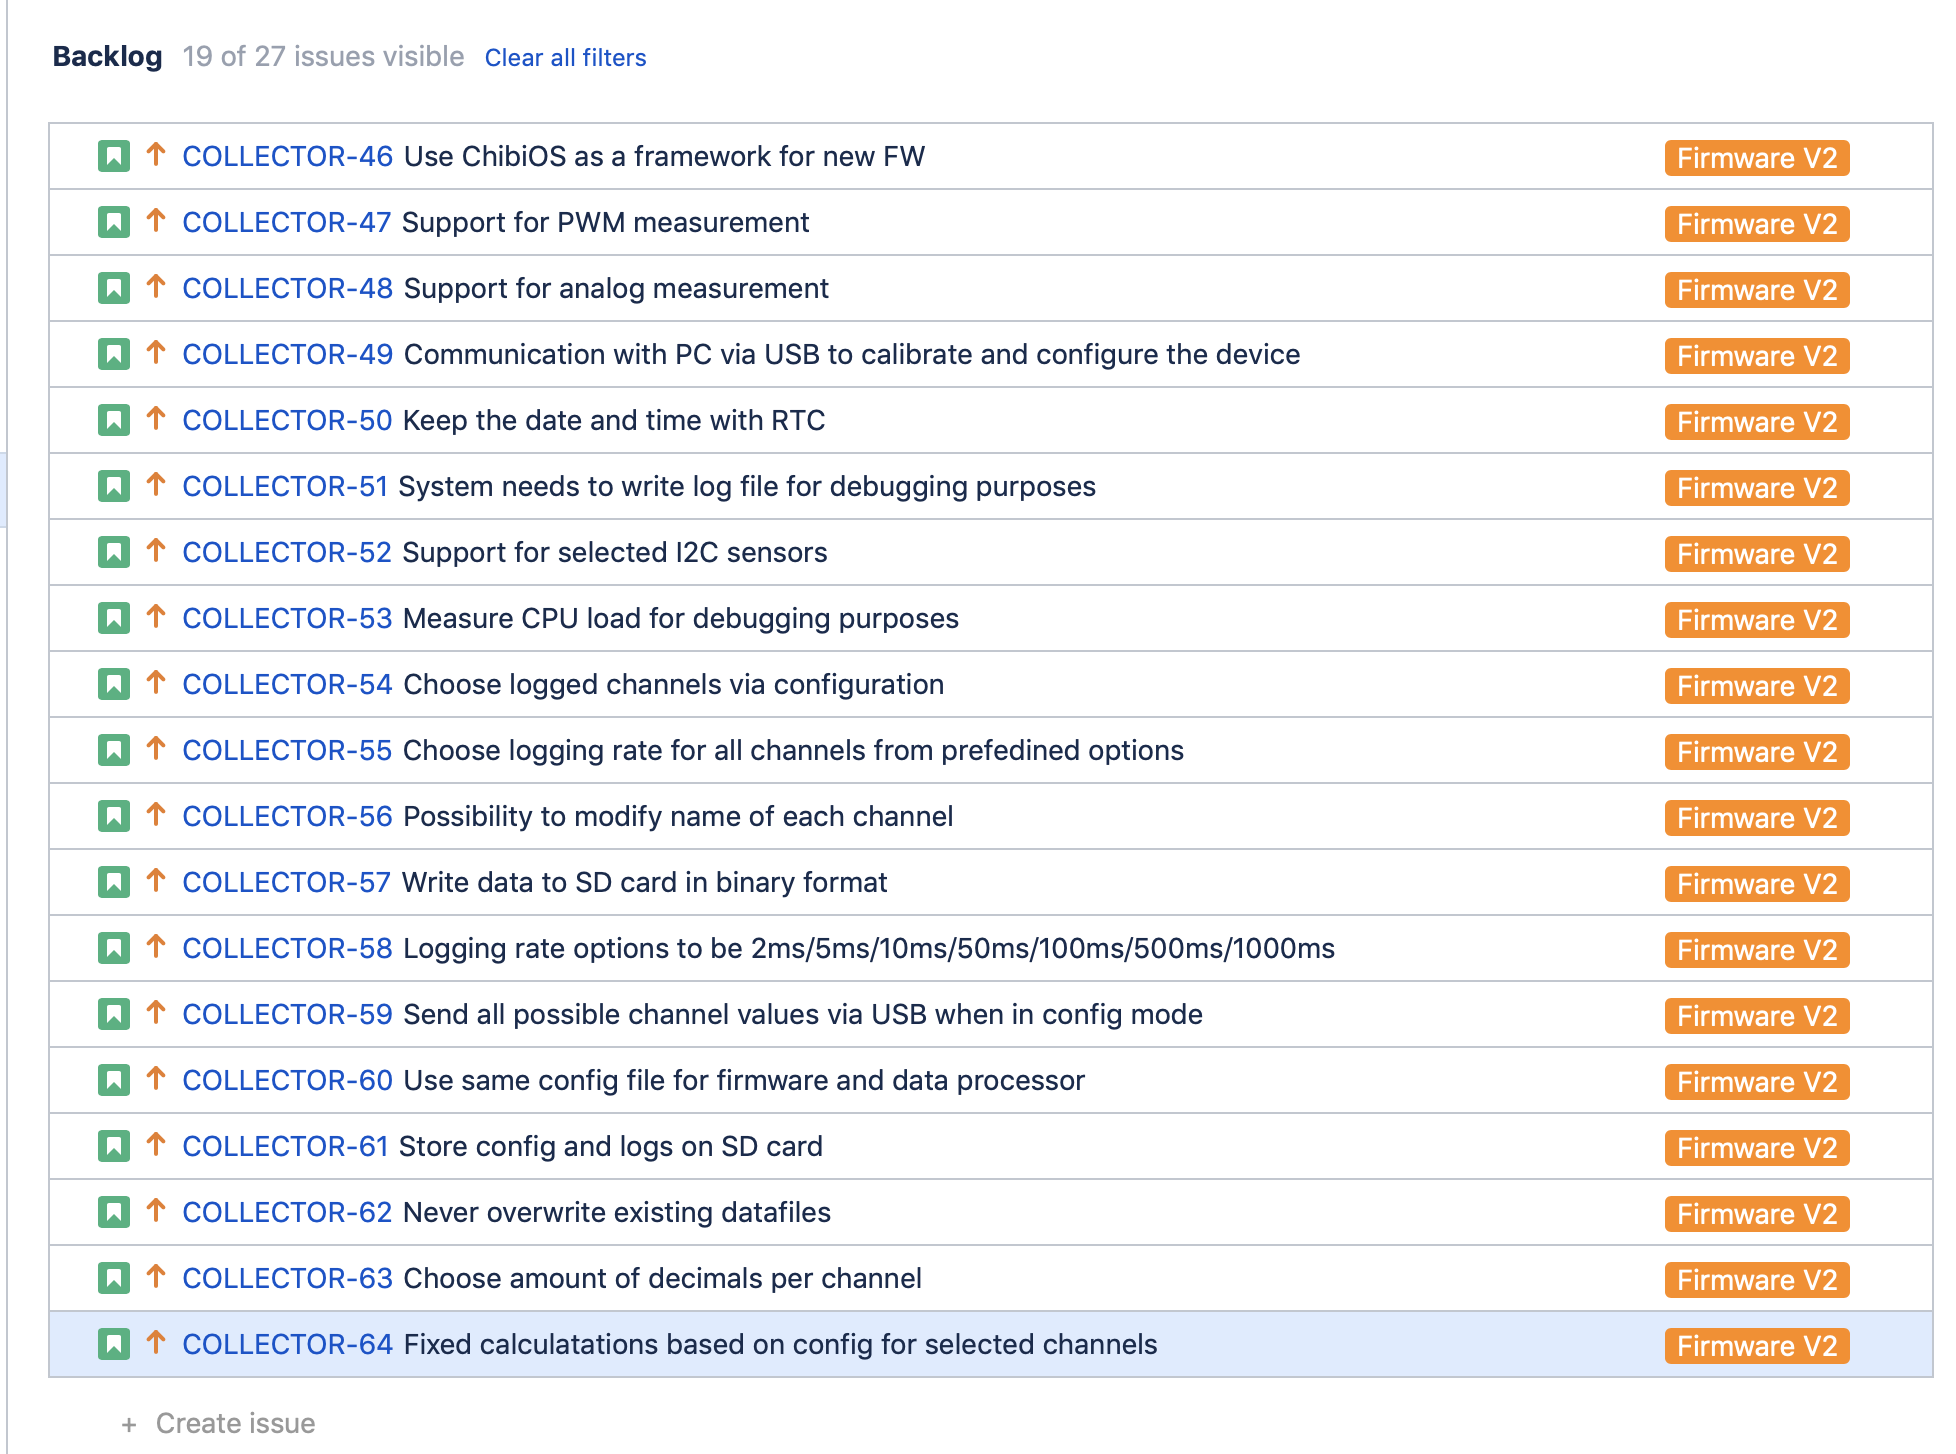
Screenshot of backlog
![]()
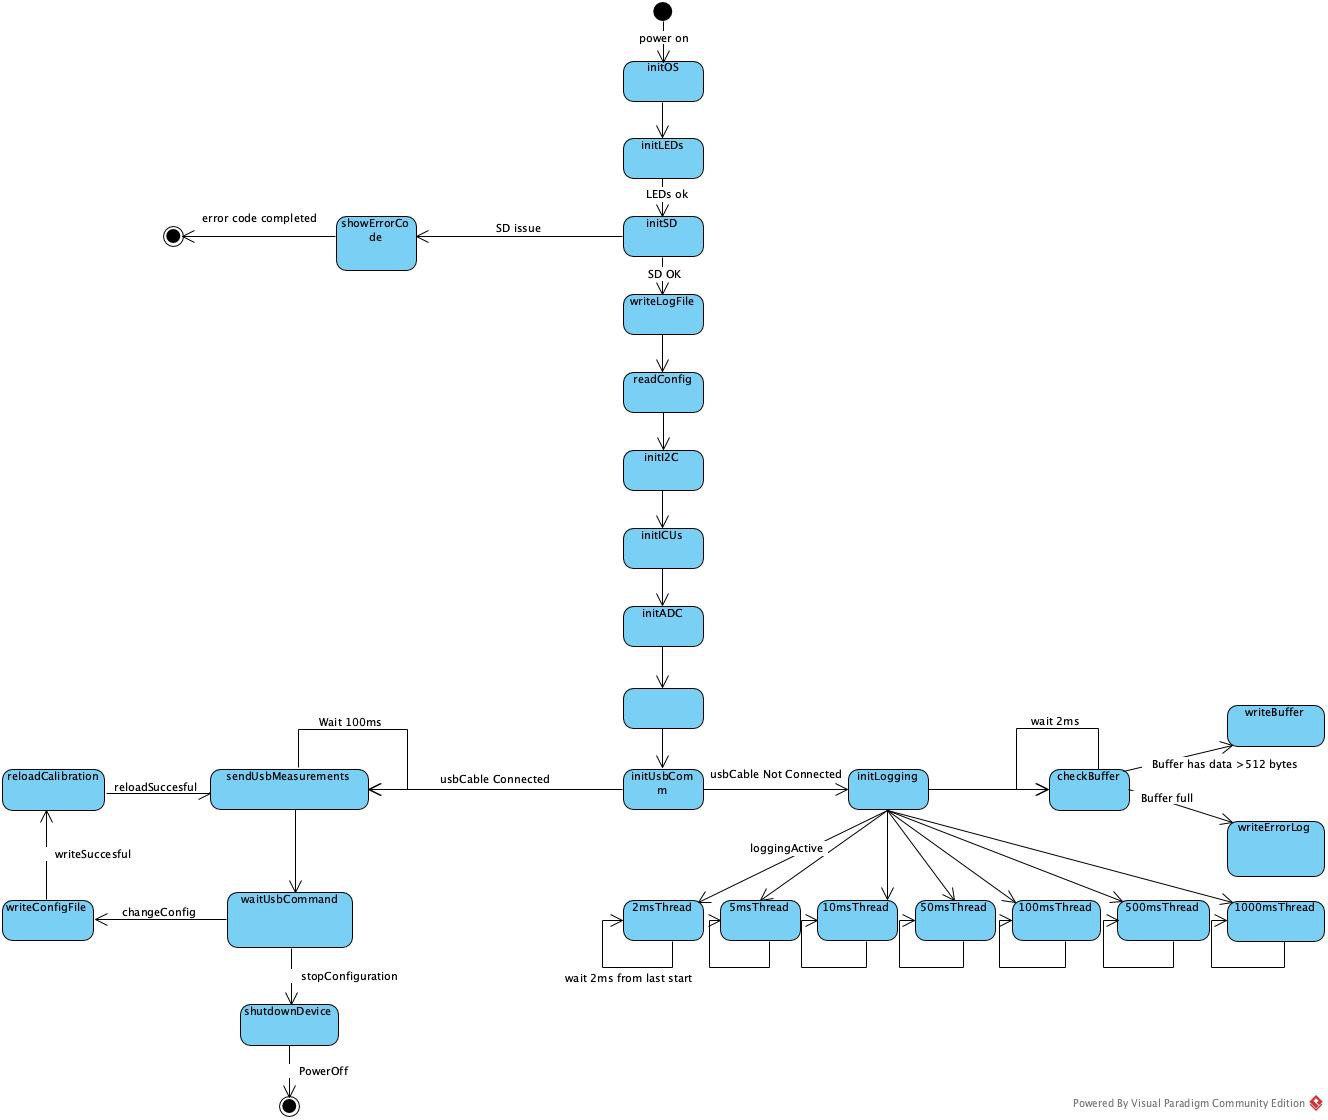
First draft of high level design
![]()
-
Failed full version
12/17/2018 at 21:35 • 0 commentsA bit of brake from updating as I have had some work and holiday trips. After the first version made completely by myself which had fairly limited amount of inputs, I decided to go for the full version with my own design.
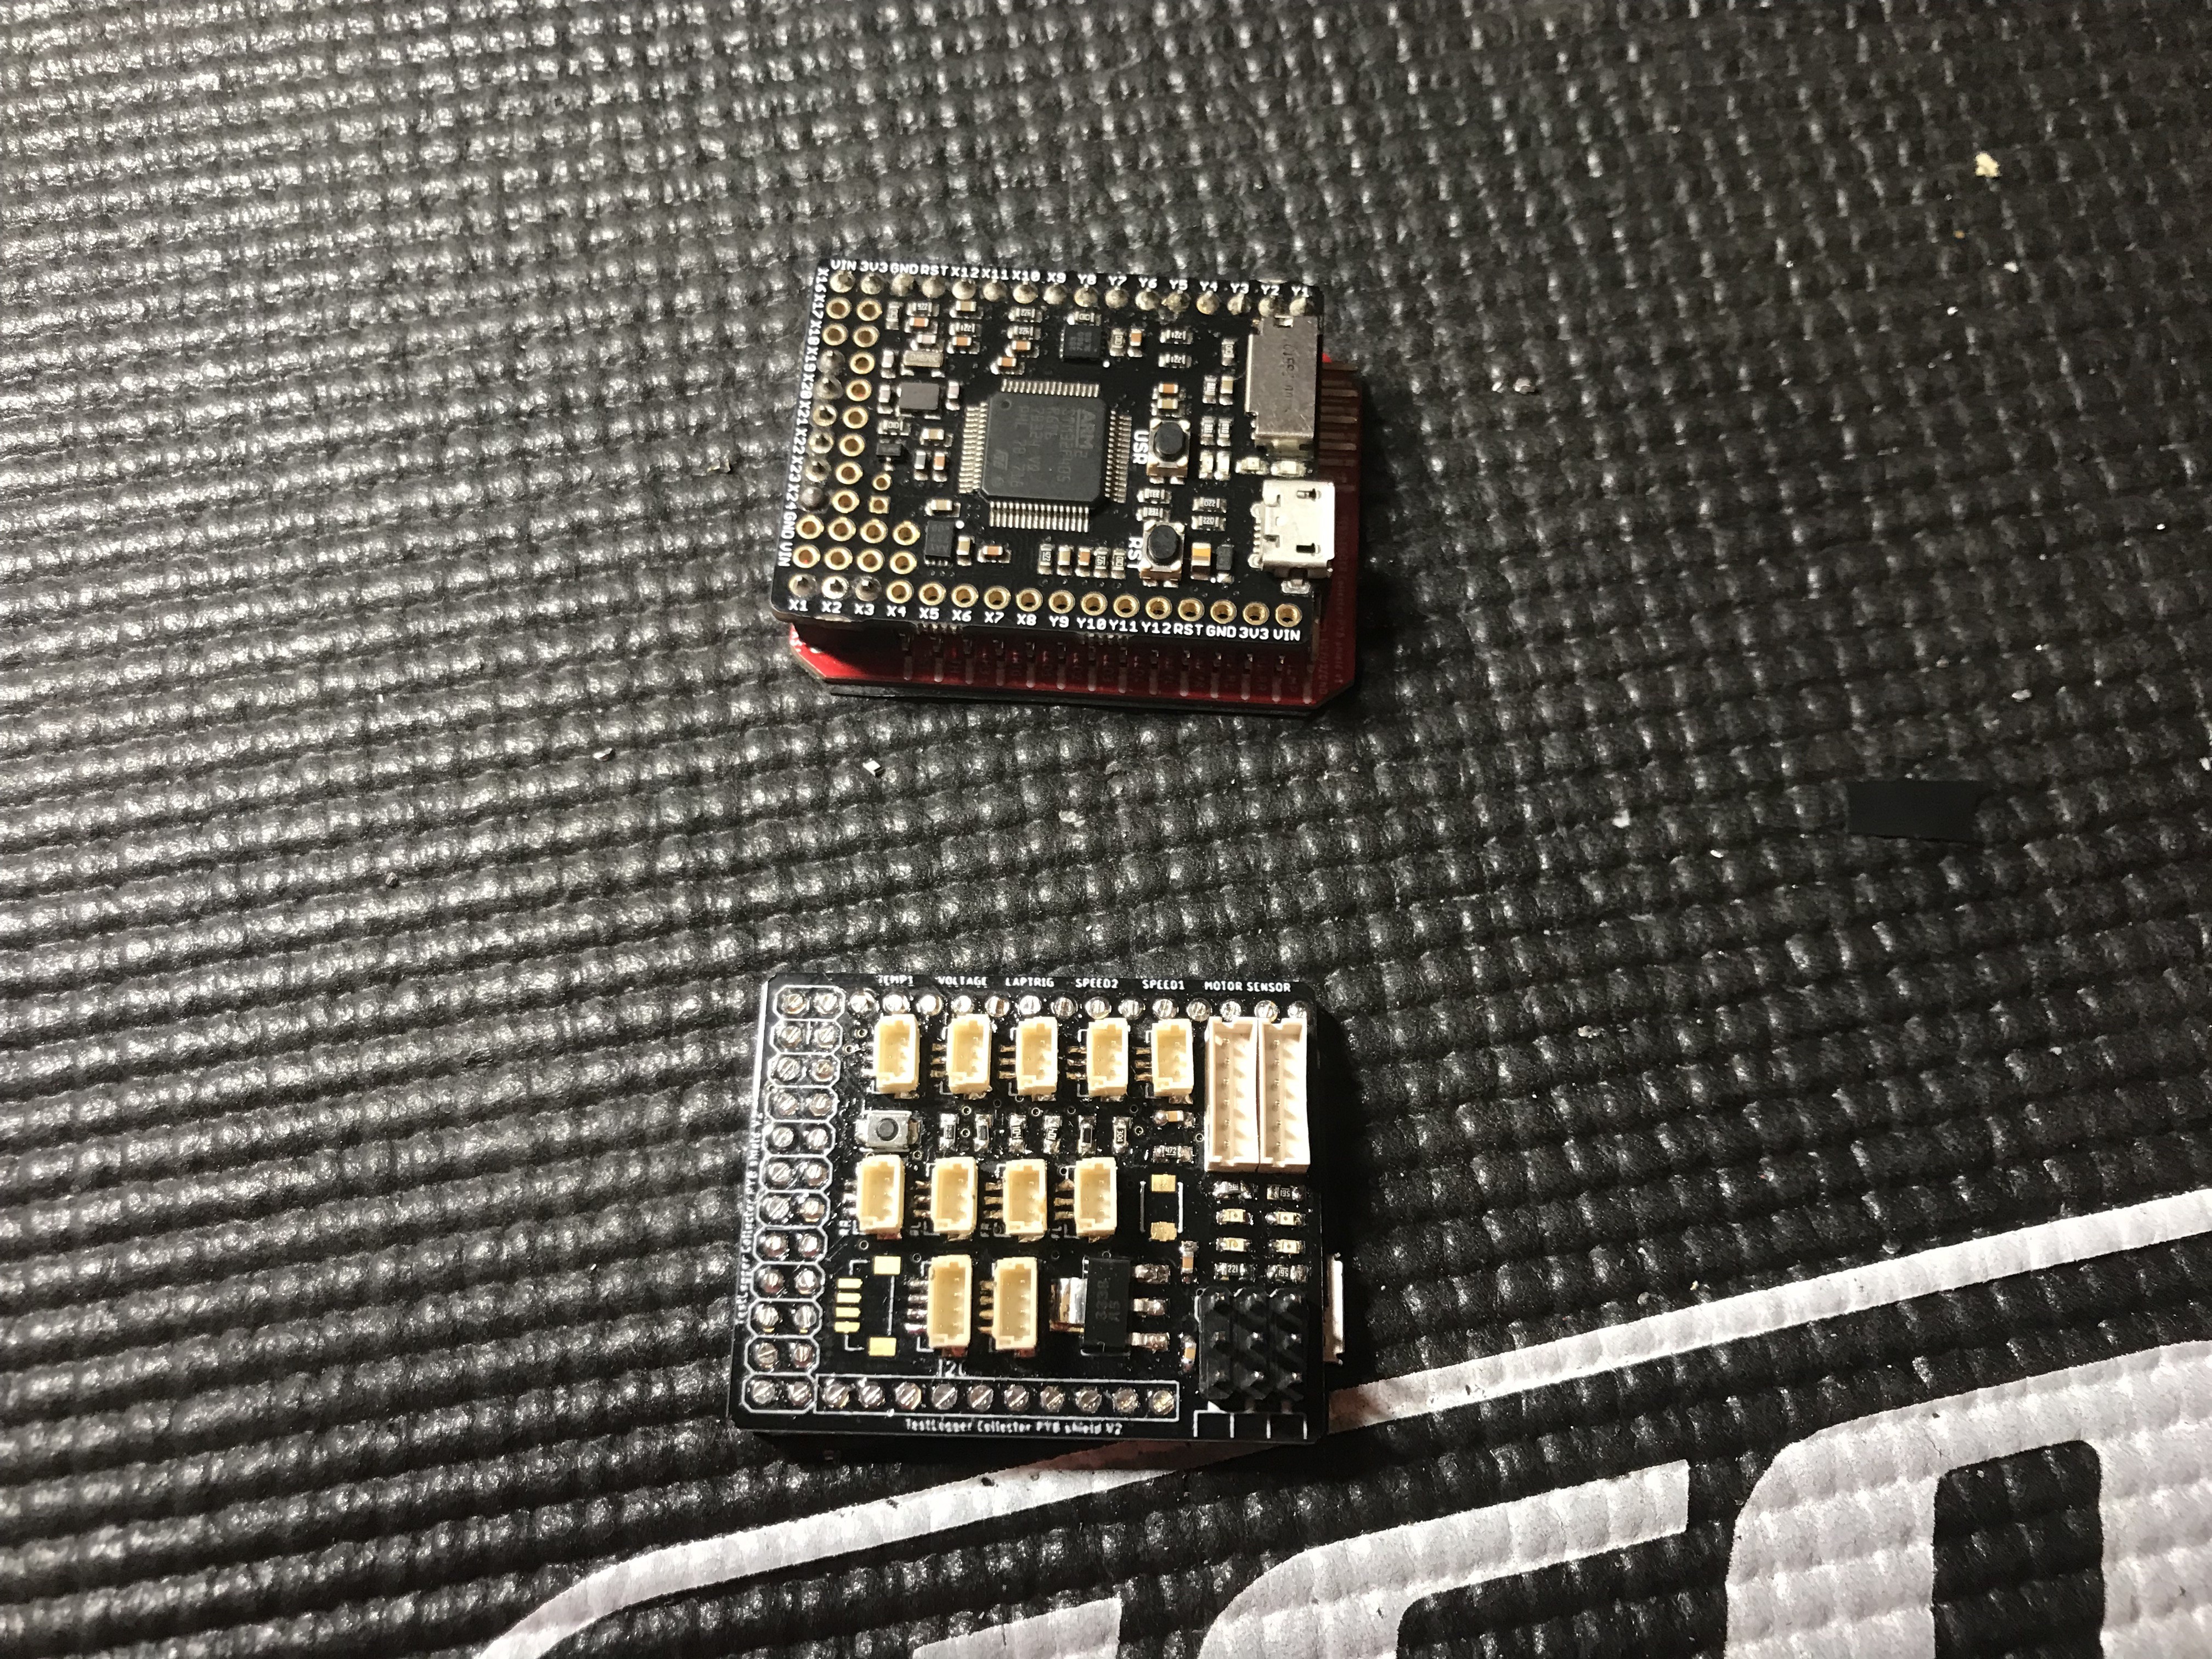
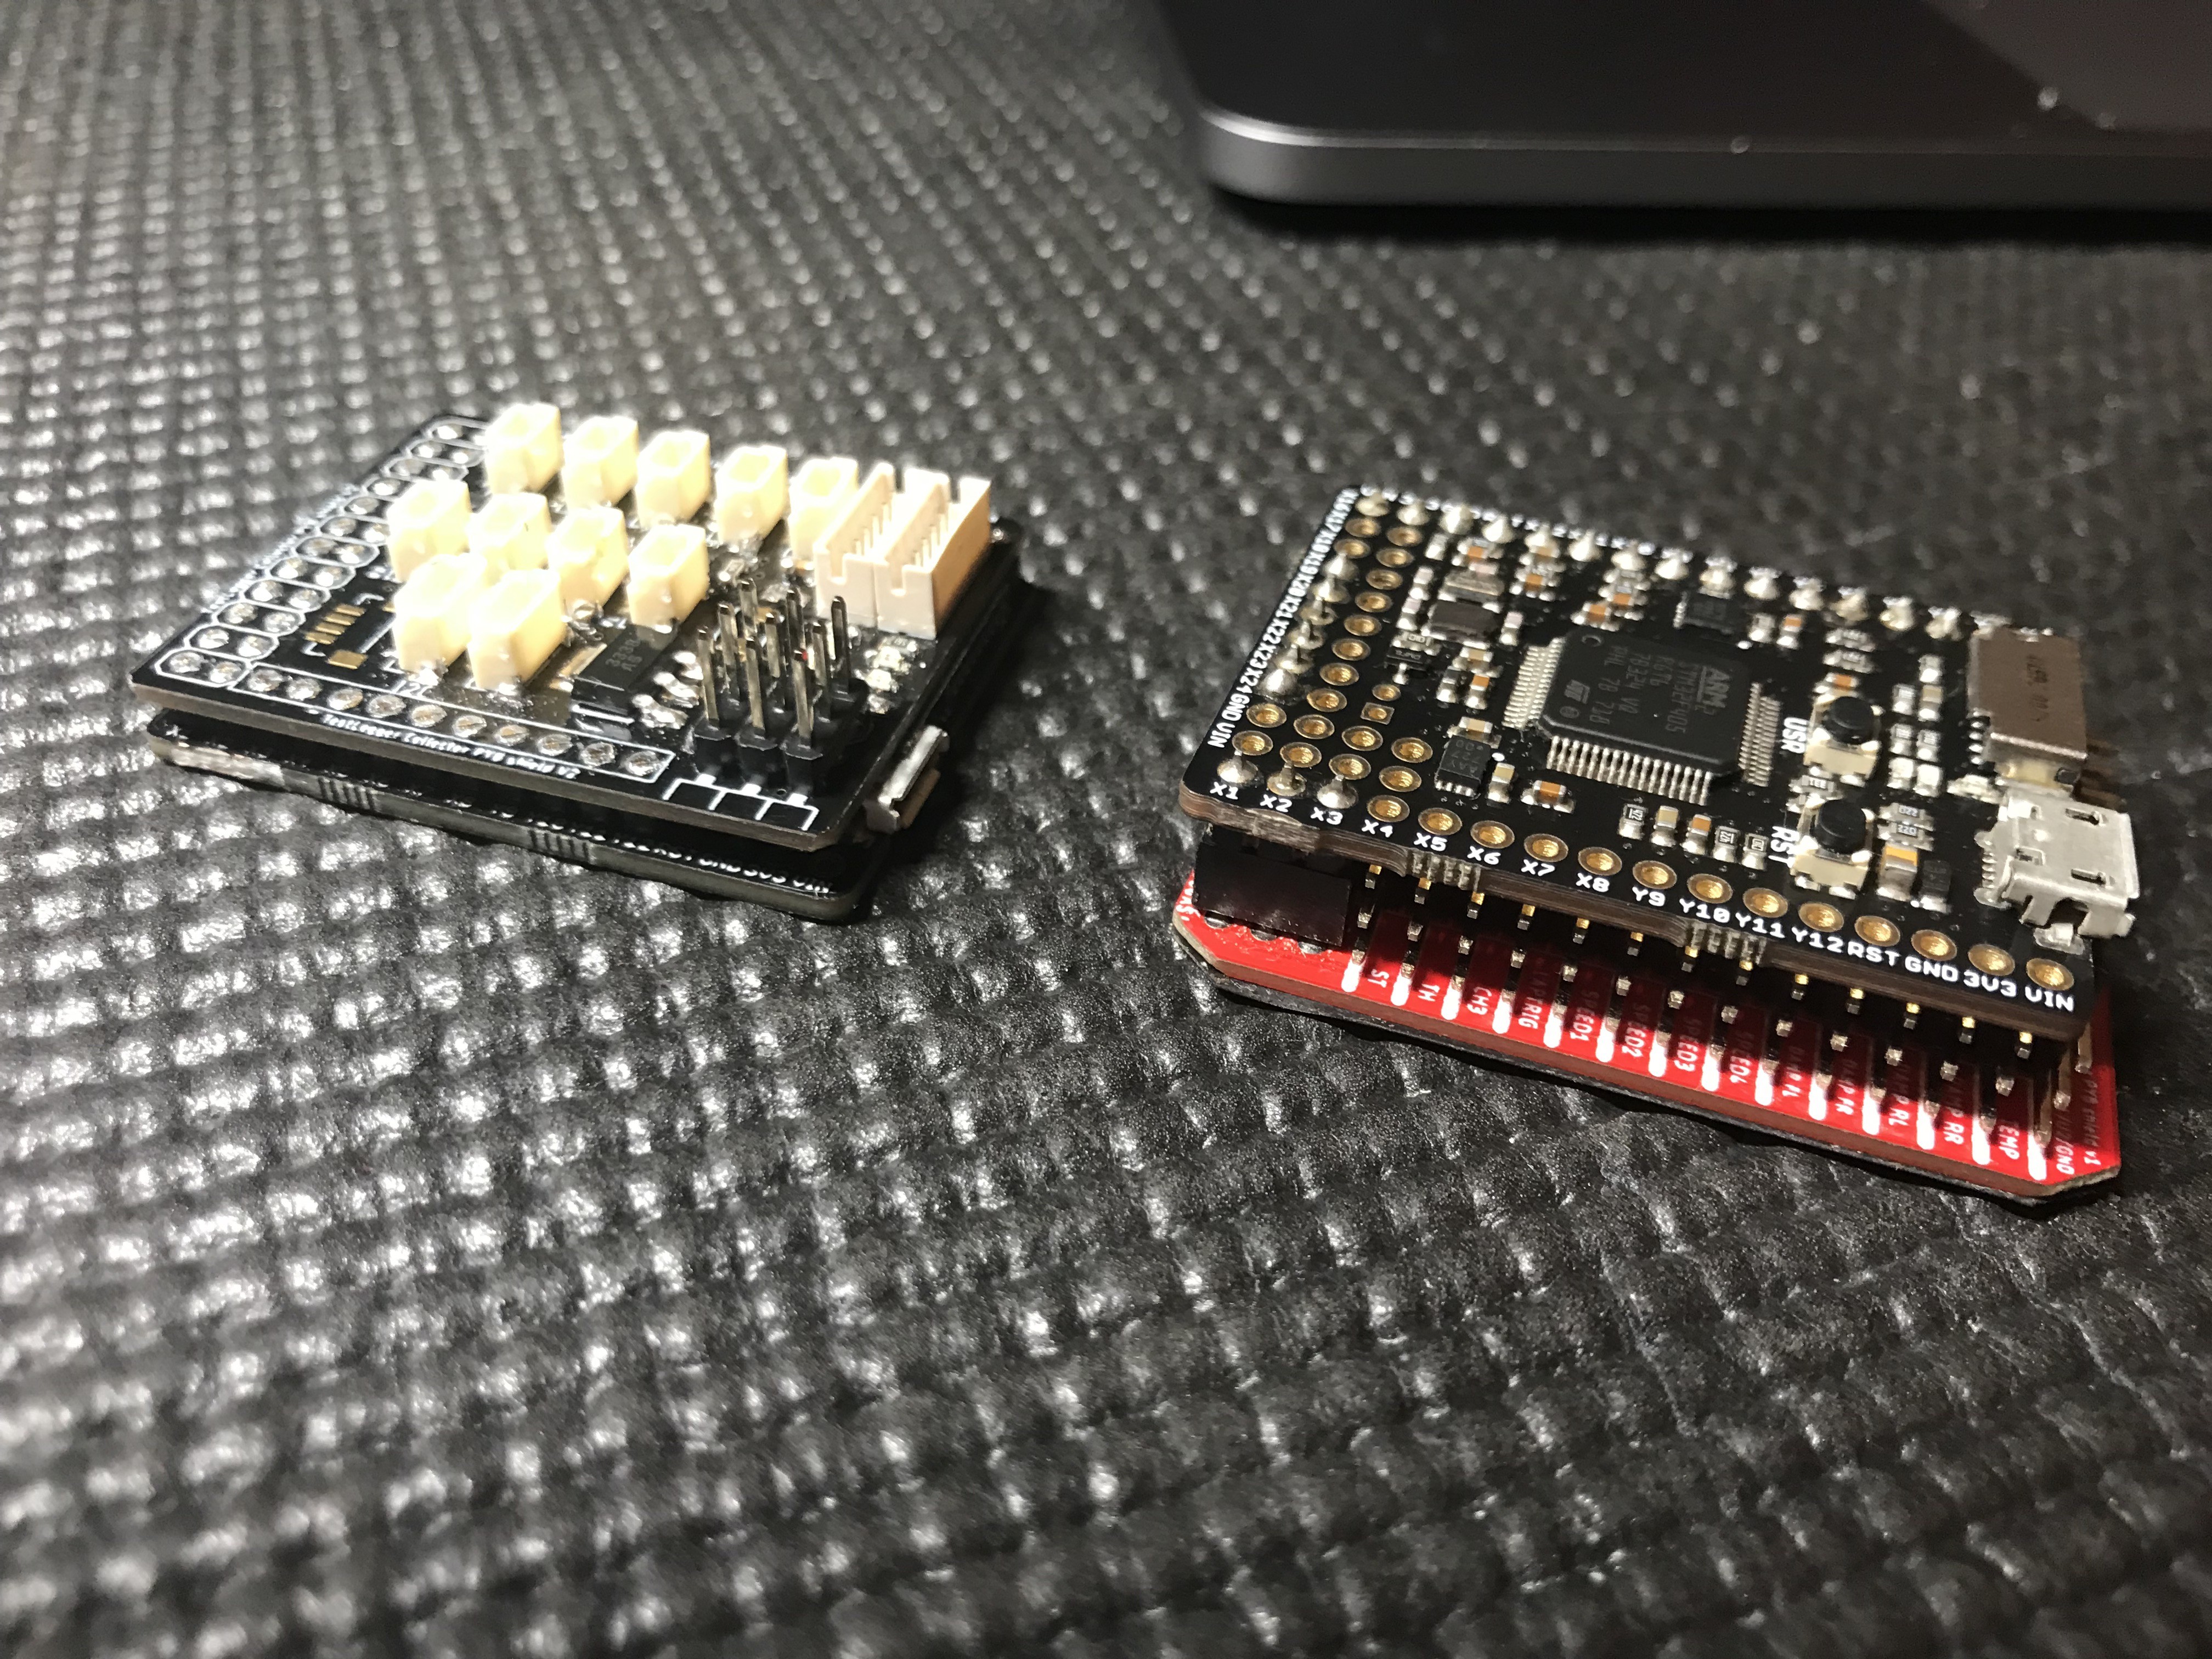
Base guideline for the design was same inputs as I had for PYB shield with much smaller area covered. Usually the height isn't a problem but area used is a big issue. I decided to to with 2 PCBs stacked and connected to together with three board-to-board connectors.
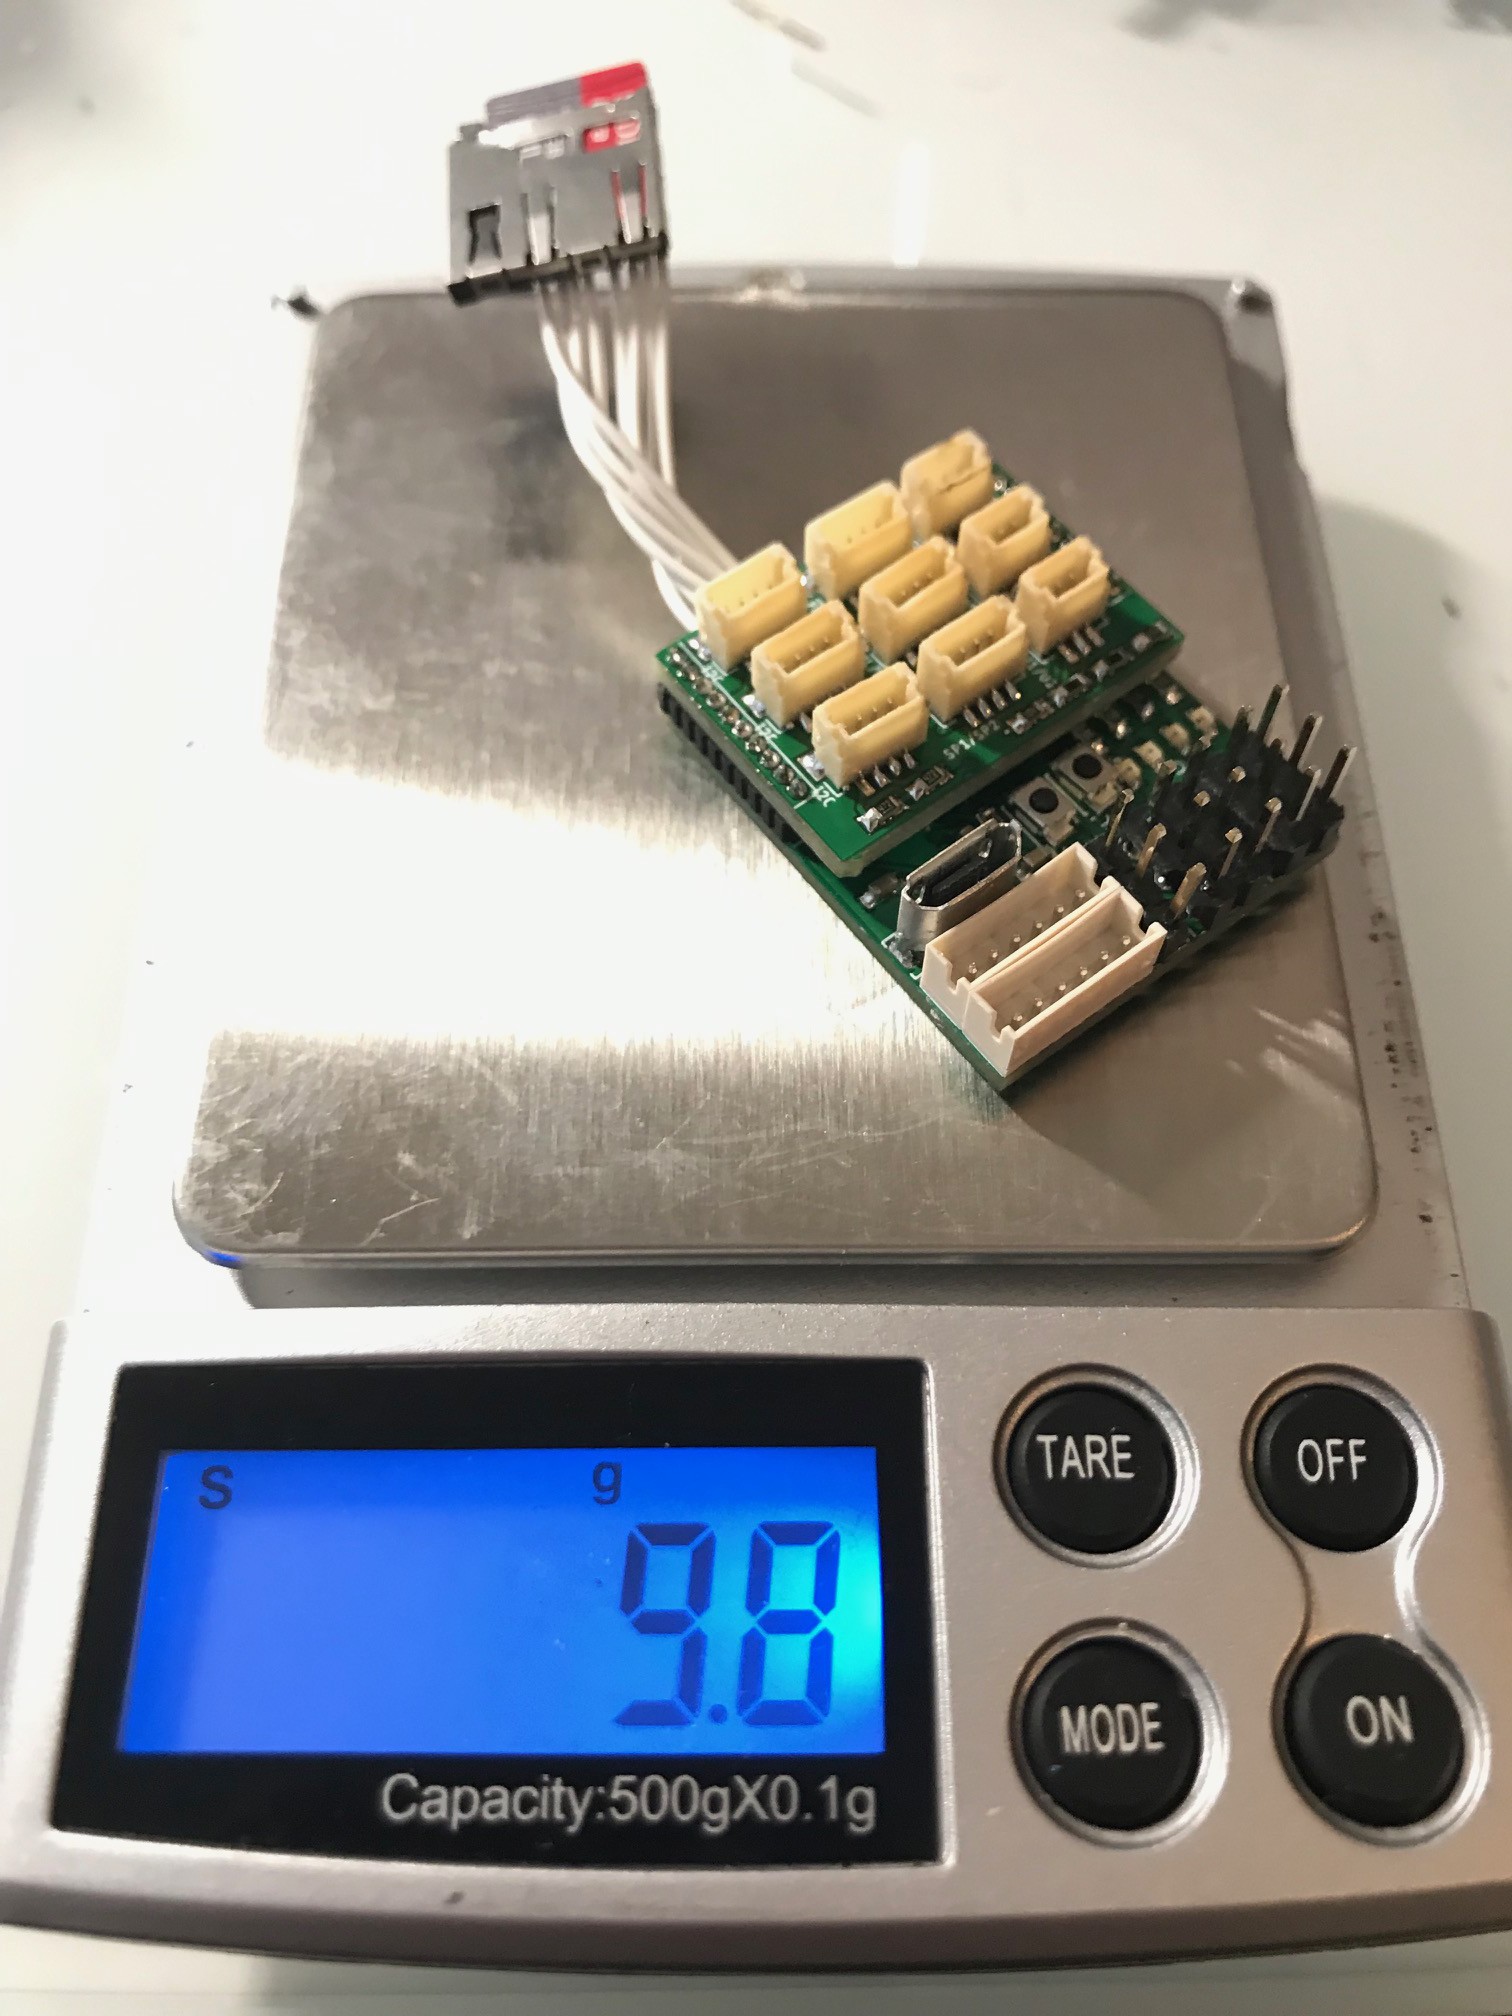
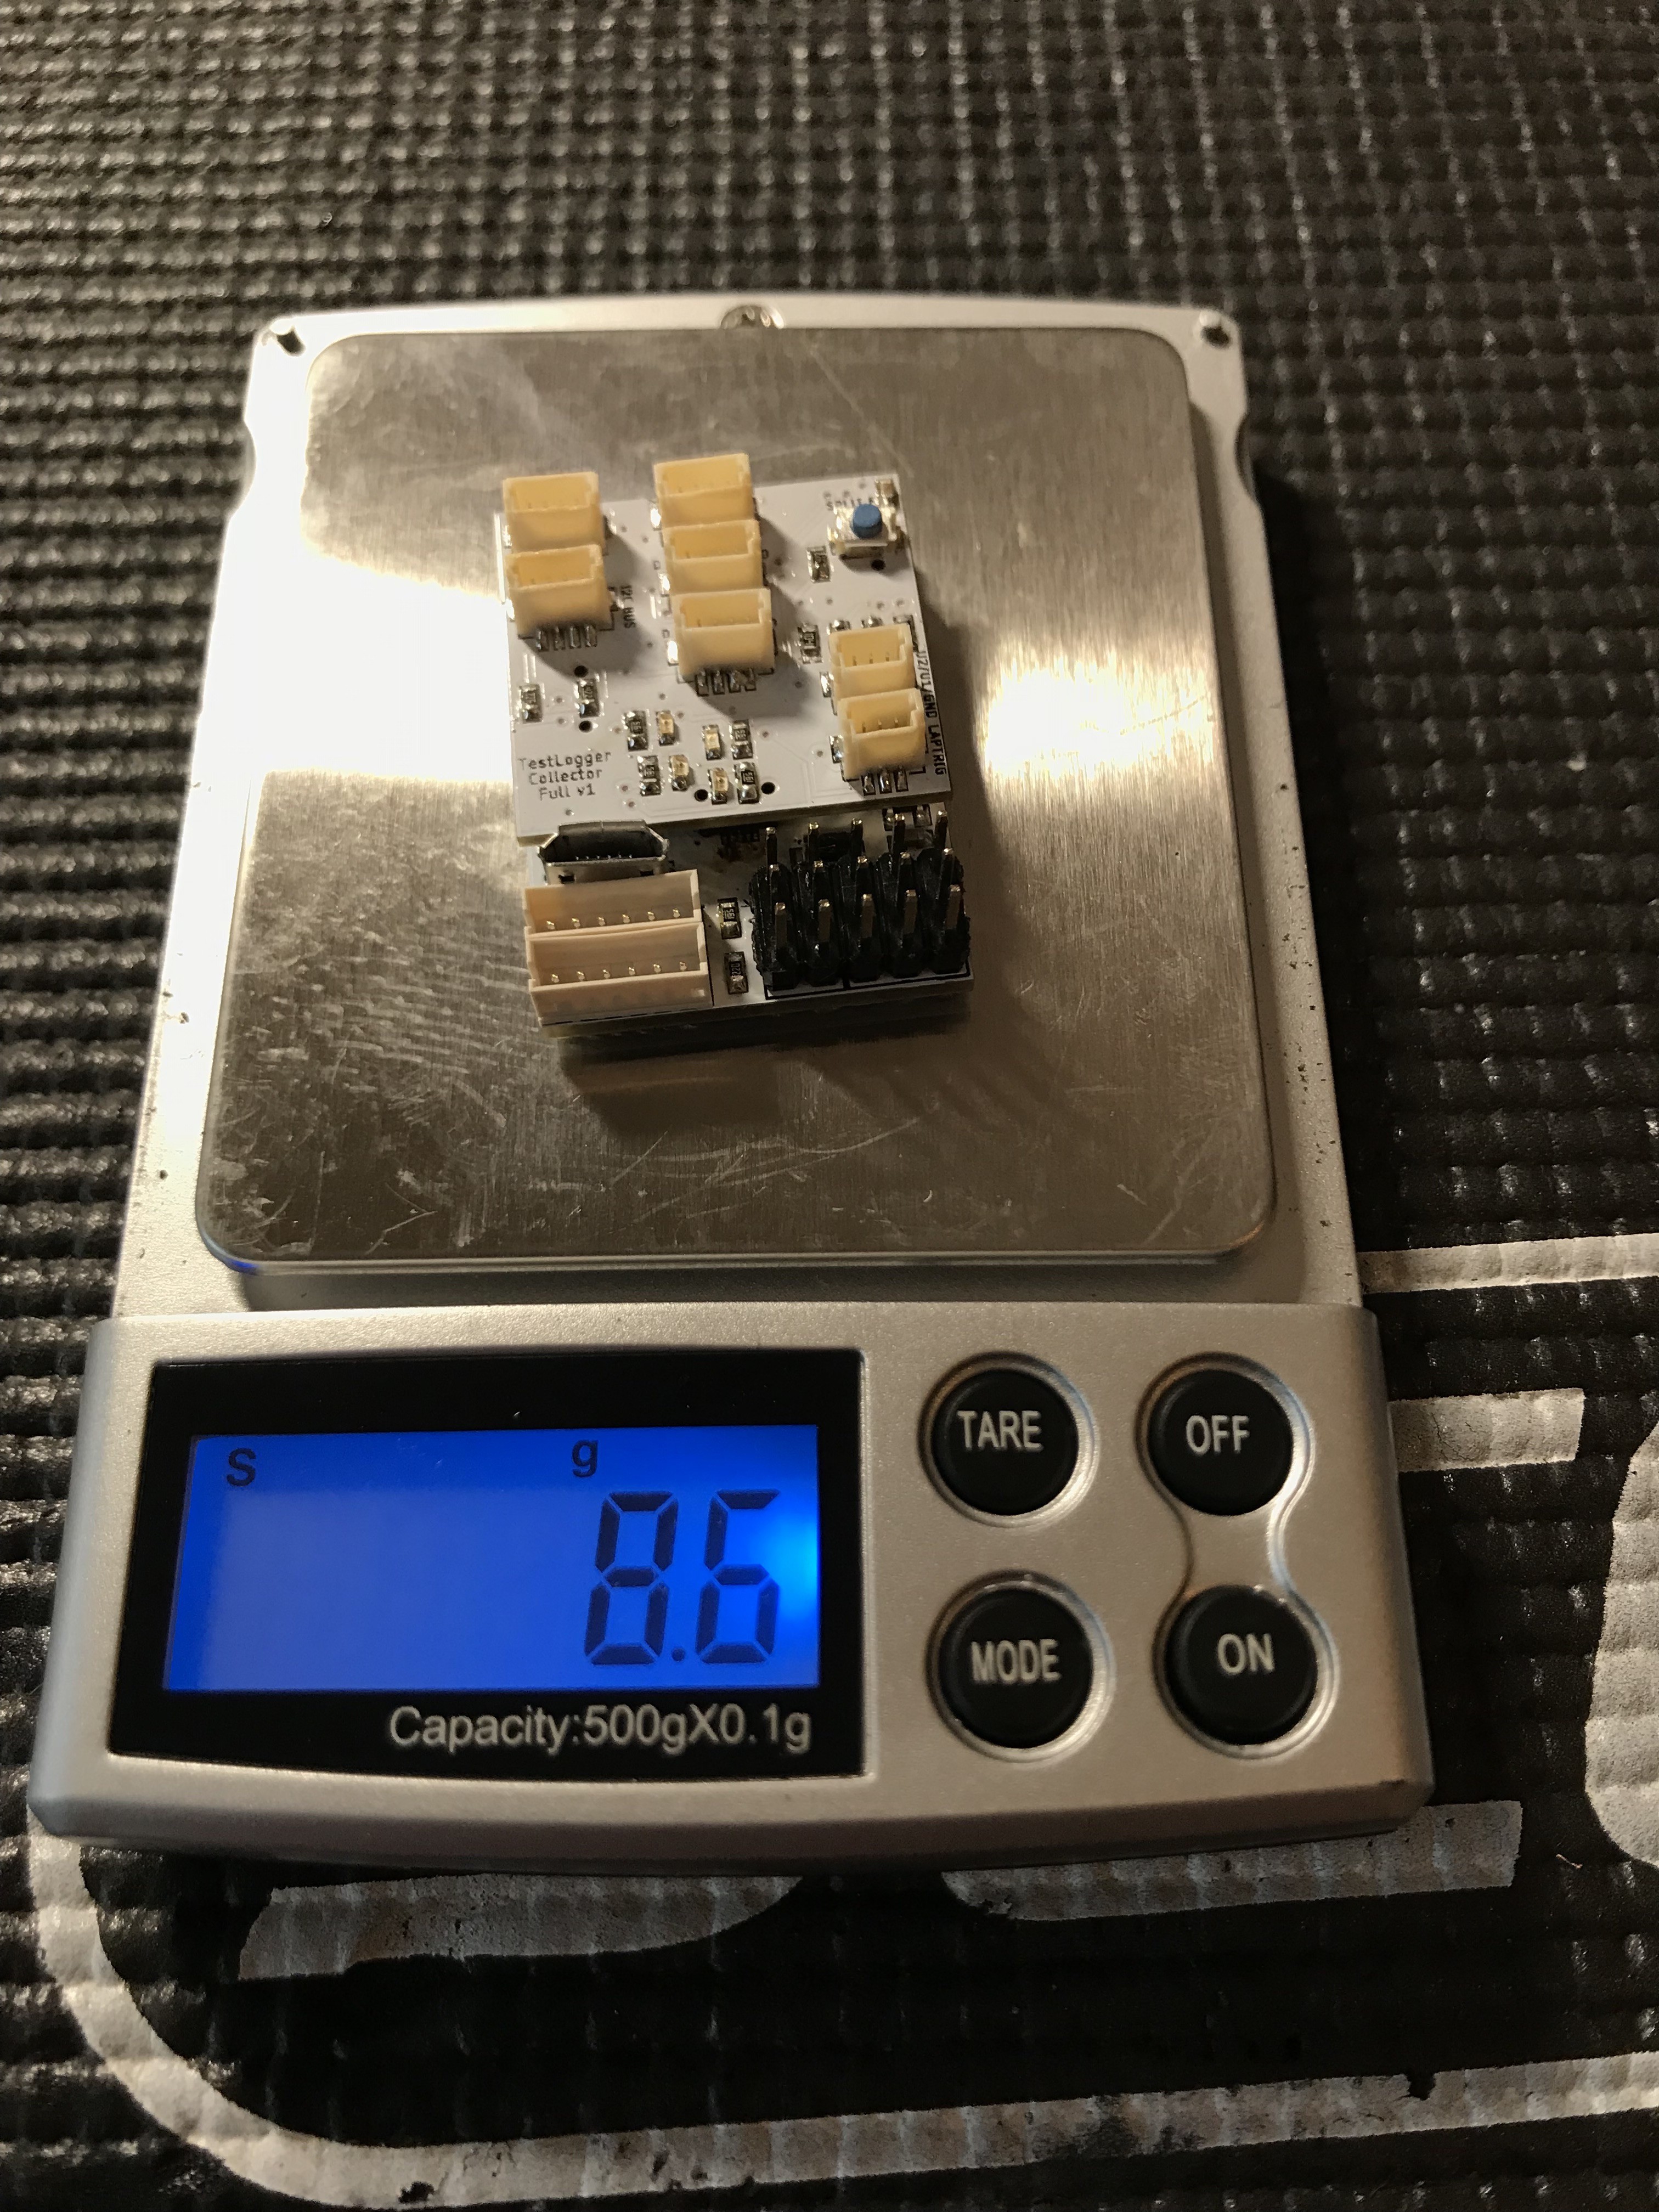
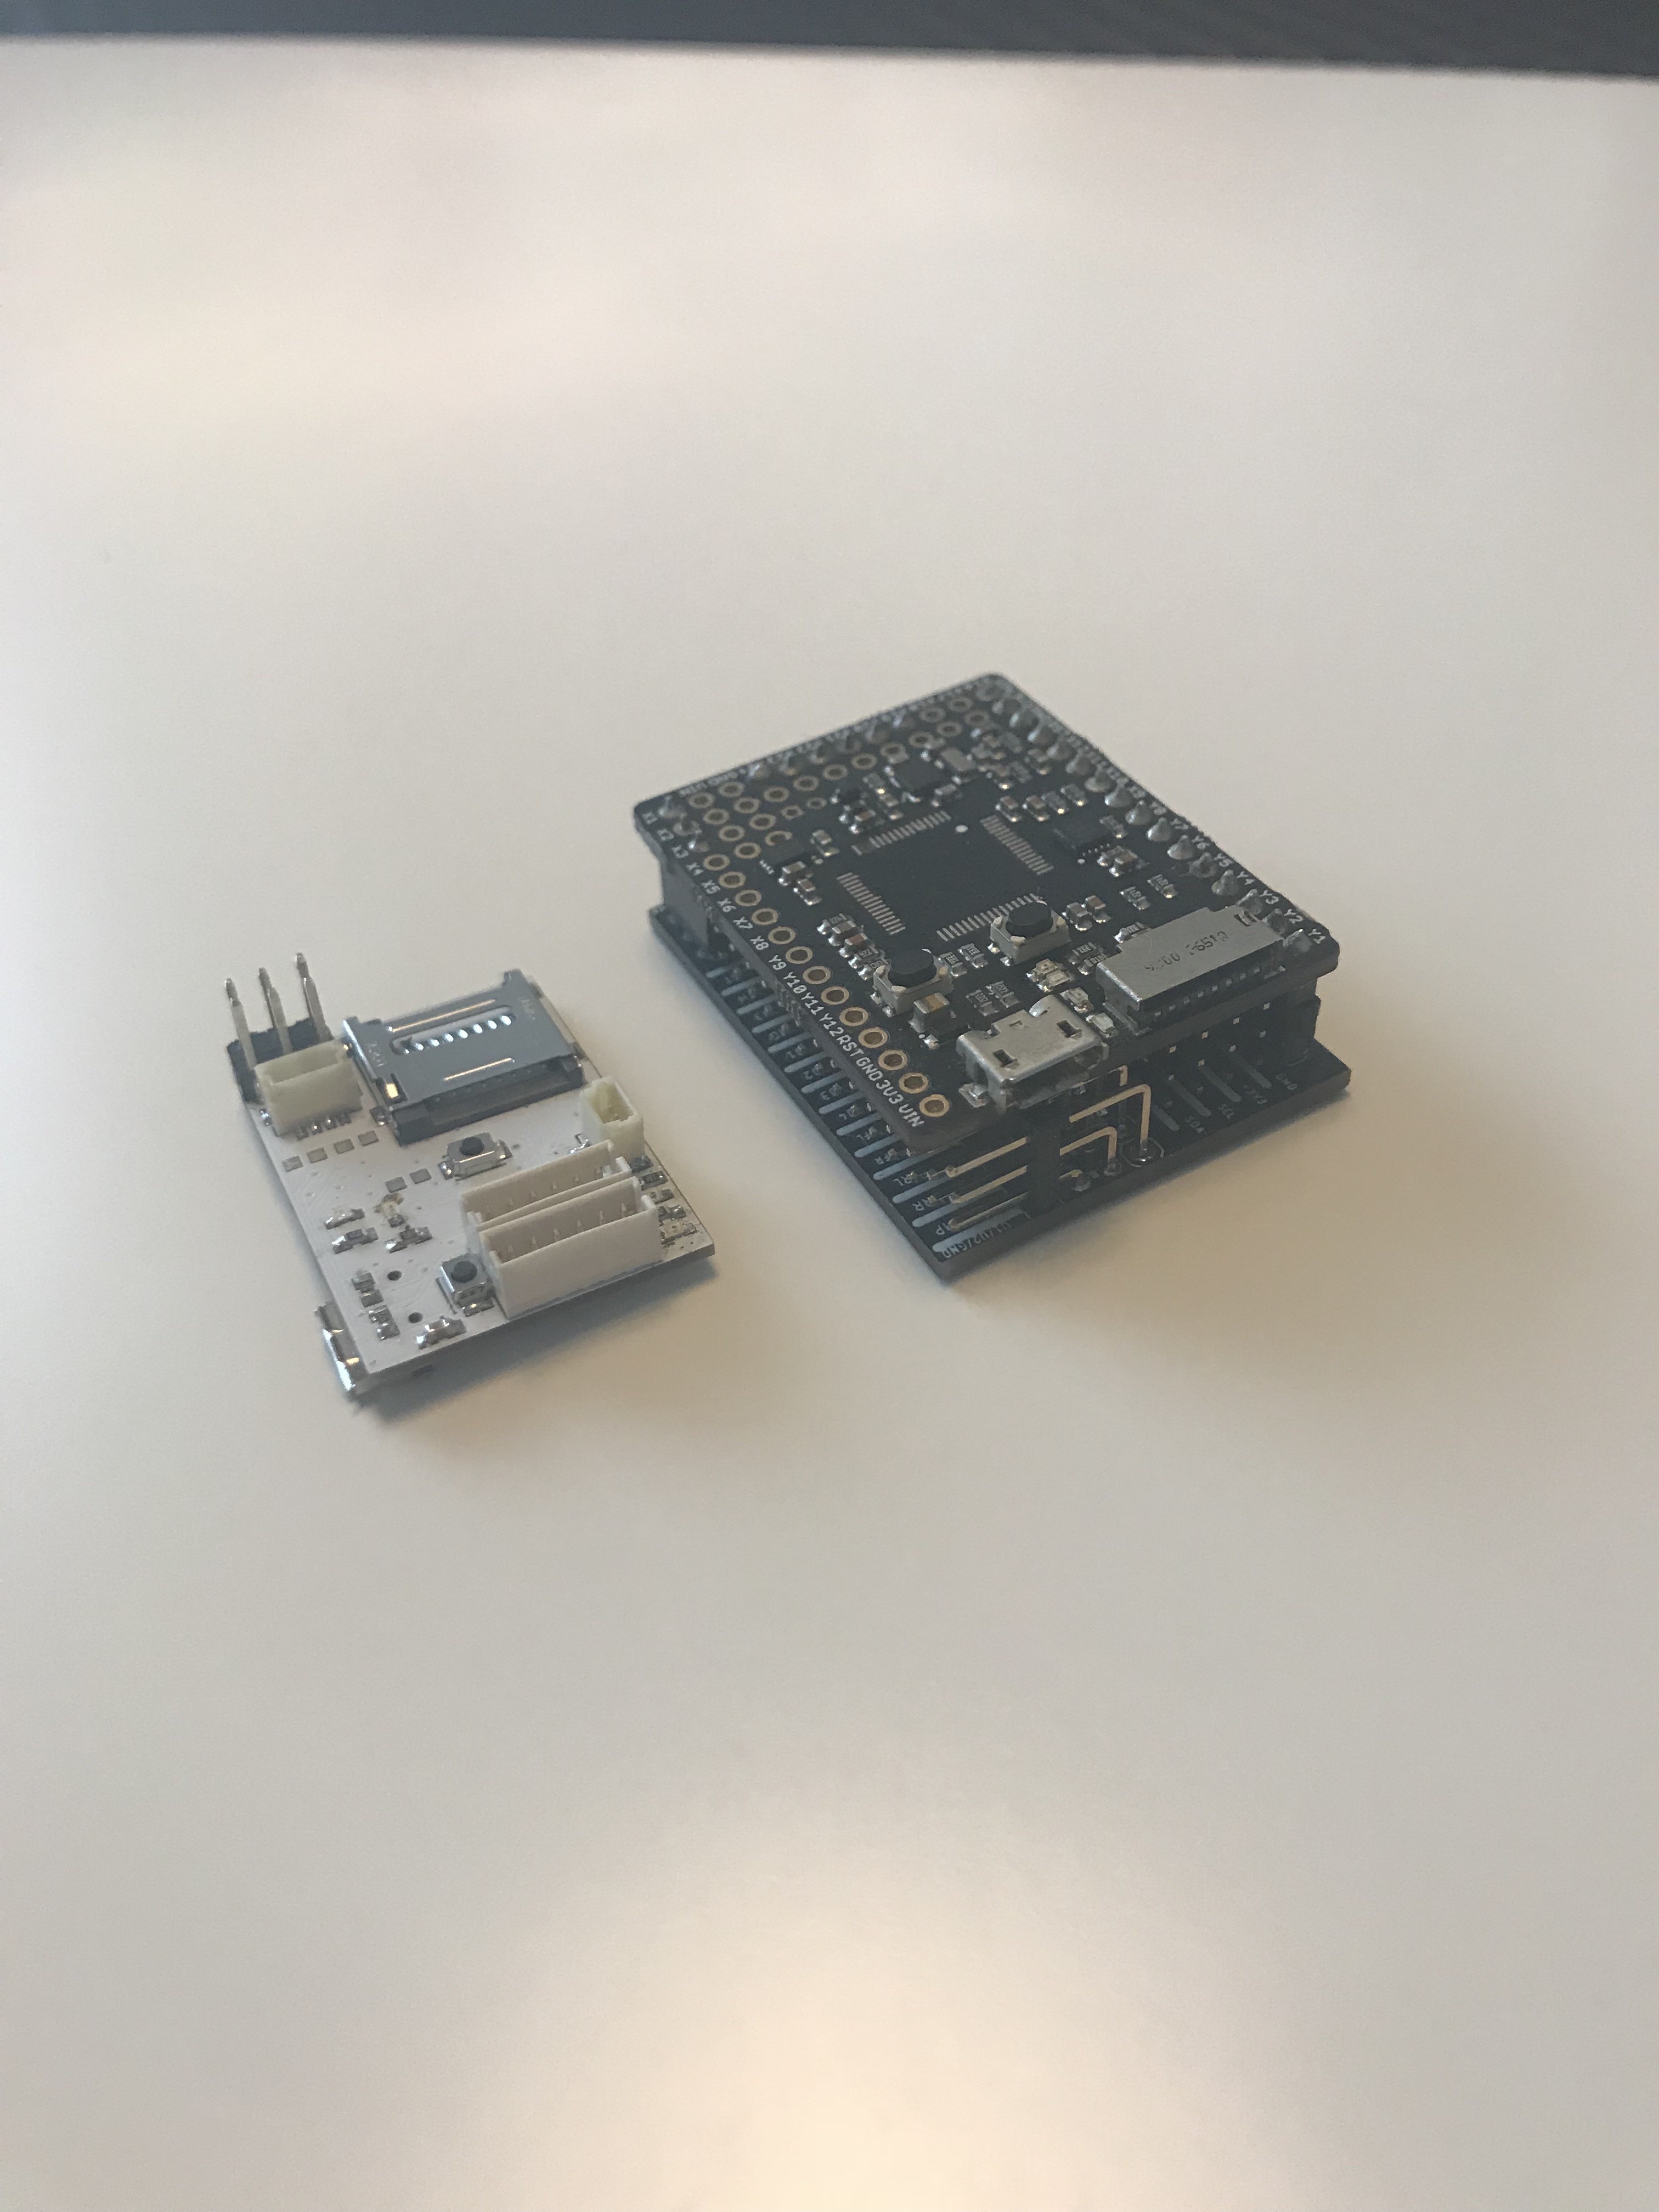
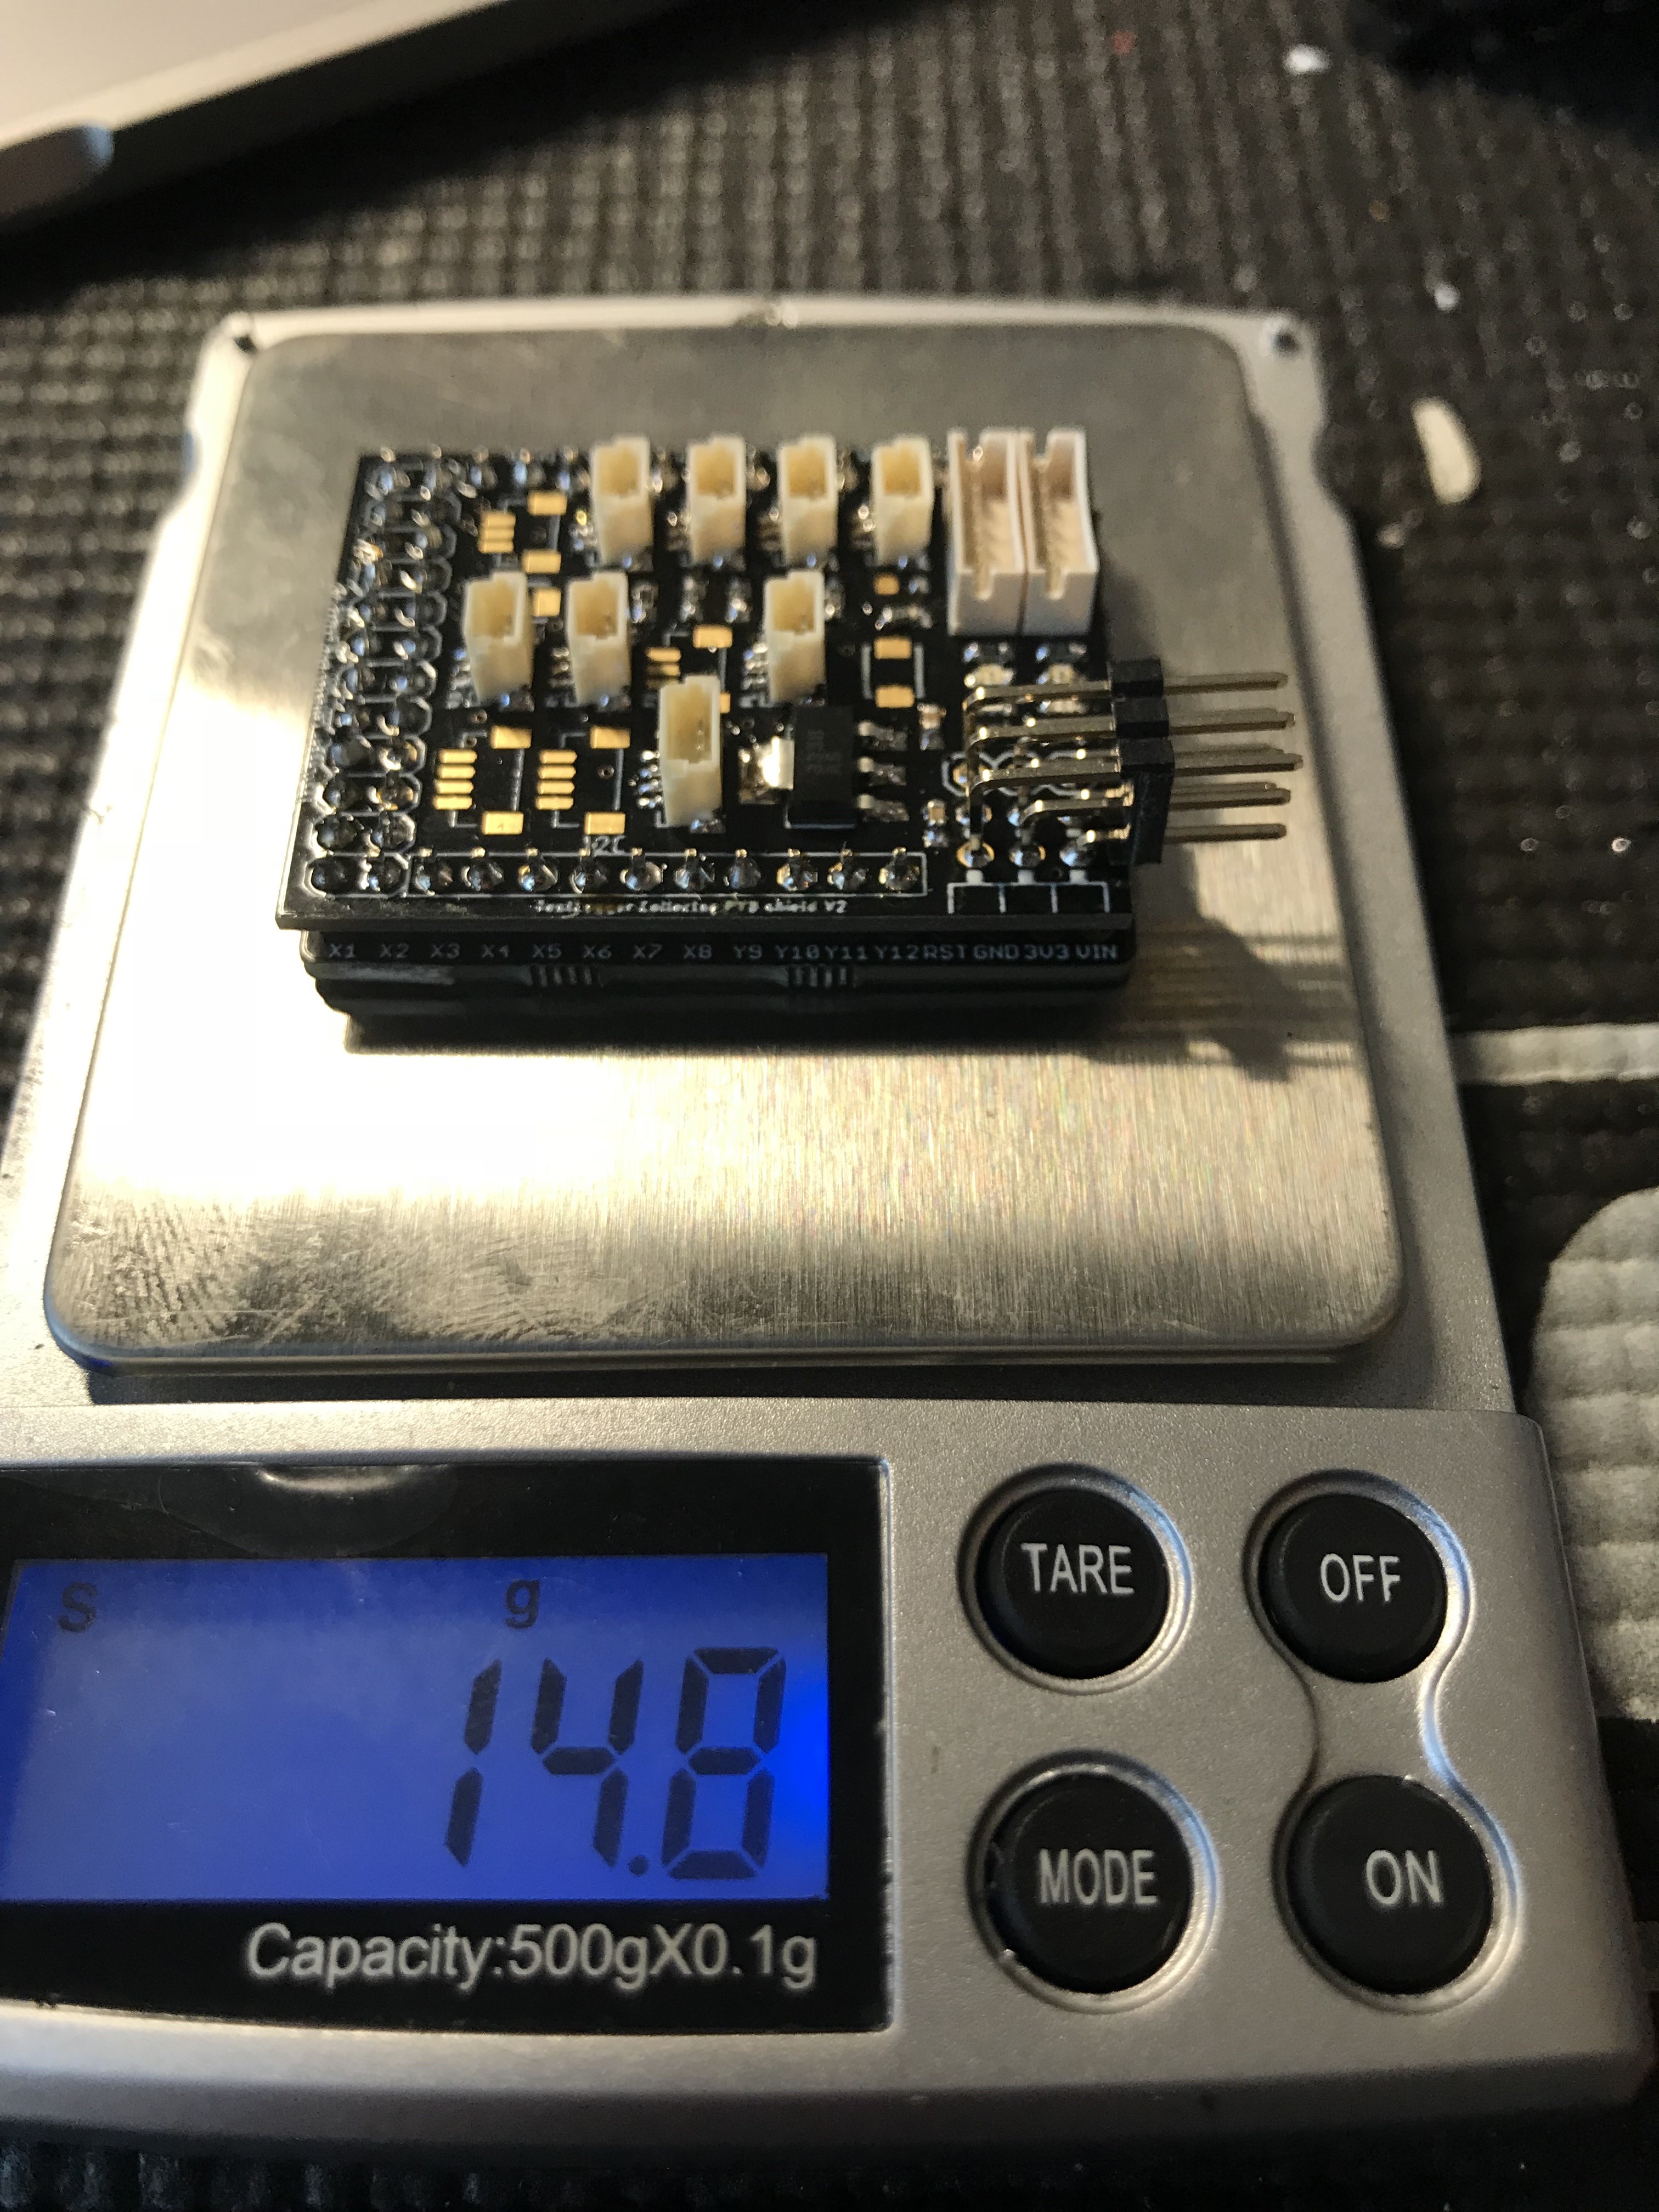
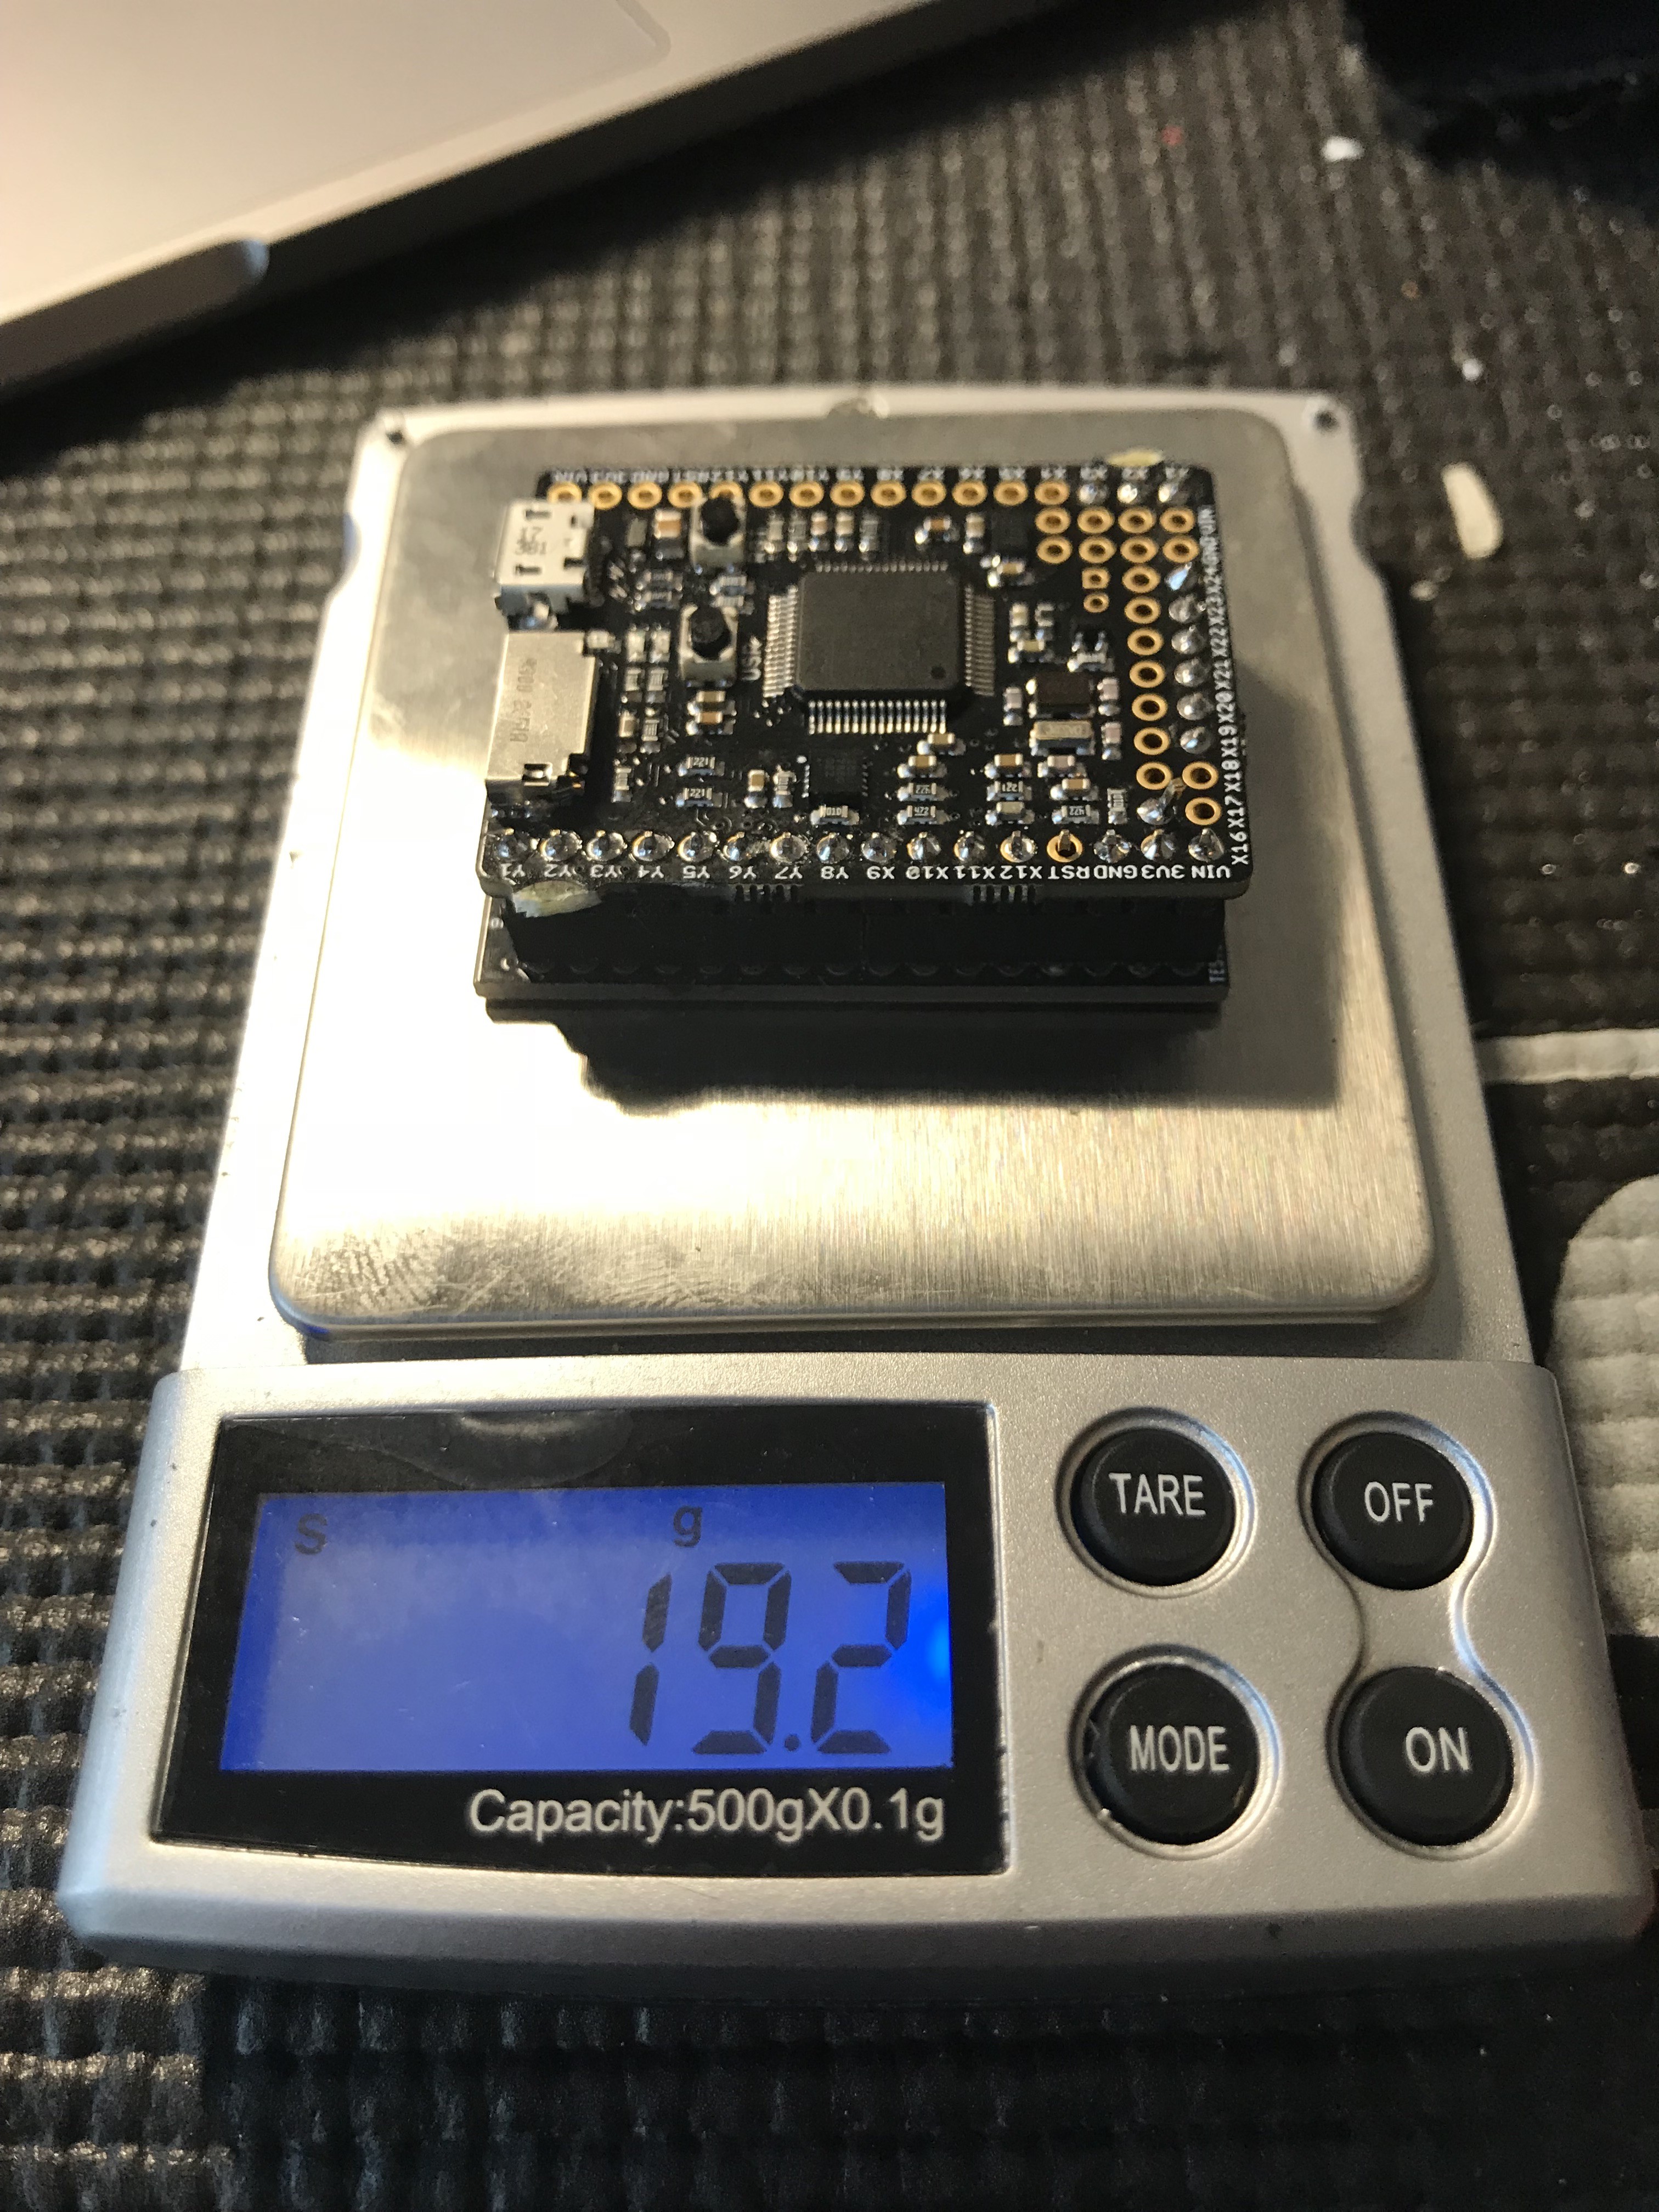
The goals were achieved with a big but. It was almost half of the size compared to PYB shield version and it had the same connectors. Also the weight was surprisingly low as you can see from the picture below. It was almost 10 grams lighter than PYB shield version. The problem was related to connecting the two PCBs together and using the device on car which jumps and get's massive hits. The boards were not sticking together and then everything fails.
---------- more ----------I also noticed few other issues like routing and component placement. I placed too many components on the upper board so I needed more pins to connect the two boards which again took extra space from the board.
![]()
New try with V2
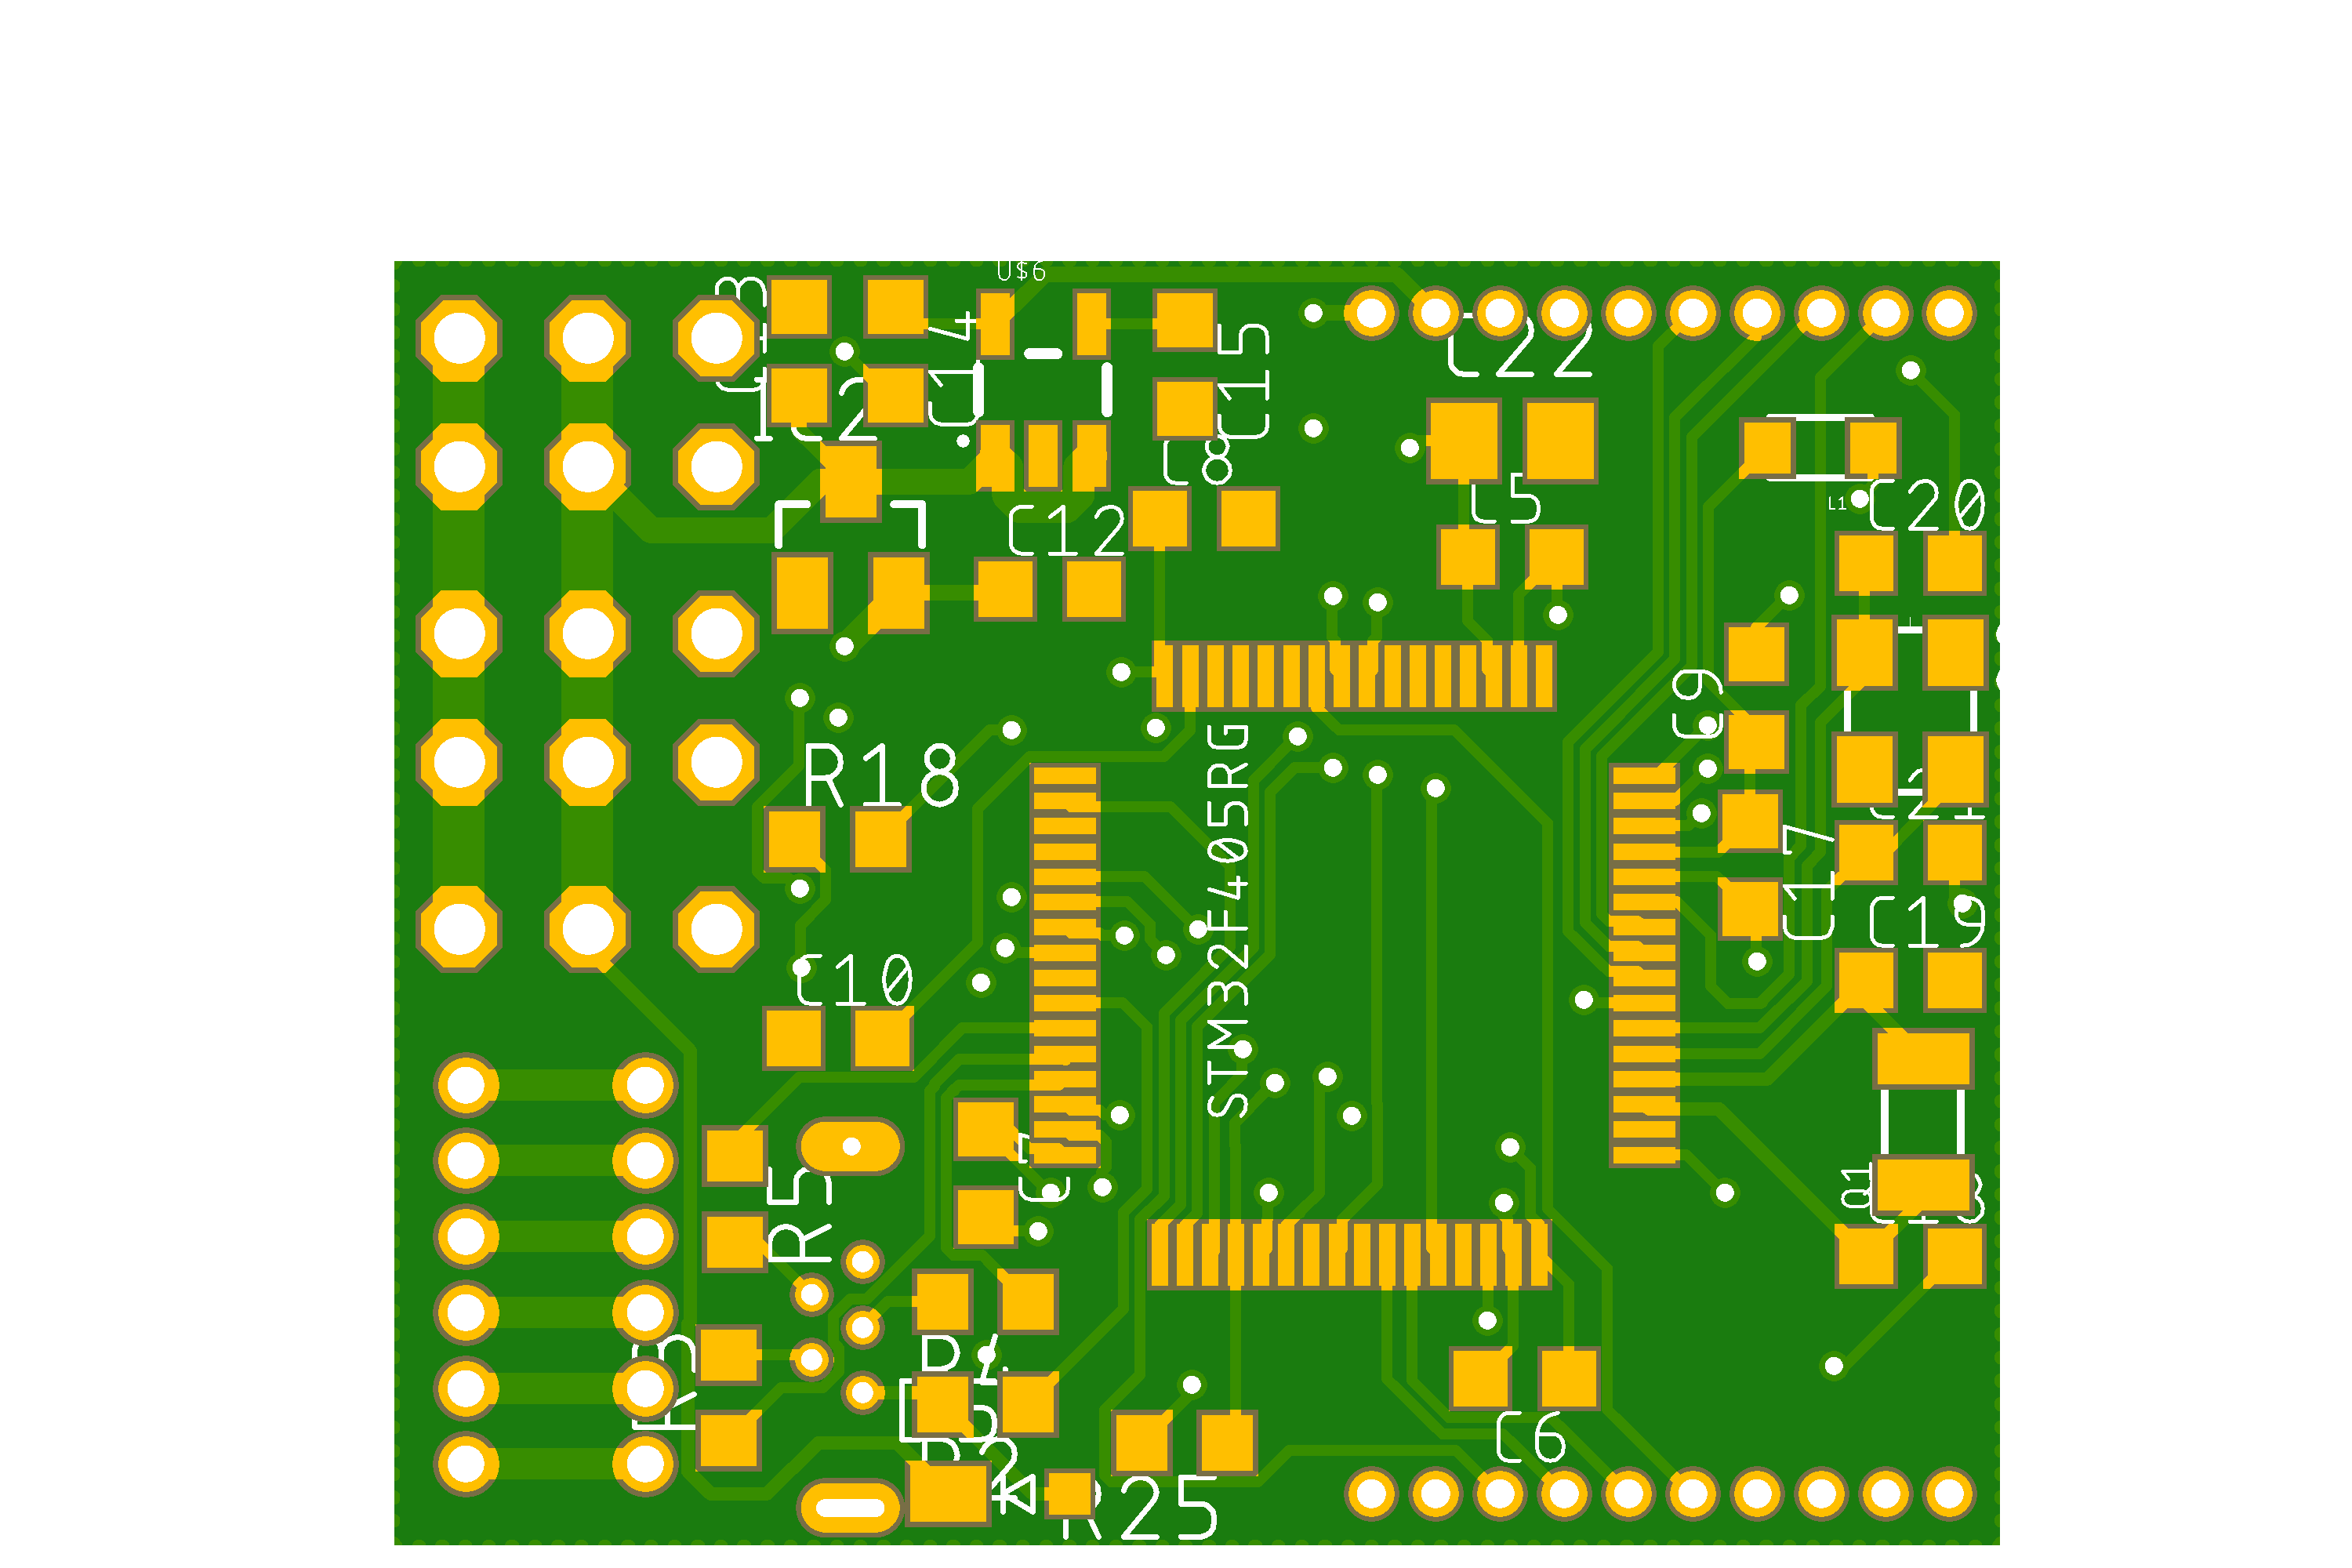
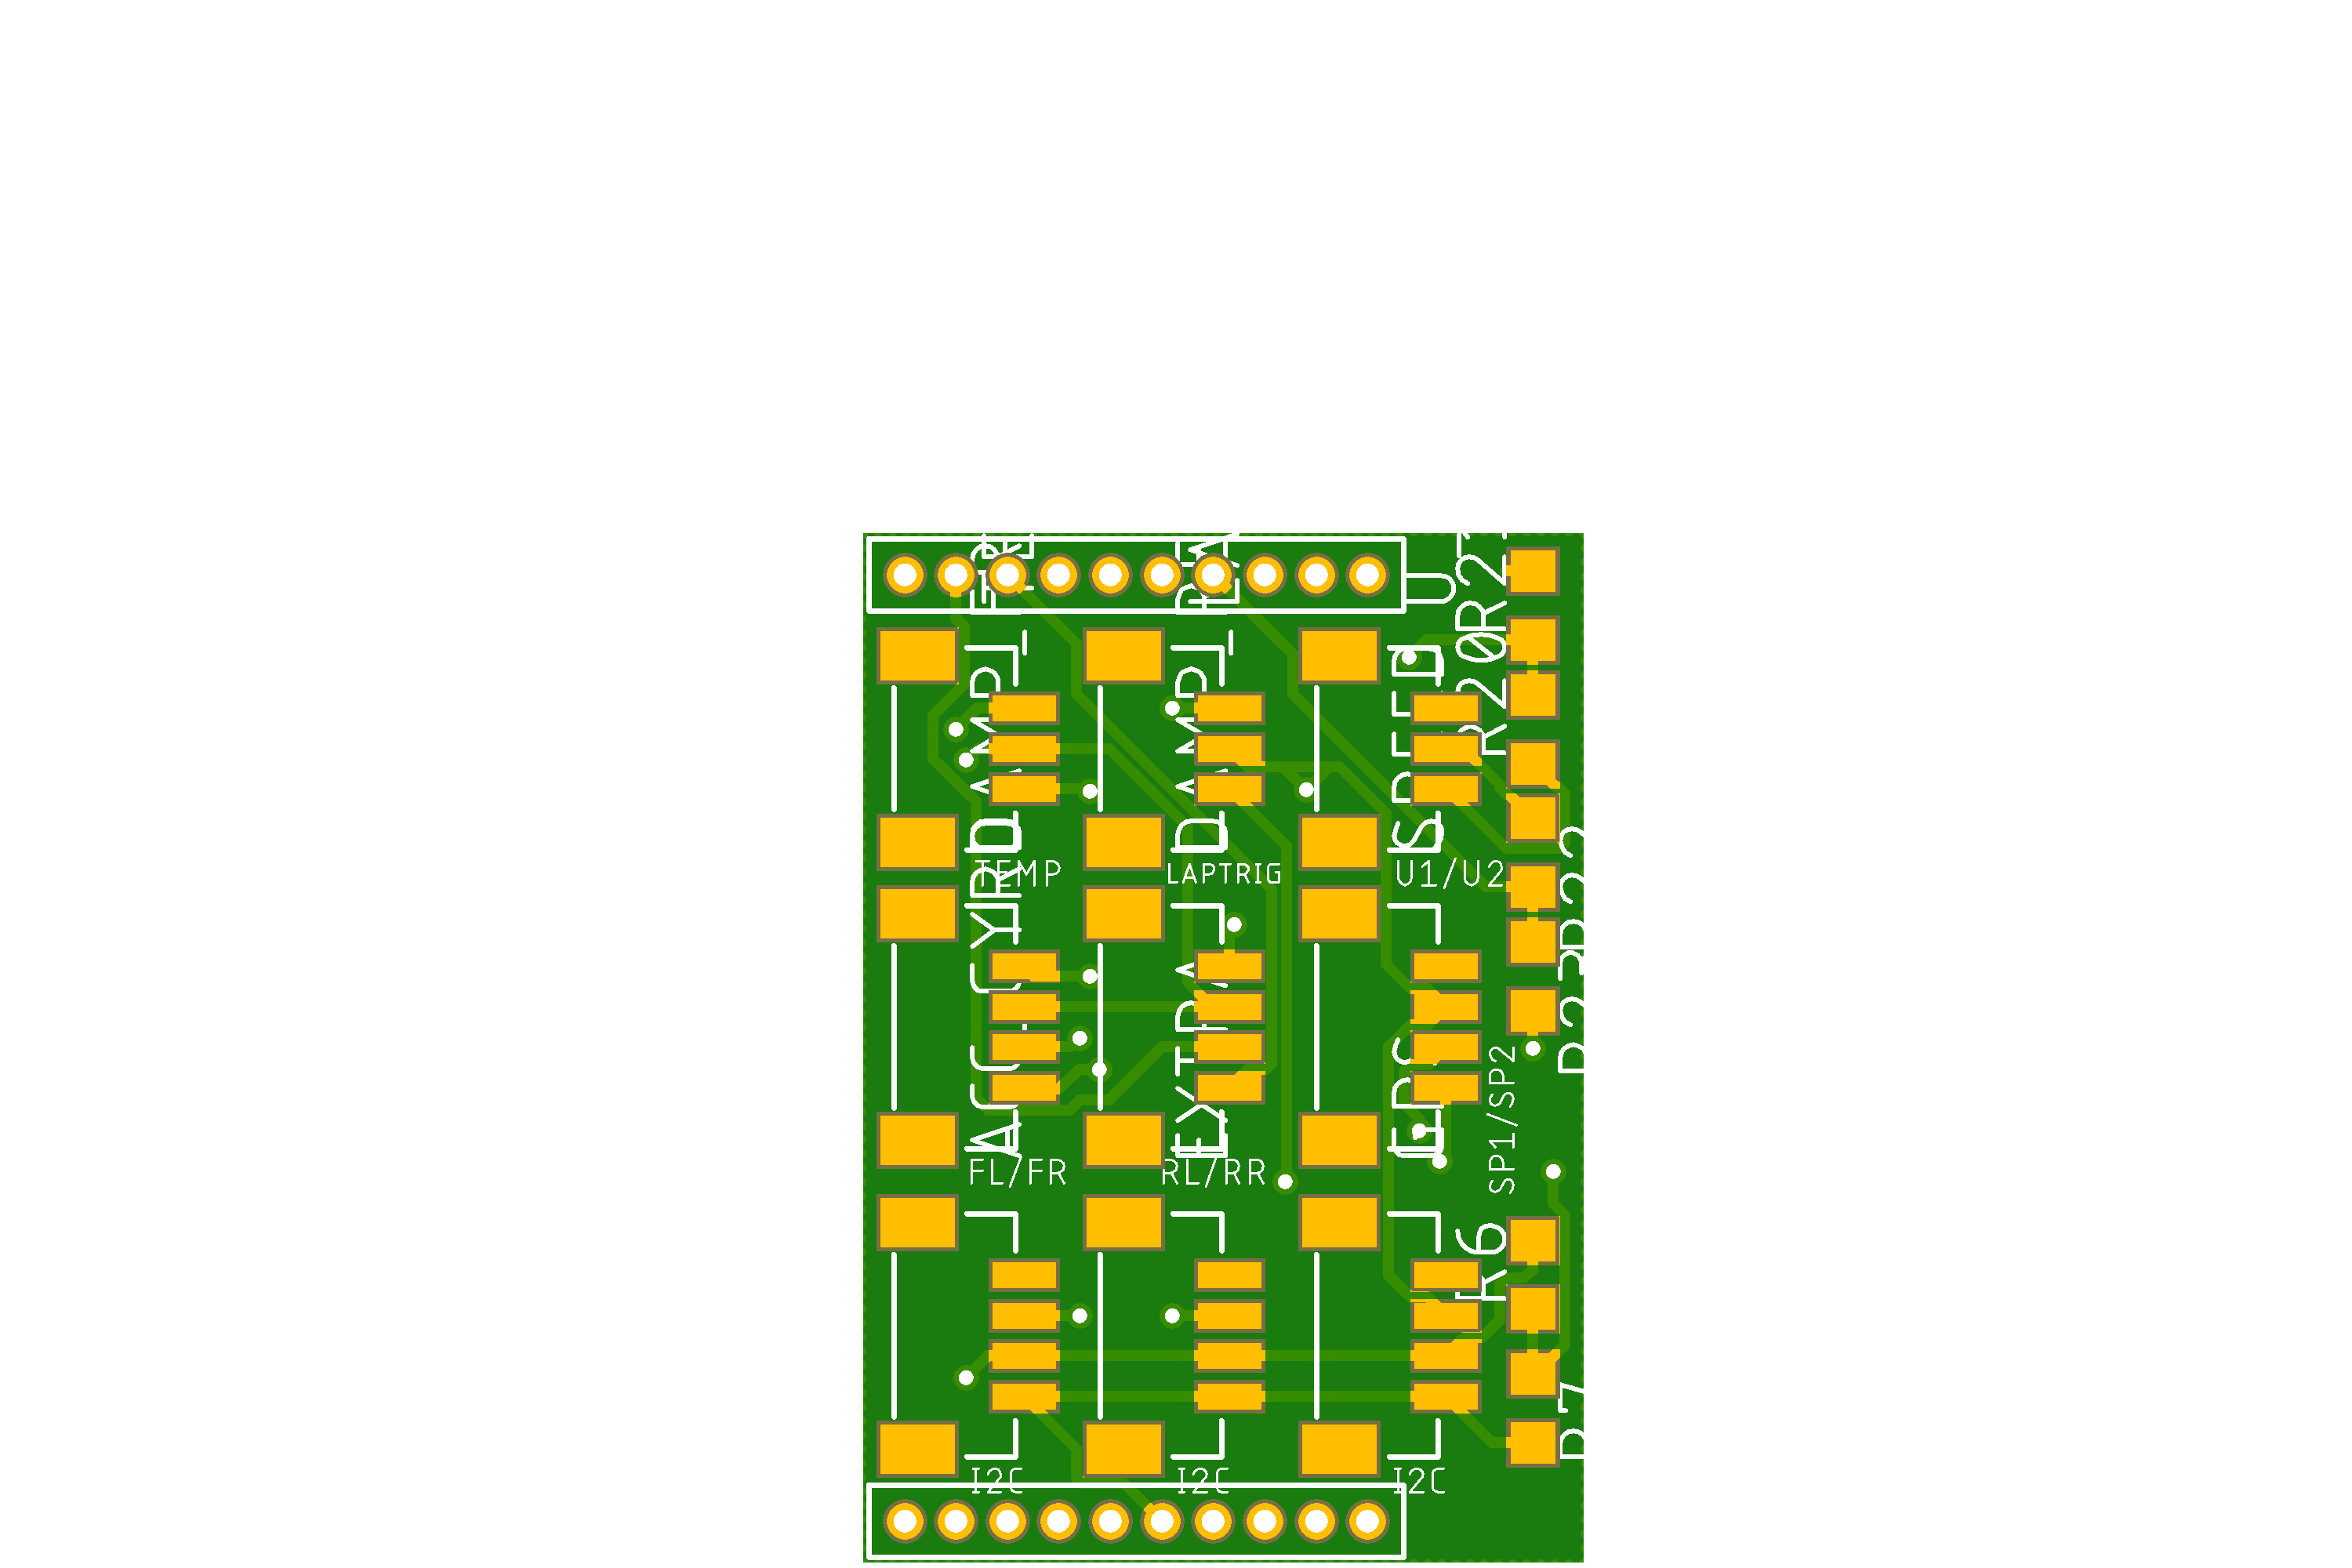
I did learn my lesson from this one and I designed V2 with solderable headers and went first time for the four layer PCB as it seems that it's correct way to do these things. Layout was also improved. I changed backup capacitor, LEDs and microSD connector to lower board. This made the upper board smaller which provided more room on the lower board and pins connecting the boards went from 30 to 16.
My layout and routing skills are still below zero and pretty sure I need ask someone to do a final decision for me who knows what he/she is doing as I'm not...
![]()
![]()
PCB's are on their way, so start of next year I should have a new version to test. This time I used https://jlcpcb.com to order the PCBs as prices for their four layer boards were quite good. 10 pieces of one board costs 13 USD plus shipping, so that's not bad. Let's see how is the quality of the boards.
That's it for this time. Maybe I will write something about the sensors during Christmas break as for example damper potentiometers have gone through quite many iterations already and now I have found clean and light weight method to do it...
-
First version without Python board
10/20/2018 at 15:50 • 0 commentsA time for another update as I received the first PCBs for a basic logger version which is completely own design and doesn't need a python board as a base. My friend drives a 1/12th pan car which really small and there is no extra space available, so python board shield version is a no go. I thought that maybe that is a good place to design completely own version of the logger. My friend gave a space constraint for the device that it shouldn't be bigger than Sanwa rx-451 receiver. I got quite close to that requirement maybe small fine tuning gets me to that target. Currently the board size is 33x22mm, so it's no too bad. Functionality is pretty limited though..
The board can log steering, throttle, laptrigger, speed/rpm from motor sensor port, g-forces and gyro values. This is good enough for me to verify the base design for the board and for 1/12th pan car that information already gives enough input to analyze and basic behaviour of the car.
I don't have any data yet to look, but the reduced size makes the installation so much easier. Also the weight is over 10 grams lighter compared to the last Pyb shield and Python board combo.
---------- more ----------One additional note. I ordered PCBs from allpcb.com just try something new. I can't say if the quality is good or not, but the boards work. To me the quality is comparable to Pcbway.com and I have feeling that these might have a same owner. The coolest thing about allpcb was the service. I ordered 5 pieces with DHL delivery and the total price was only 10USD! The boards came less than a week from order to my home. Pretty impressed with that.
Ideas for next version:
- To remove the Y-cables for steering and throttle, maybe I will try second pair of 0.1" headers to do a passthrough. Similar as with the motor sensor.
- Optimize the layout. E.g. LEDs to same location
- Get USB connector to other side of the board as now it increases the height on the bottom side.
- Add connector for voltage measurement.
- Pads for debugger.
![]()
![]()
-
PYB shield V2
10/08/2018 at 13:48 • 3 commentsIn the previous post I mentioned about new prototype and it arrived as planned during last week. I called this as Python board shield V2. As a summary main changes were as follows.
- Move from through hole components to surface mount components
- Move from 0.1" header connectors to JST-SH connectors
- Take RPM and temperature information from motor sensor port
- Changed the shield from bottom side of PYboard to top side and solder it to PYboard.
So basically everything was new.
Build went pretty smooth even it was one my first times soldering SMT components. My loyal Weller WTCP 51 with 0.4mm tip did the work nicely :) As a result I got a prototype which was 4 grams lighter and few milli meters lower. Pictures shows a bit more
![]() ---------- more ----------
---------- more ----------![]()
![]()
![]()
Testing
During the weekend I did a bit of testing with the new unit and few notes the experiences. Now the shield is soldered to PYboard and it improves the reliability on hard landings. Previous version cut the logging quite easily when it got a big hit and this was due to the board-to-boards connector headers didn't have tight enough connection. Now it didn't a got a single cut.
RPM reading from sensor port works really nice, but temperature reading I didn't test and I believe that will need some calibration.
Wiring layout was nicer to do although crimping JST-SH connectors is pain in the ass job, but I got it working. JST-SH connectors are much nicer to use as you can't connect the sensor wrong way around. Performance wise there wasn't any difference, but that wasn't expected.
Layout
Here is a picture of my 2WD buggy with current layout. It's not super nice and tidy, but you work with it. Currently it has the measurements as follows:
- Steering position
- Throttle position
- Voltage measurement for both battery cells
- Speed from RL and RR outdrive plus the motor sensor
- RL and RR damper movement
- Laptrigger for laptimes
- G-forces for all three axis
- Yaw, Roll, Pitch
![]()
The stupidity announcement
For some reason I thought that why I need to have 5V regulator in my design as the PYboard has 3V3 regulator to have a proper voltage level for the MCU. Therefore I decided to leave the regulator out.
I just forgot a small thing that my hall sensor input needs to be at least 3V5 so 3V3 is not enough and MCU inputs are 5V tolerant. The RC car receiver provides the power for the unit and that has 6V level. This meant that hall sensor supply was 6V which isn't a problem but also the output is 6V and that's over the MCU input spec. That meant that I fried to MCUs...
Now I have the regulator in place and I have learned my lesson (hopefully). One thing I started to think about forgeting the regulator and instead using a logic level shifting for the sensor inputs. If you guys have any thoughts on topics, please share. As stated before, my experience is close to zero when it comes to electronics. Maybe I will come back to this topic later on.
New Ideas
- Combine connectors. For example combine RL and RR rear damper pots from two three pin connectors to one four pin connector. This would save space on the board and also less wires.
- Modify the damper pot sensor to remove the spring and connect directly to wishbone.
-
Yet another shield for Python board
10/03/2018 at 11:46 • 0 commentsThis week I should receive a new shield PCB for the collector. I think this shield is already 5th or 6th version, so there has been quite many iterations. This one is a bigger change as this is the first version with surface mount components and sensor connectors are changed from 0,254" header pins to JST SH connectors. There is two reasons why I wanted to change the connectors. First one is surface mounting and smaller size. Second reason is probably the bigger one. With JST connector you can make sure that the connector is always plugged in the correct way.
Hopefully this helps me to reduce the height and weight of the package. It's still not going to be what is my target but at least one step closer. Also hoping that I get to test this one during the next weekend. I will definitely post some pictures if that happens.
The next step will be a version without Python board, so get everything on one board...
![]()
