Pavel
Pavel-
Spectrometer completion
01/09/2021 at 14:25 • 0 commentsThe spectrometer structure is mostly complete now.
The grating is made to be perpendicular to camera's line of sight, by affixing them both to the same turning base. Distance between camera and grating is 9 cm. The grating itself is cheap Chinese plastic 600 lines/mm from AliExpress, like this one. I made a frame for it from black cardboard for easier handling.
As for collimating lens, I had one achromat doublet lying around, 50 mm diameter, and with focus distance of 200 mm, so I used it in this spectrometer.
The slit is made of two retractable knife blades. Its width is something between 80 and 100 micrometers, slightly varies along its length due to imperfections of blades themselves and in aligning them by hand. For controlling width single slit laser interferometry was used.
Below are snapshots of spectrometer building process:
1. The box was built using PVC foam sheet of 4 mm thickness; base made of 2 such sheets alongside the third one of hard polystyrene plastic sheet of 3 mm thickness, to make it stiffer. The turning base is made of the same polystyrene sheet. The collimating lens has very convenient metal shroud which helps with its handling.
![]()
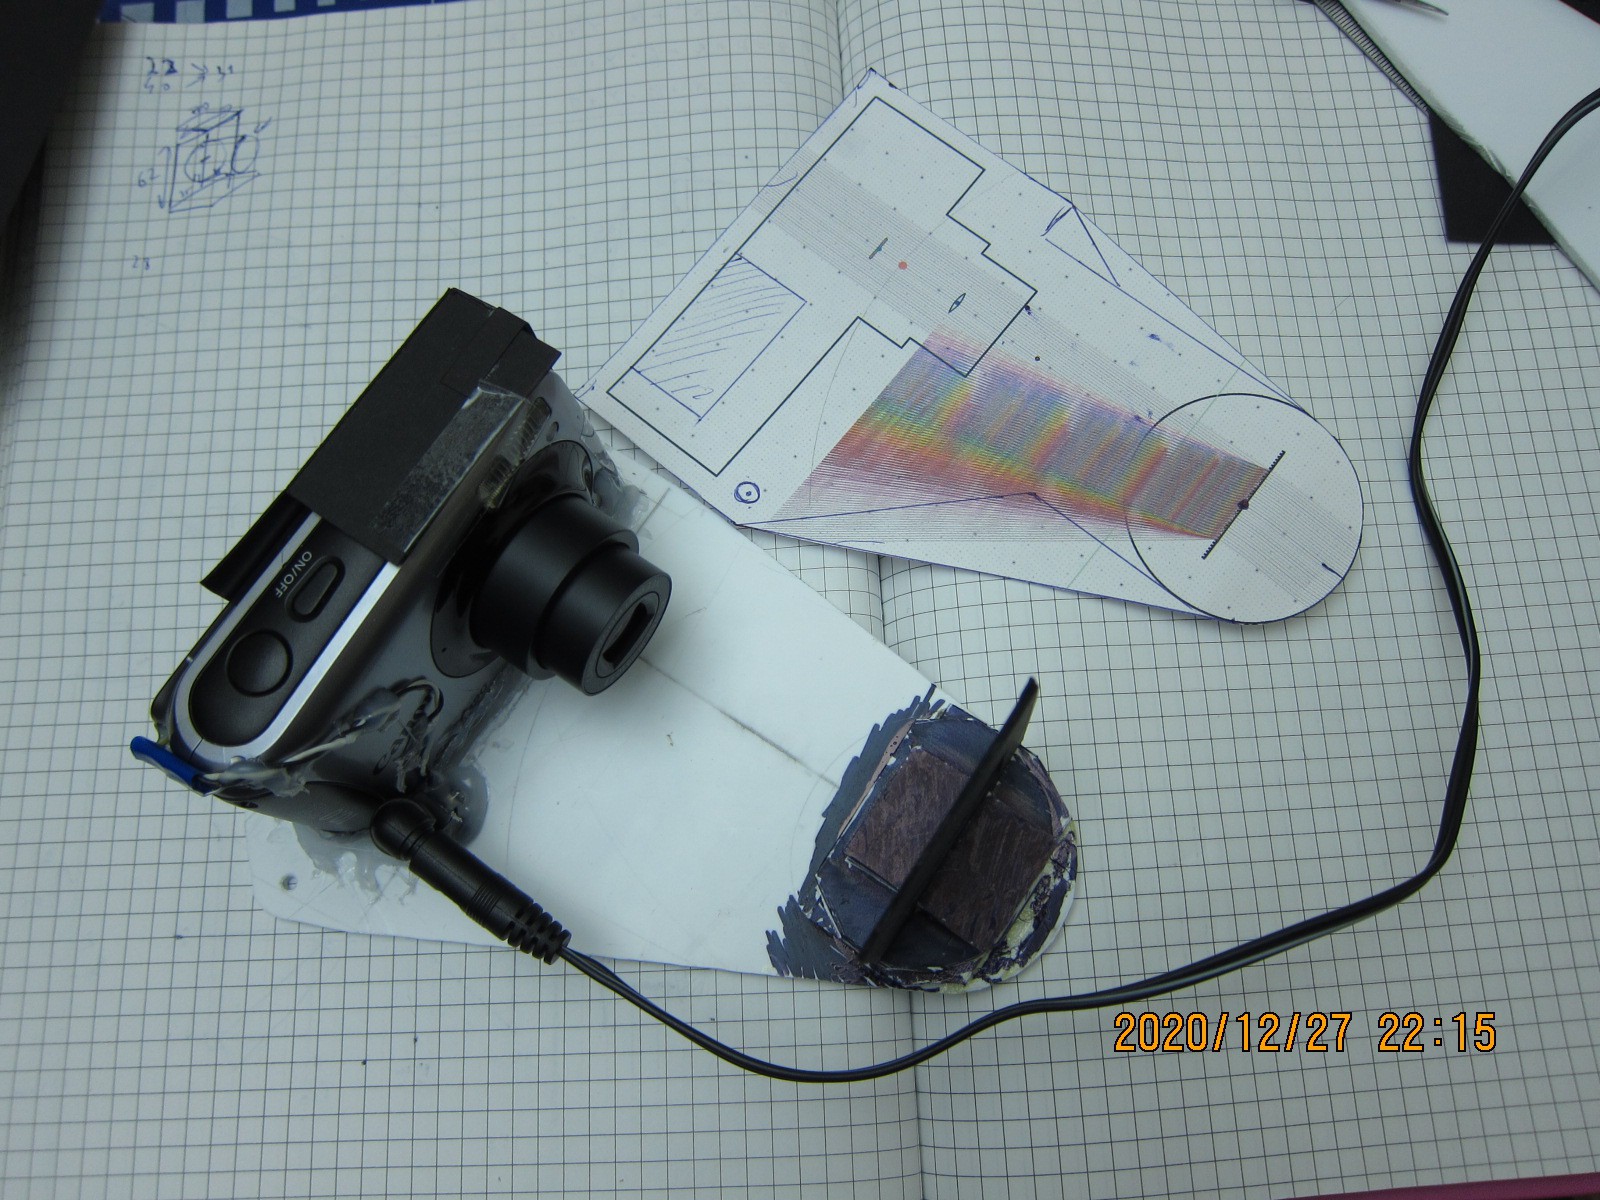
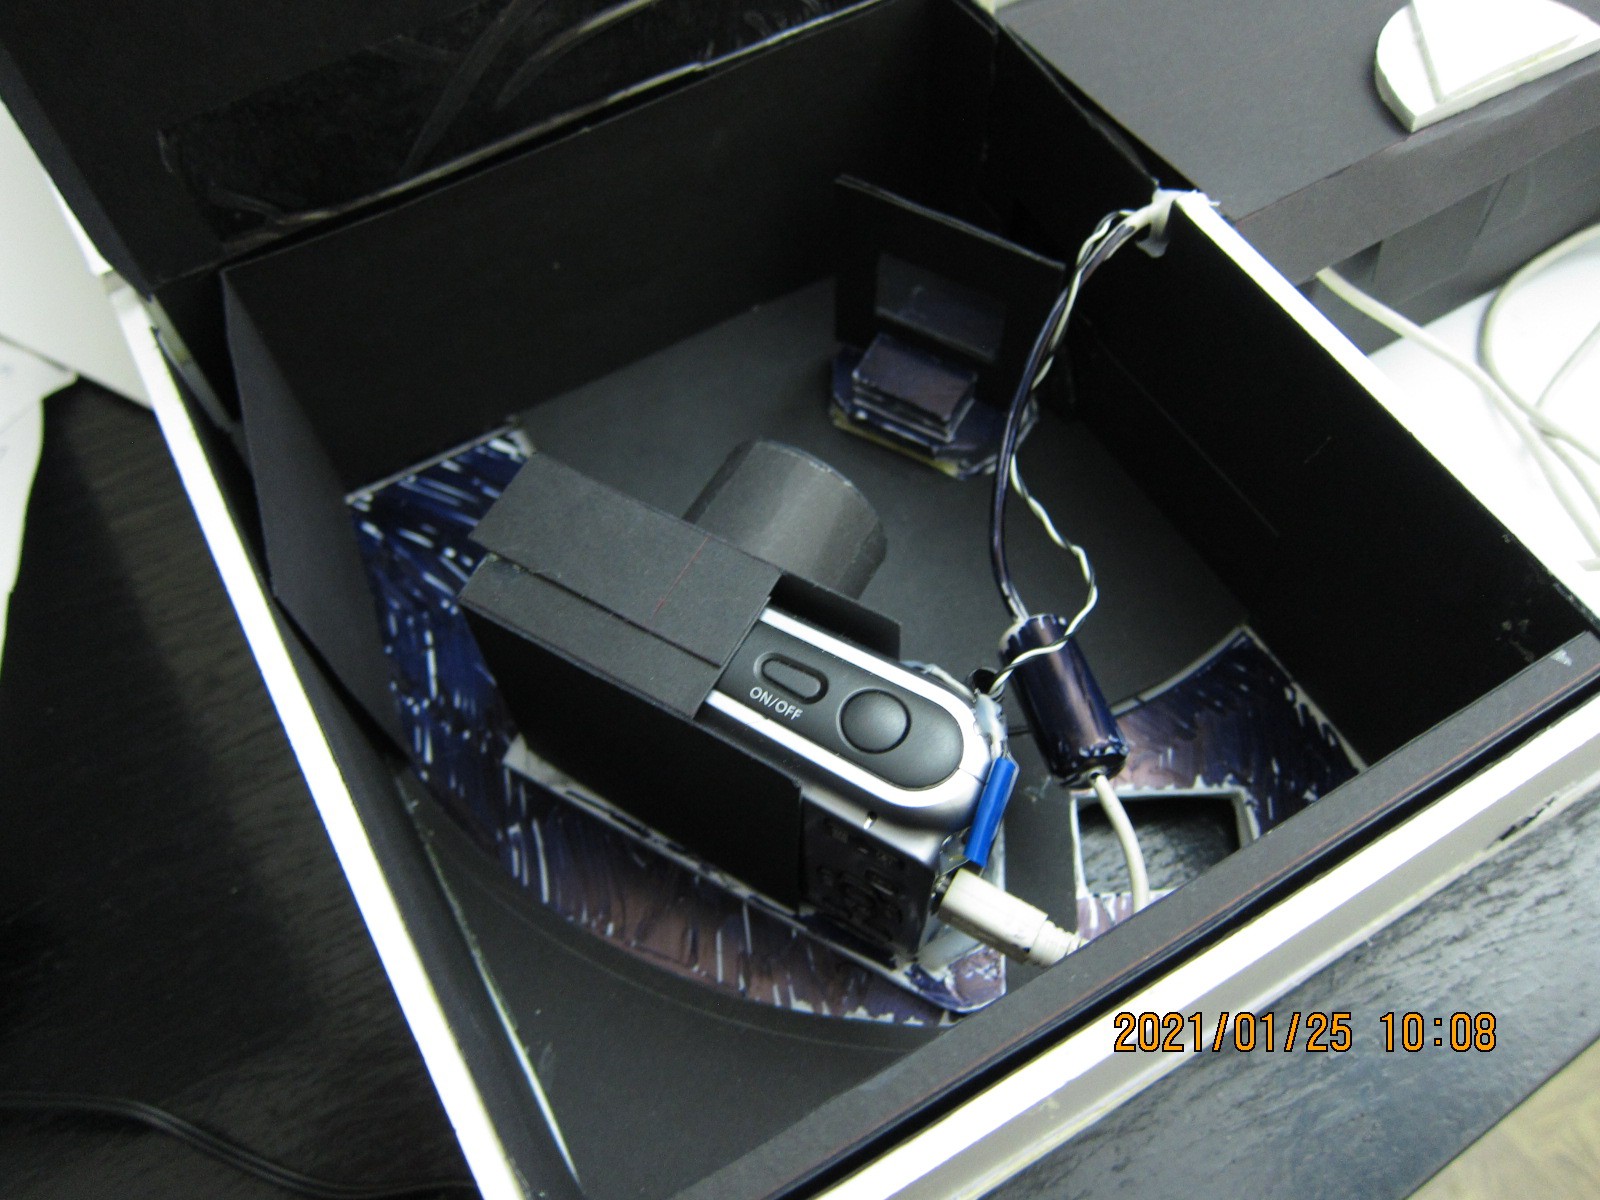
2. Camera glued to turning base, with the grating. Alongside it is the schematic depiction from the software model.
![]()
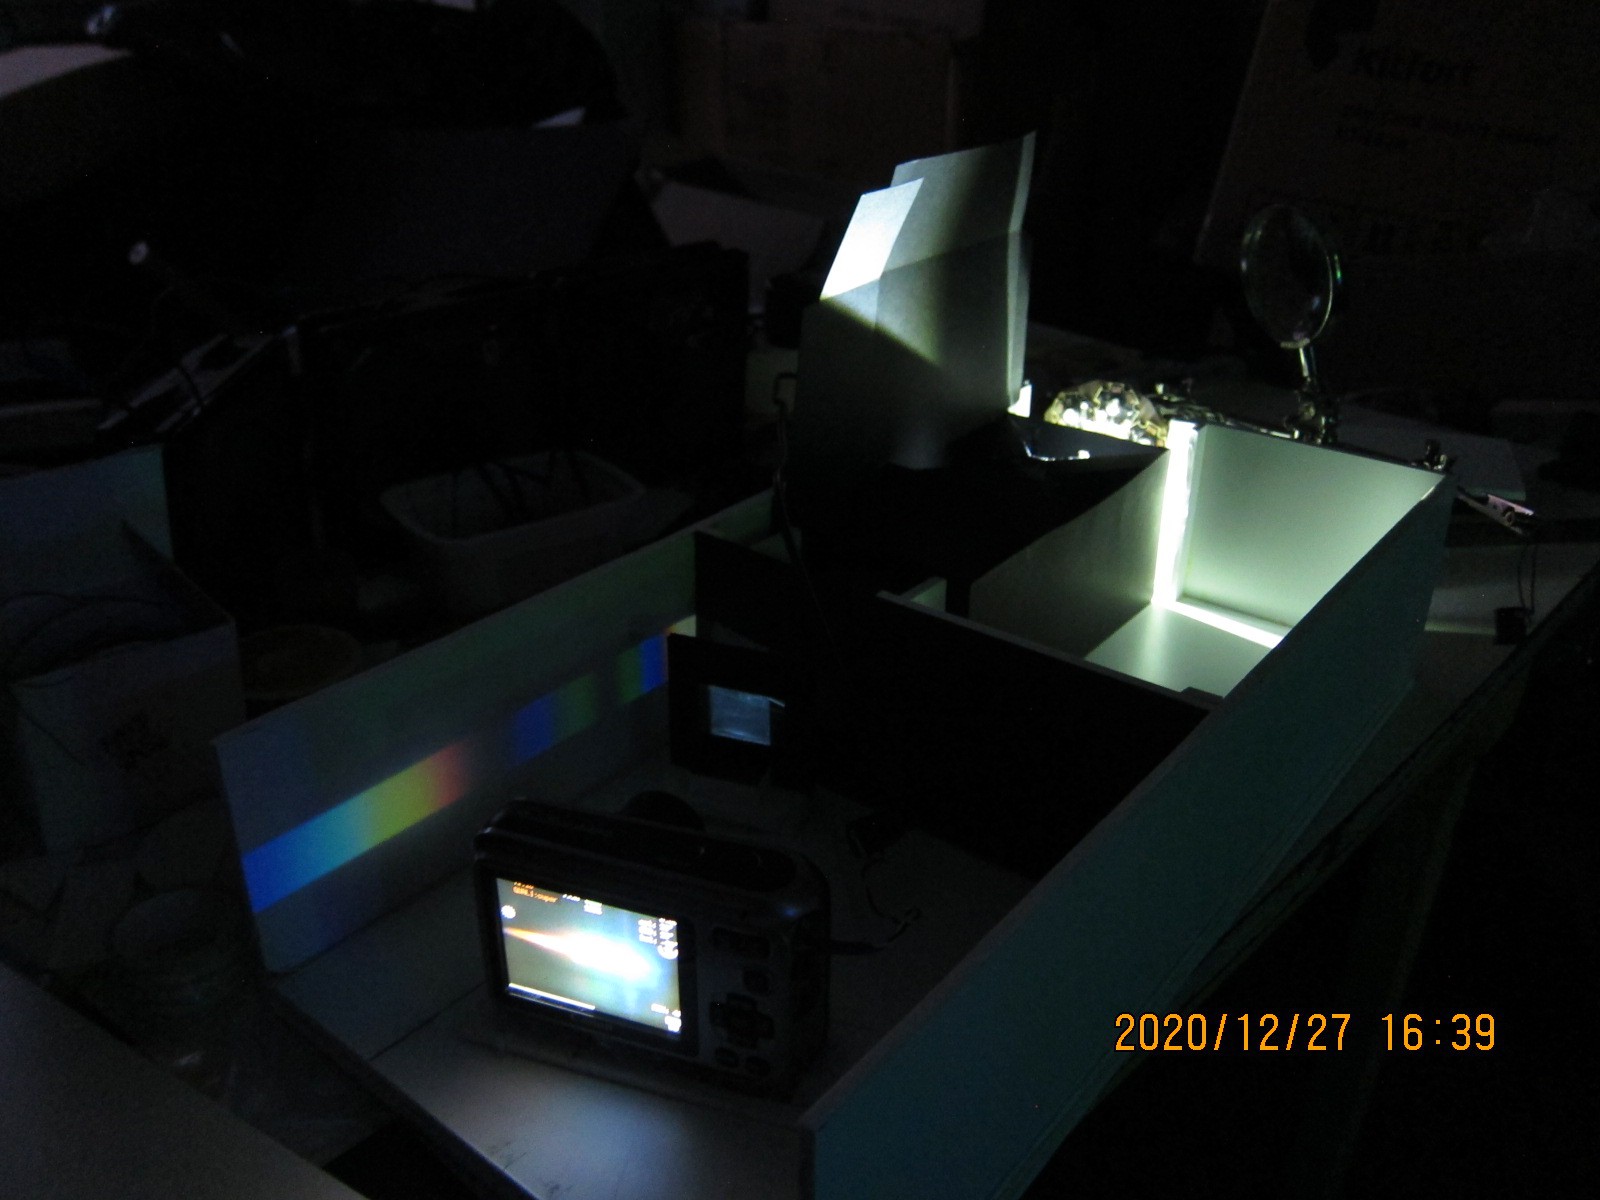
3. Between the slit and collimating lens a conduit for light is made from black cardboard, with several internal apertures to cut down on stray light. Below is the test with bright white LED placed at slit:
![]()
3.1. The same test, just with the camera and grating, viewed from camera side:
![]()
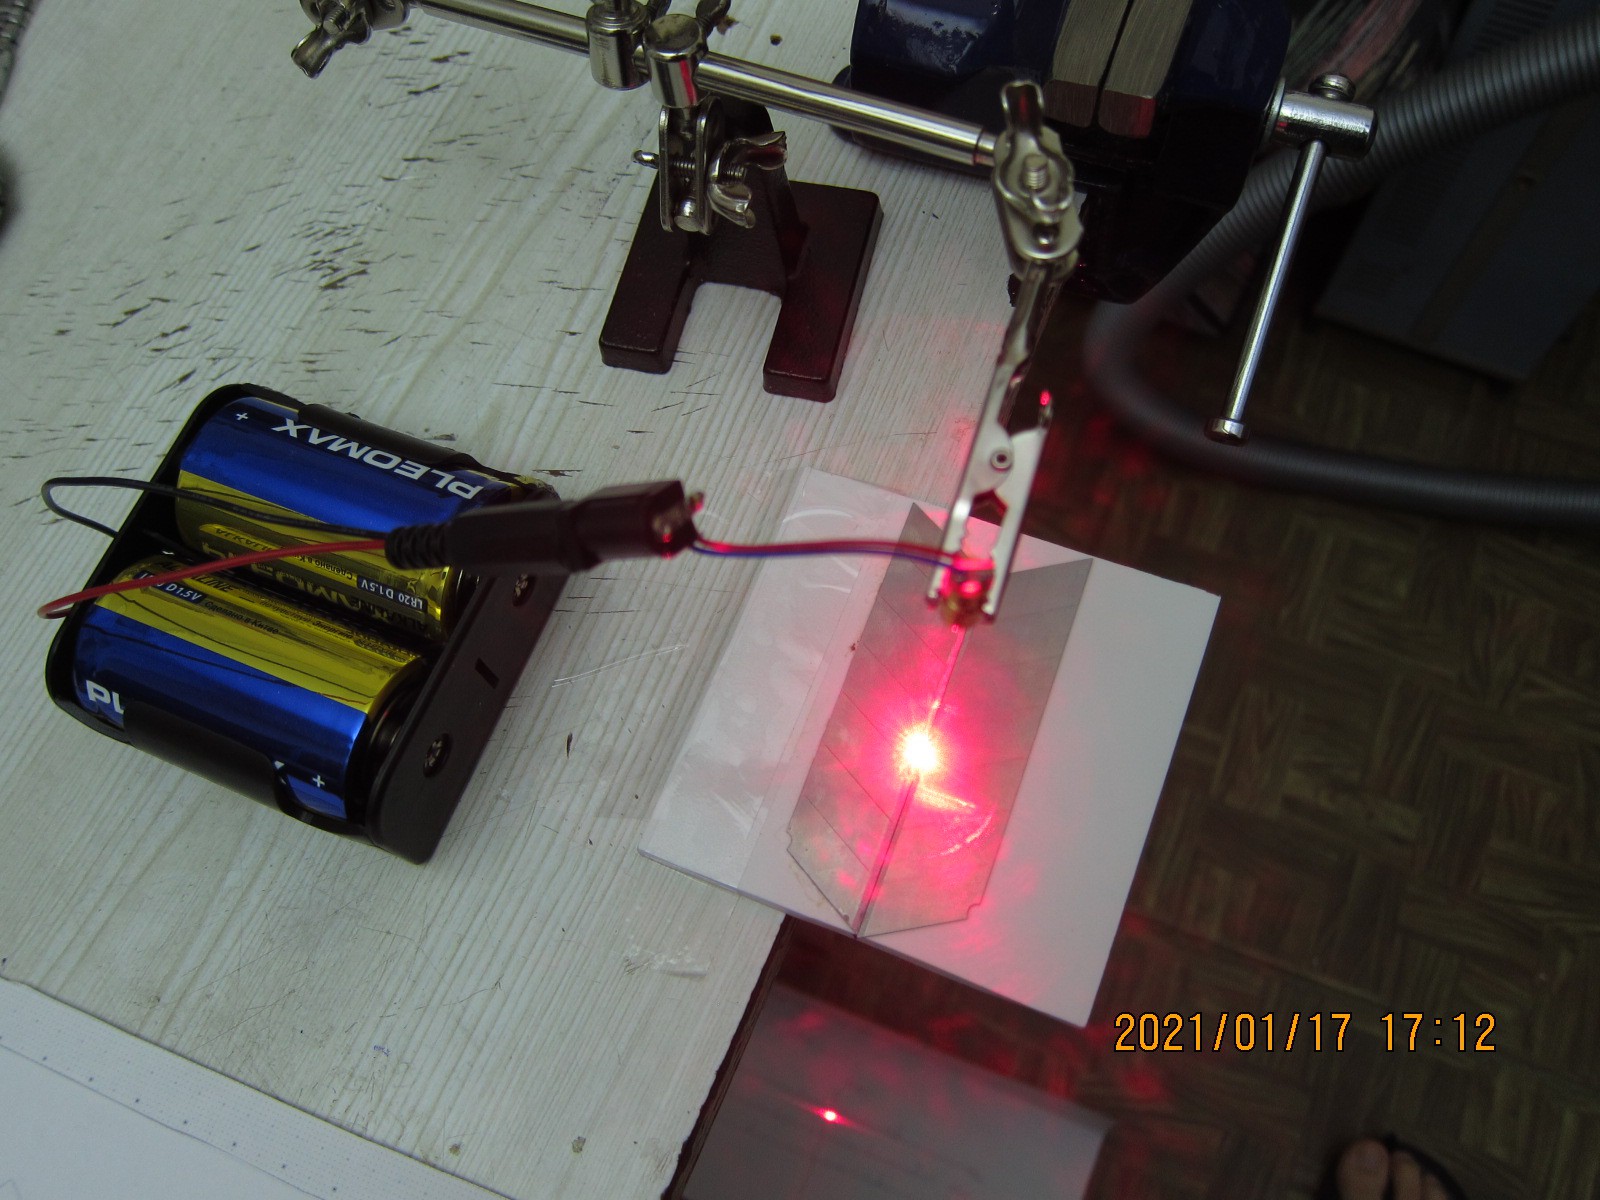
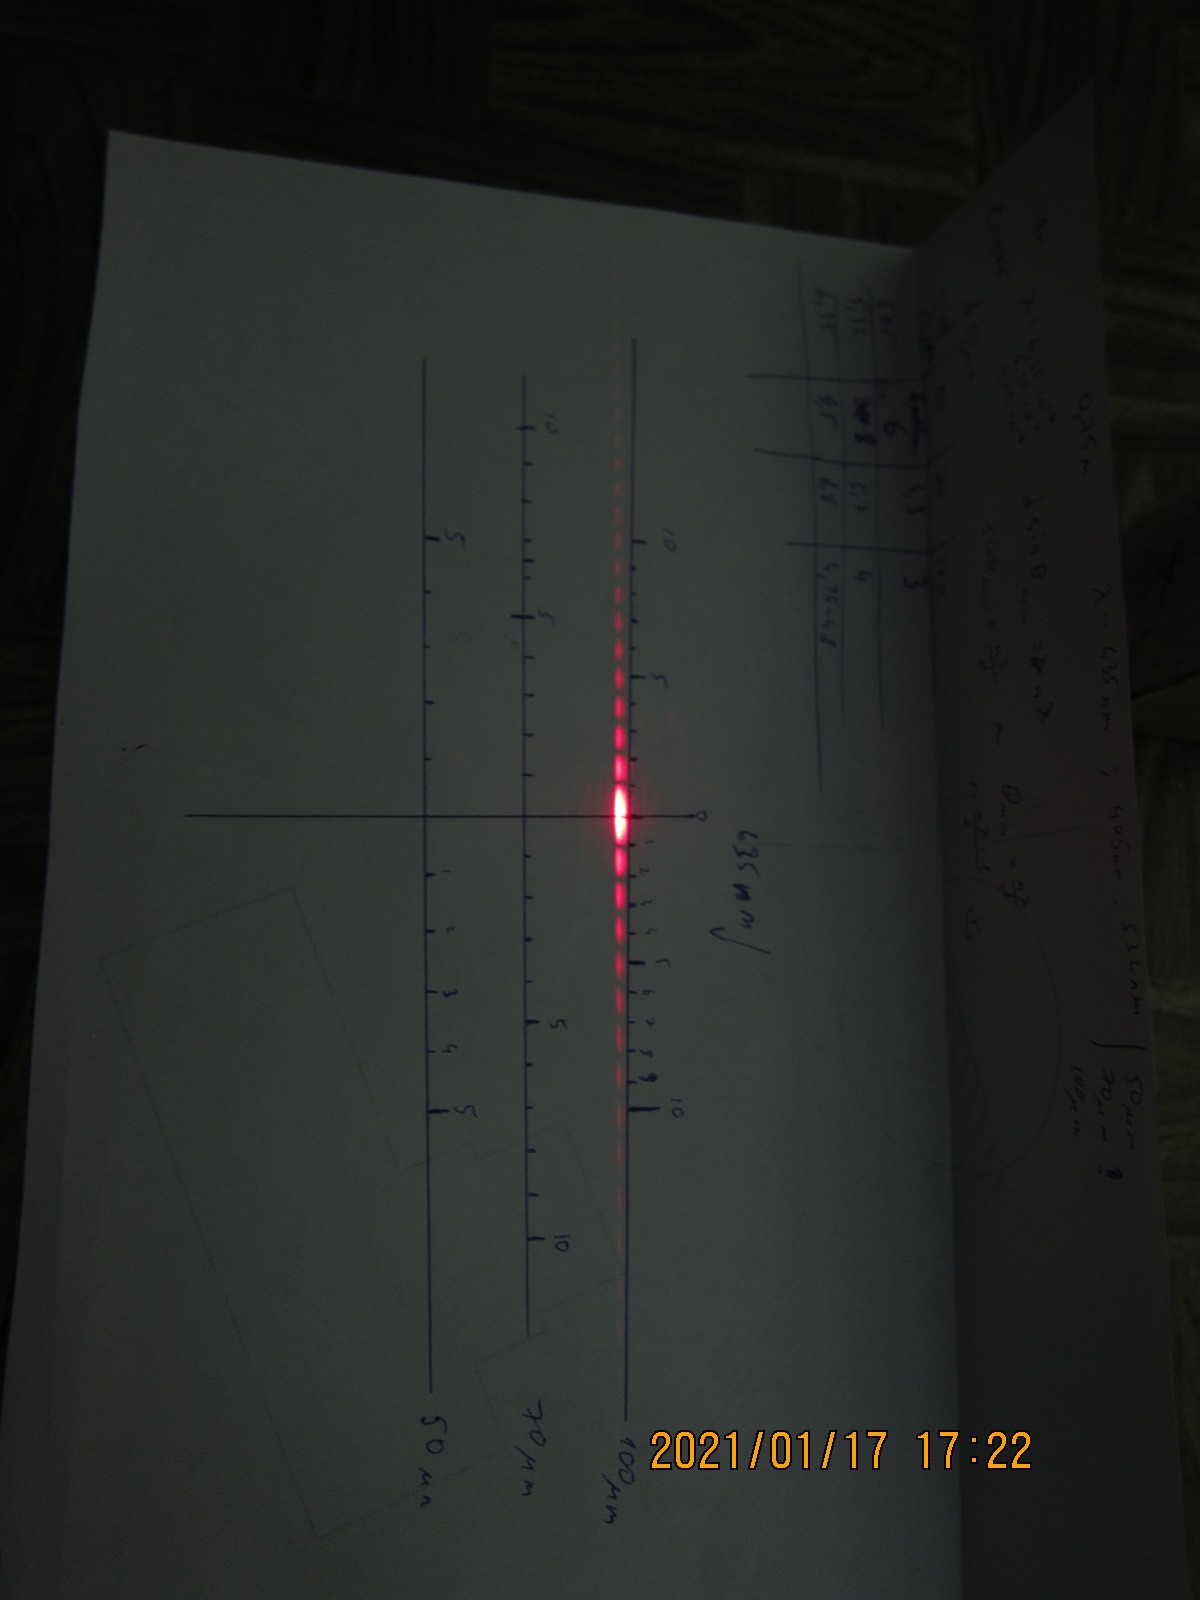
4. Making the slit, controlling its width with laser:
![]()
4.1. Comparing diffraction pattern against pre-calculated ones for set slit widths:
![]()
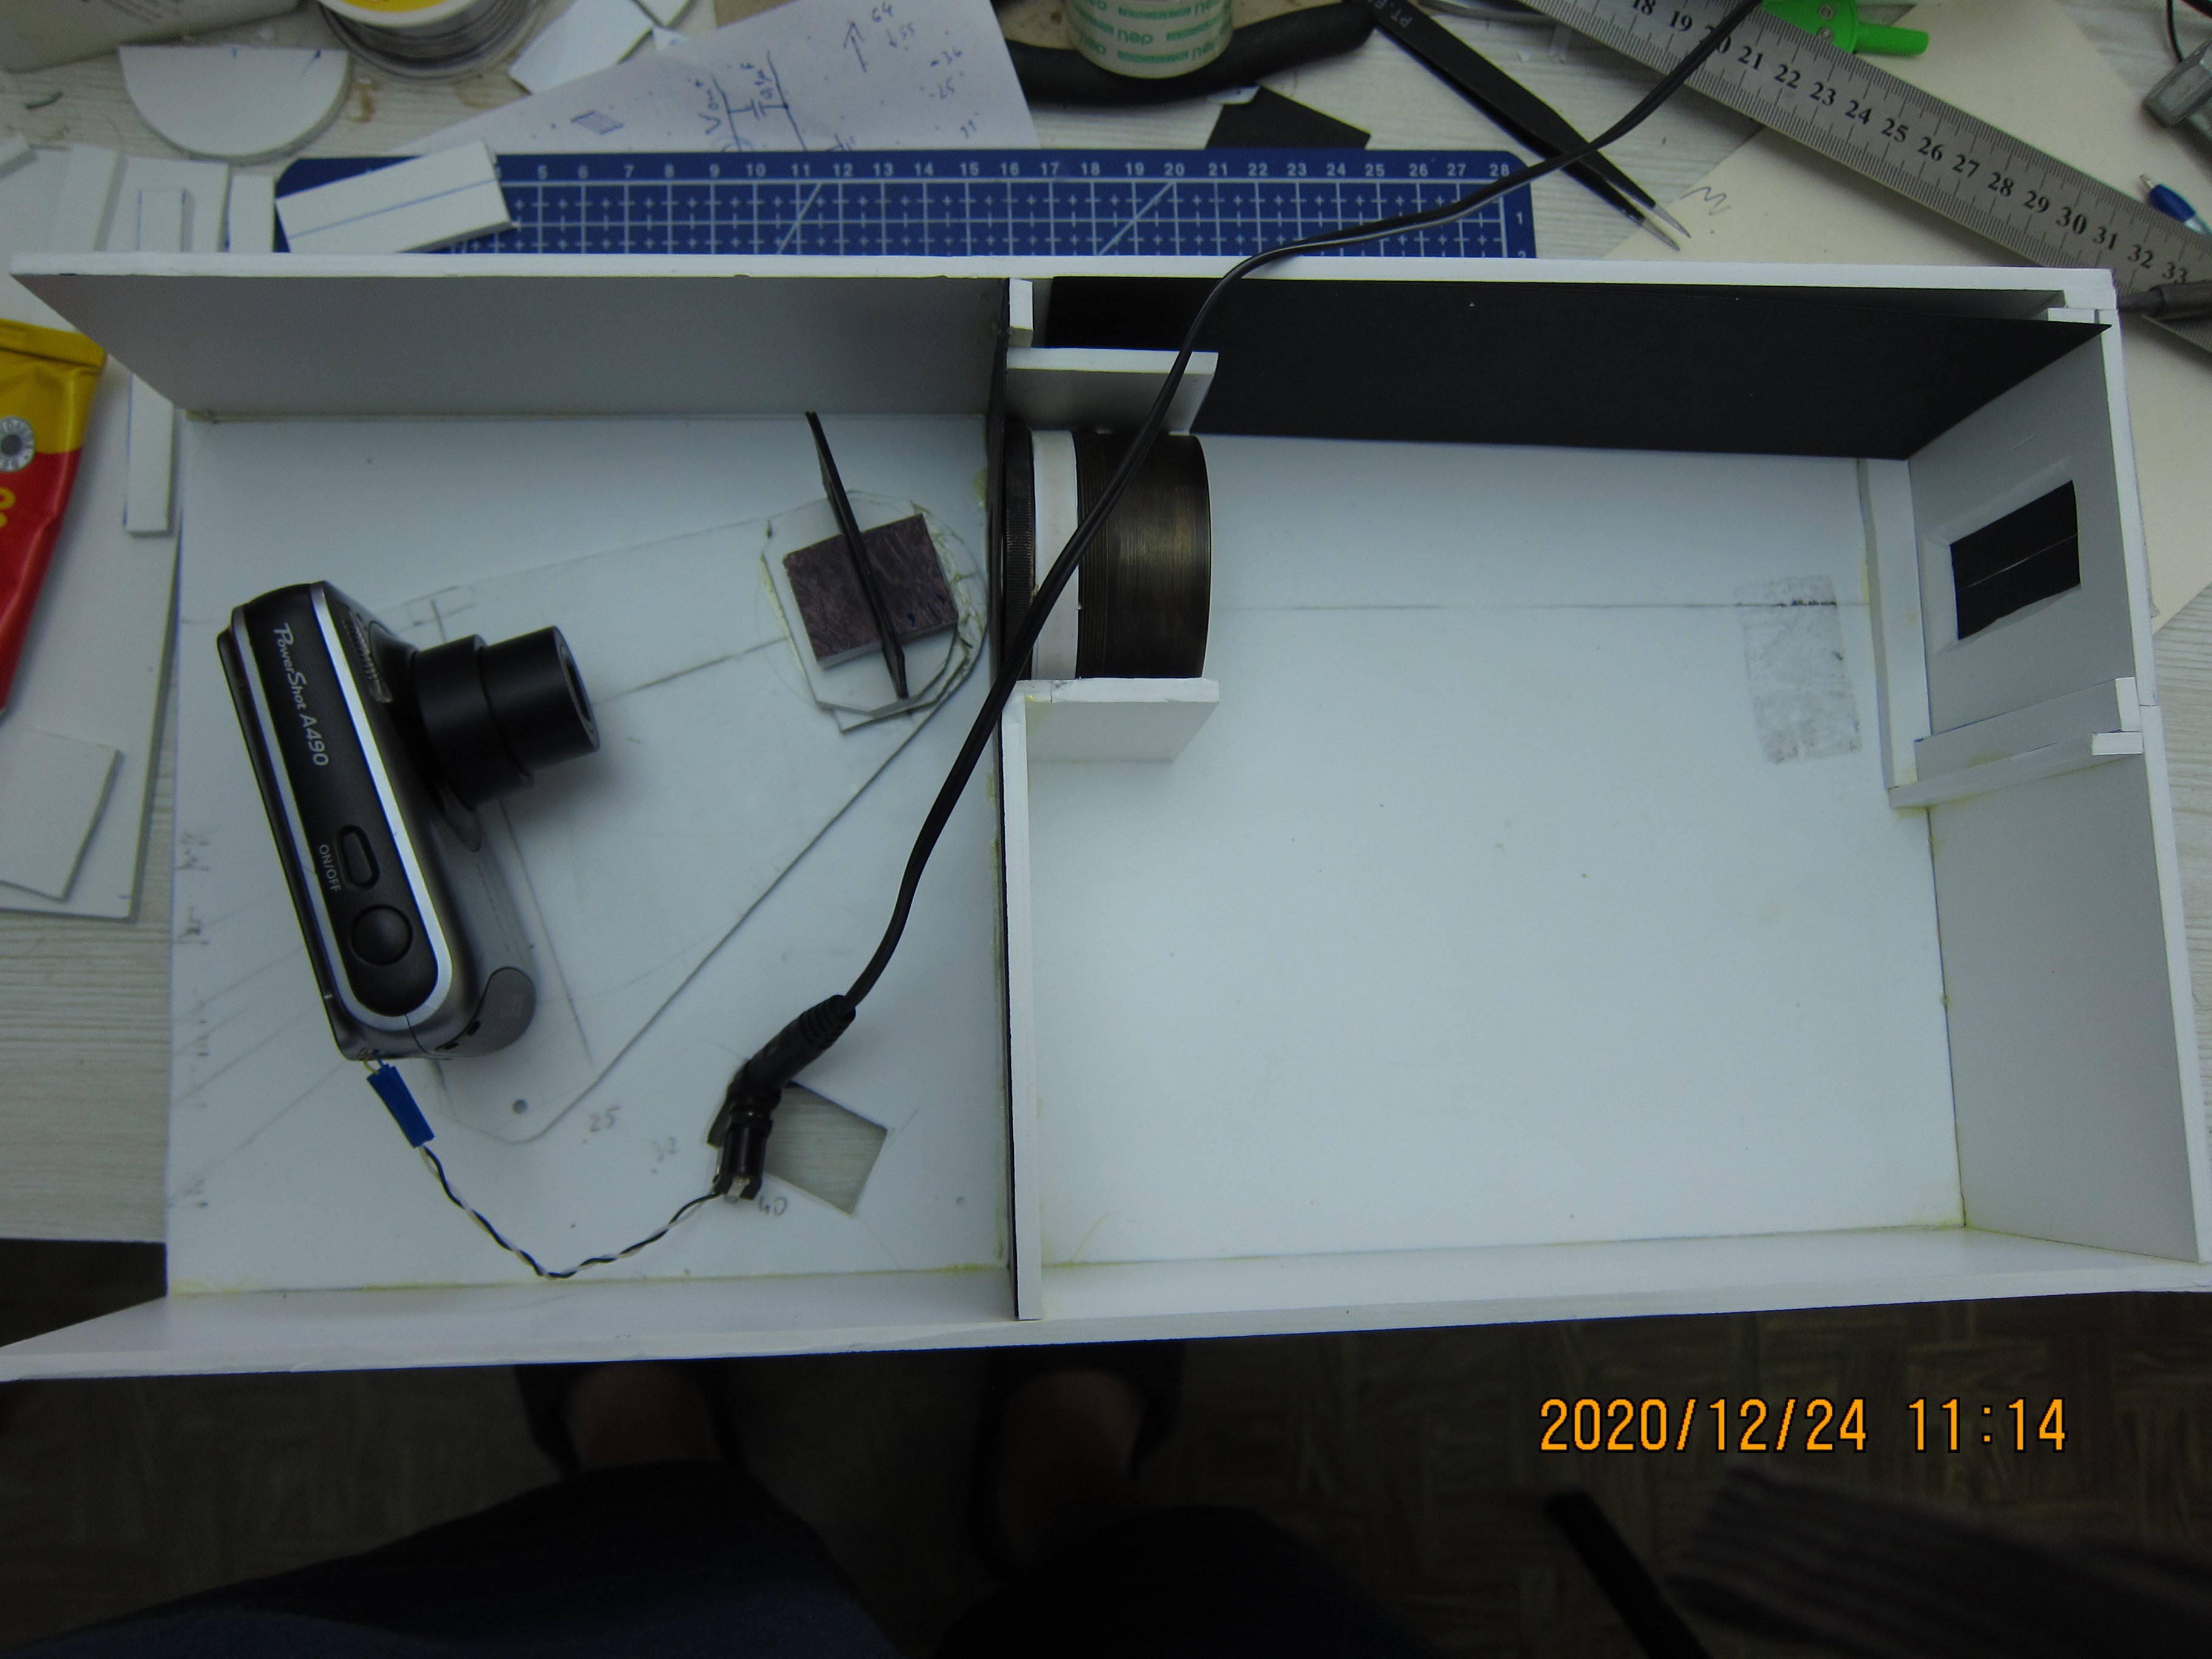
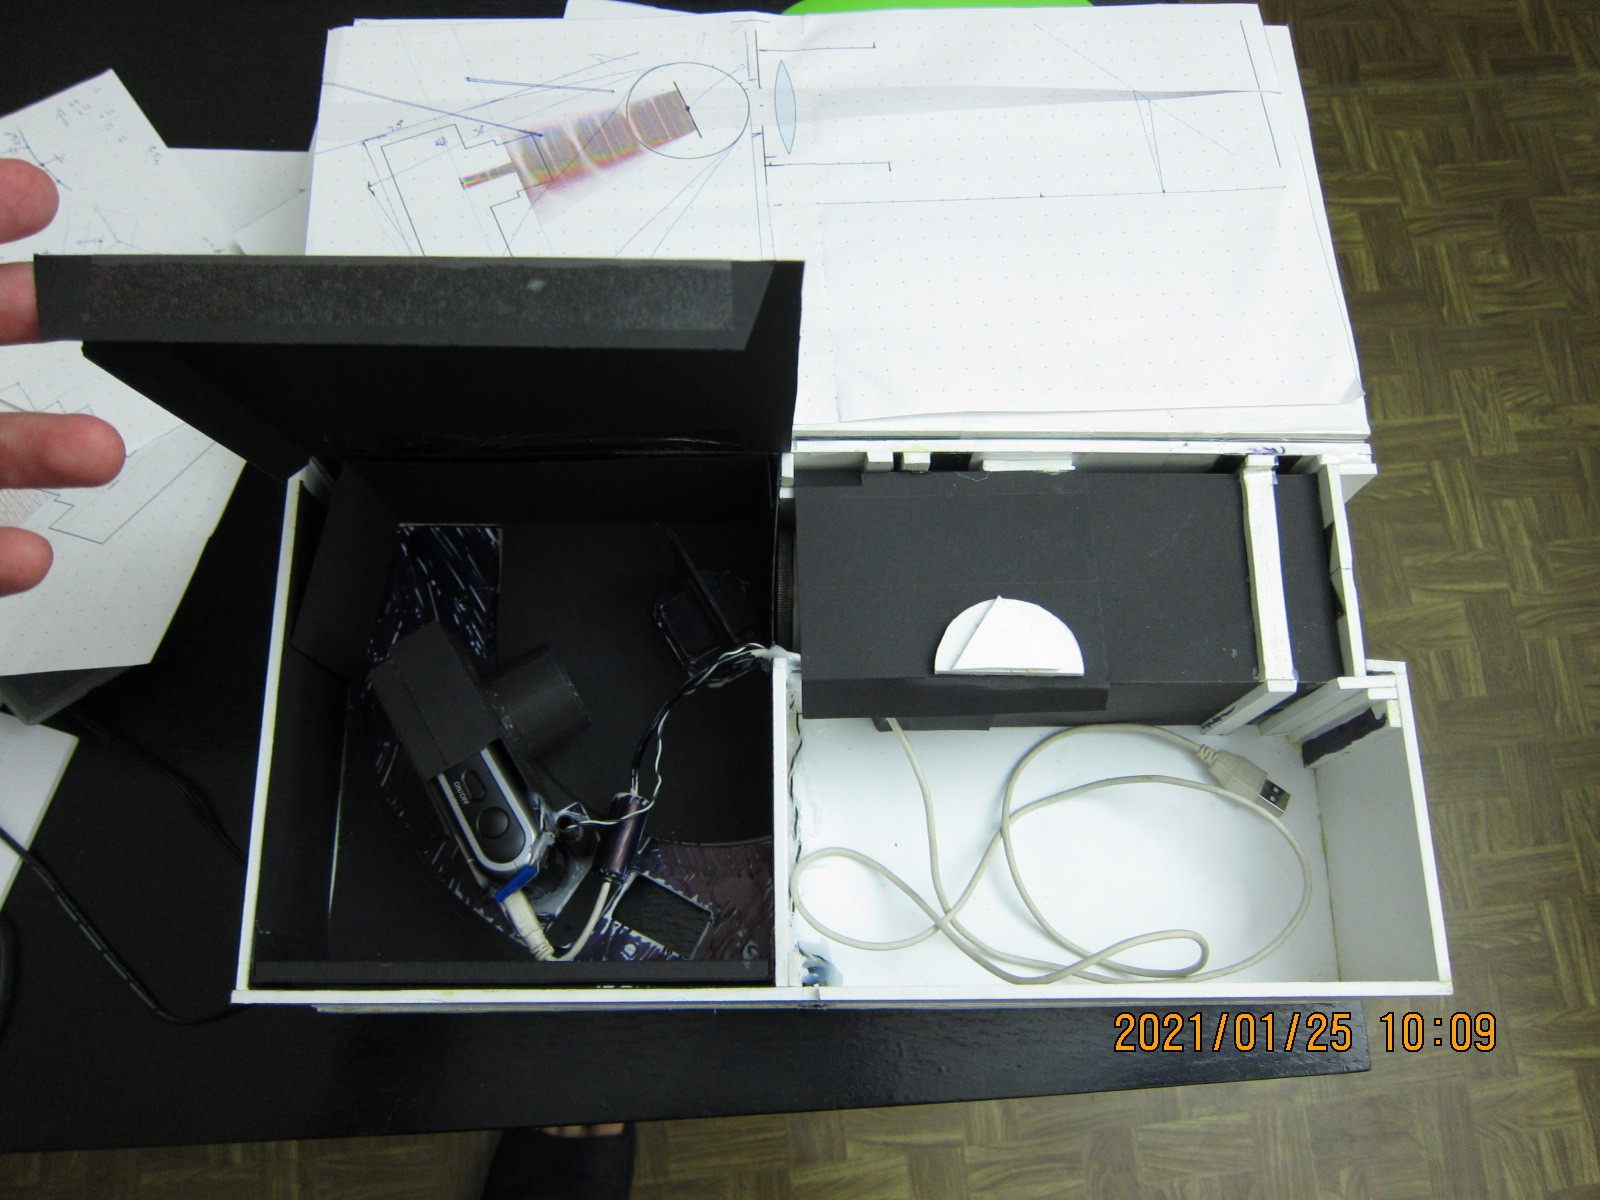
5. This is how the completed spectrometer looks like (while recording spectra, all covers are closed):
The camera compartment is lined with black cardboard, or painted black in some places to reduce stray light. Camera itself is covered by the same cardboard to hide the screen (as camera accessed remotely, there is no need for it anyway). In the lower right there is a hole through base, which is used for access to camera SD card, so I can insert or remove it, as camera now is permanently integrated into the spectrometer structure.
![]()
![]()
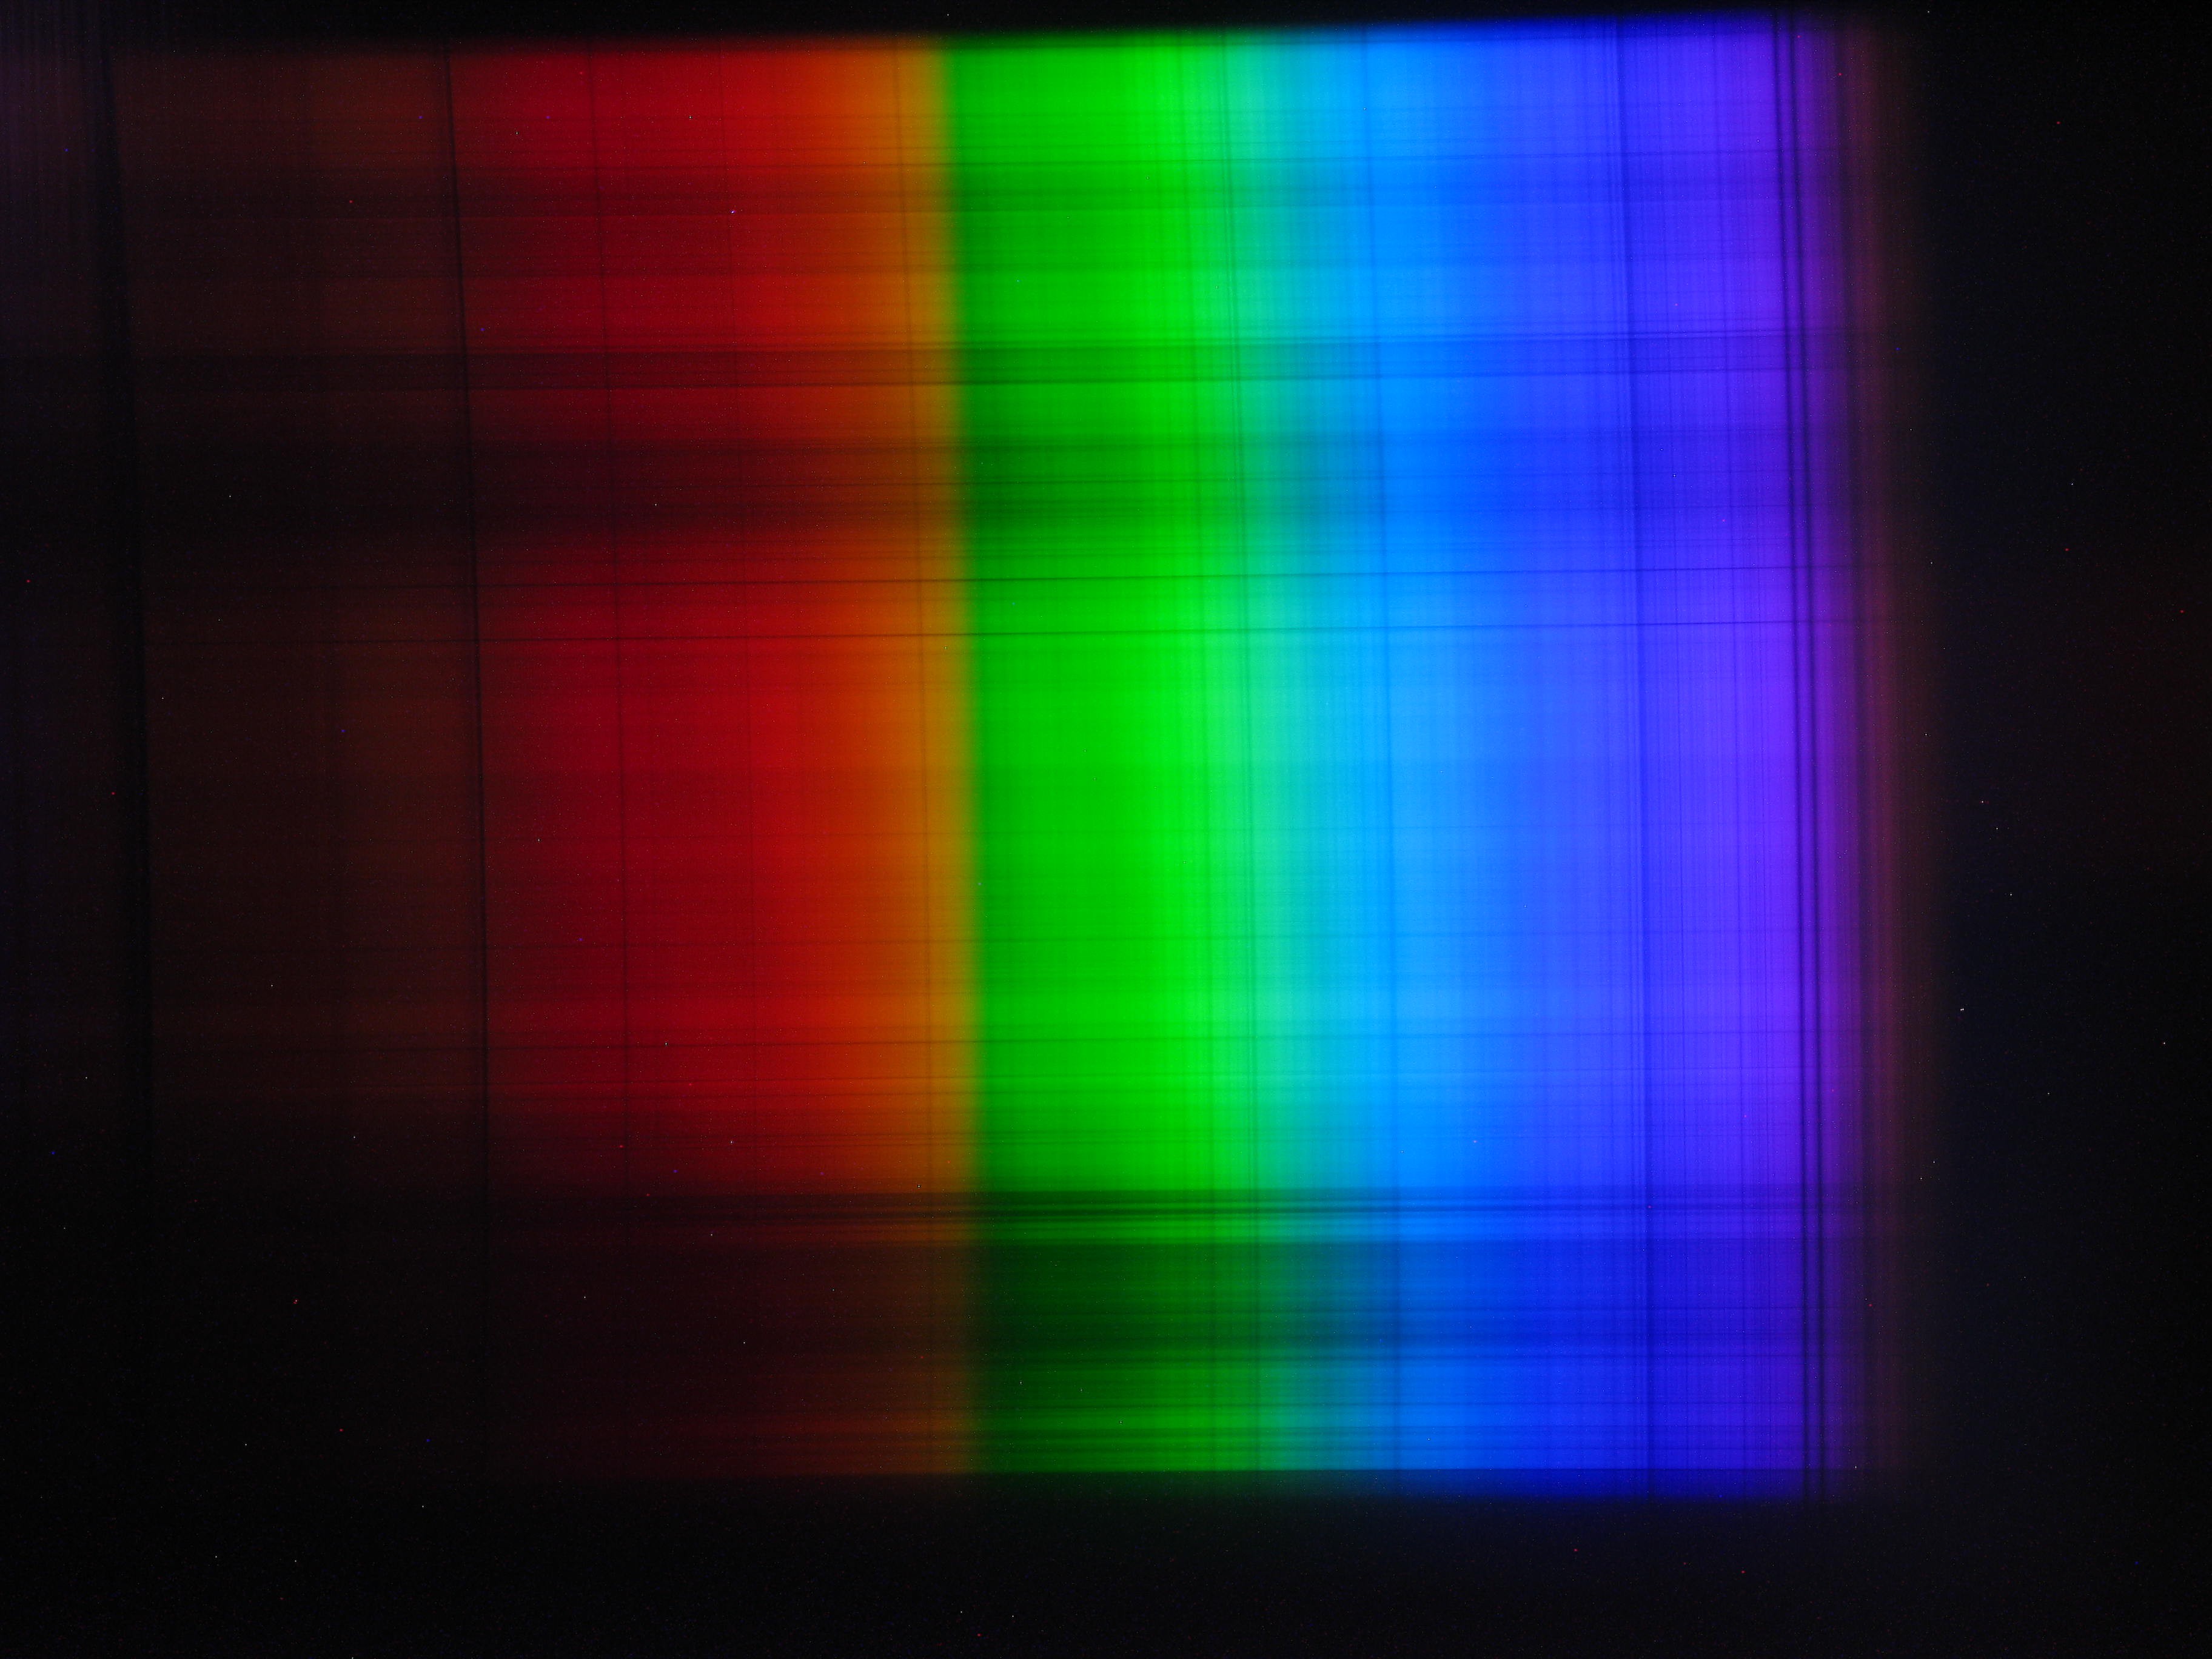
6. A couple of test spectra acquired by the setup:
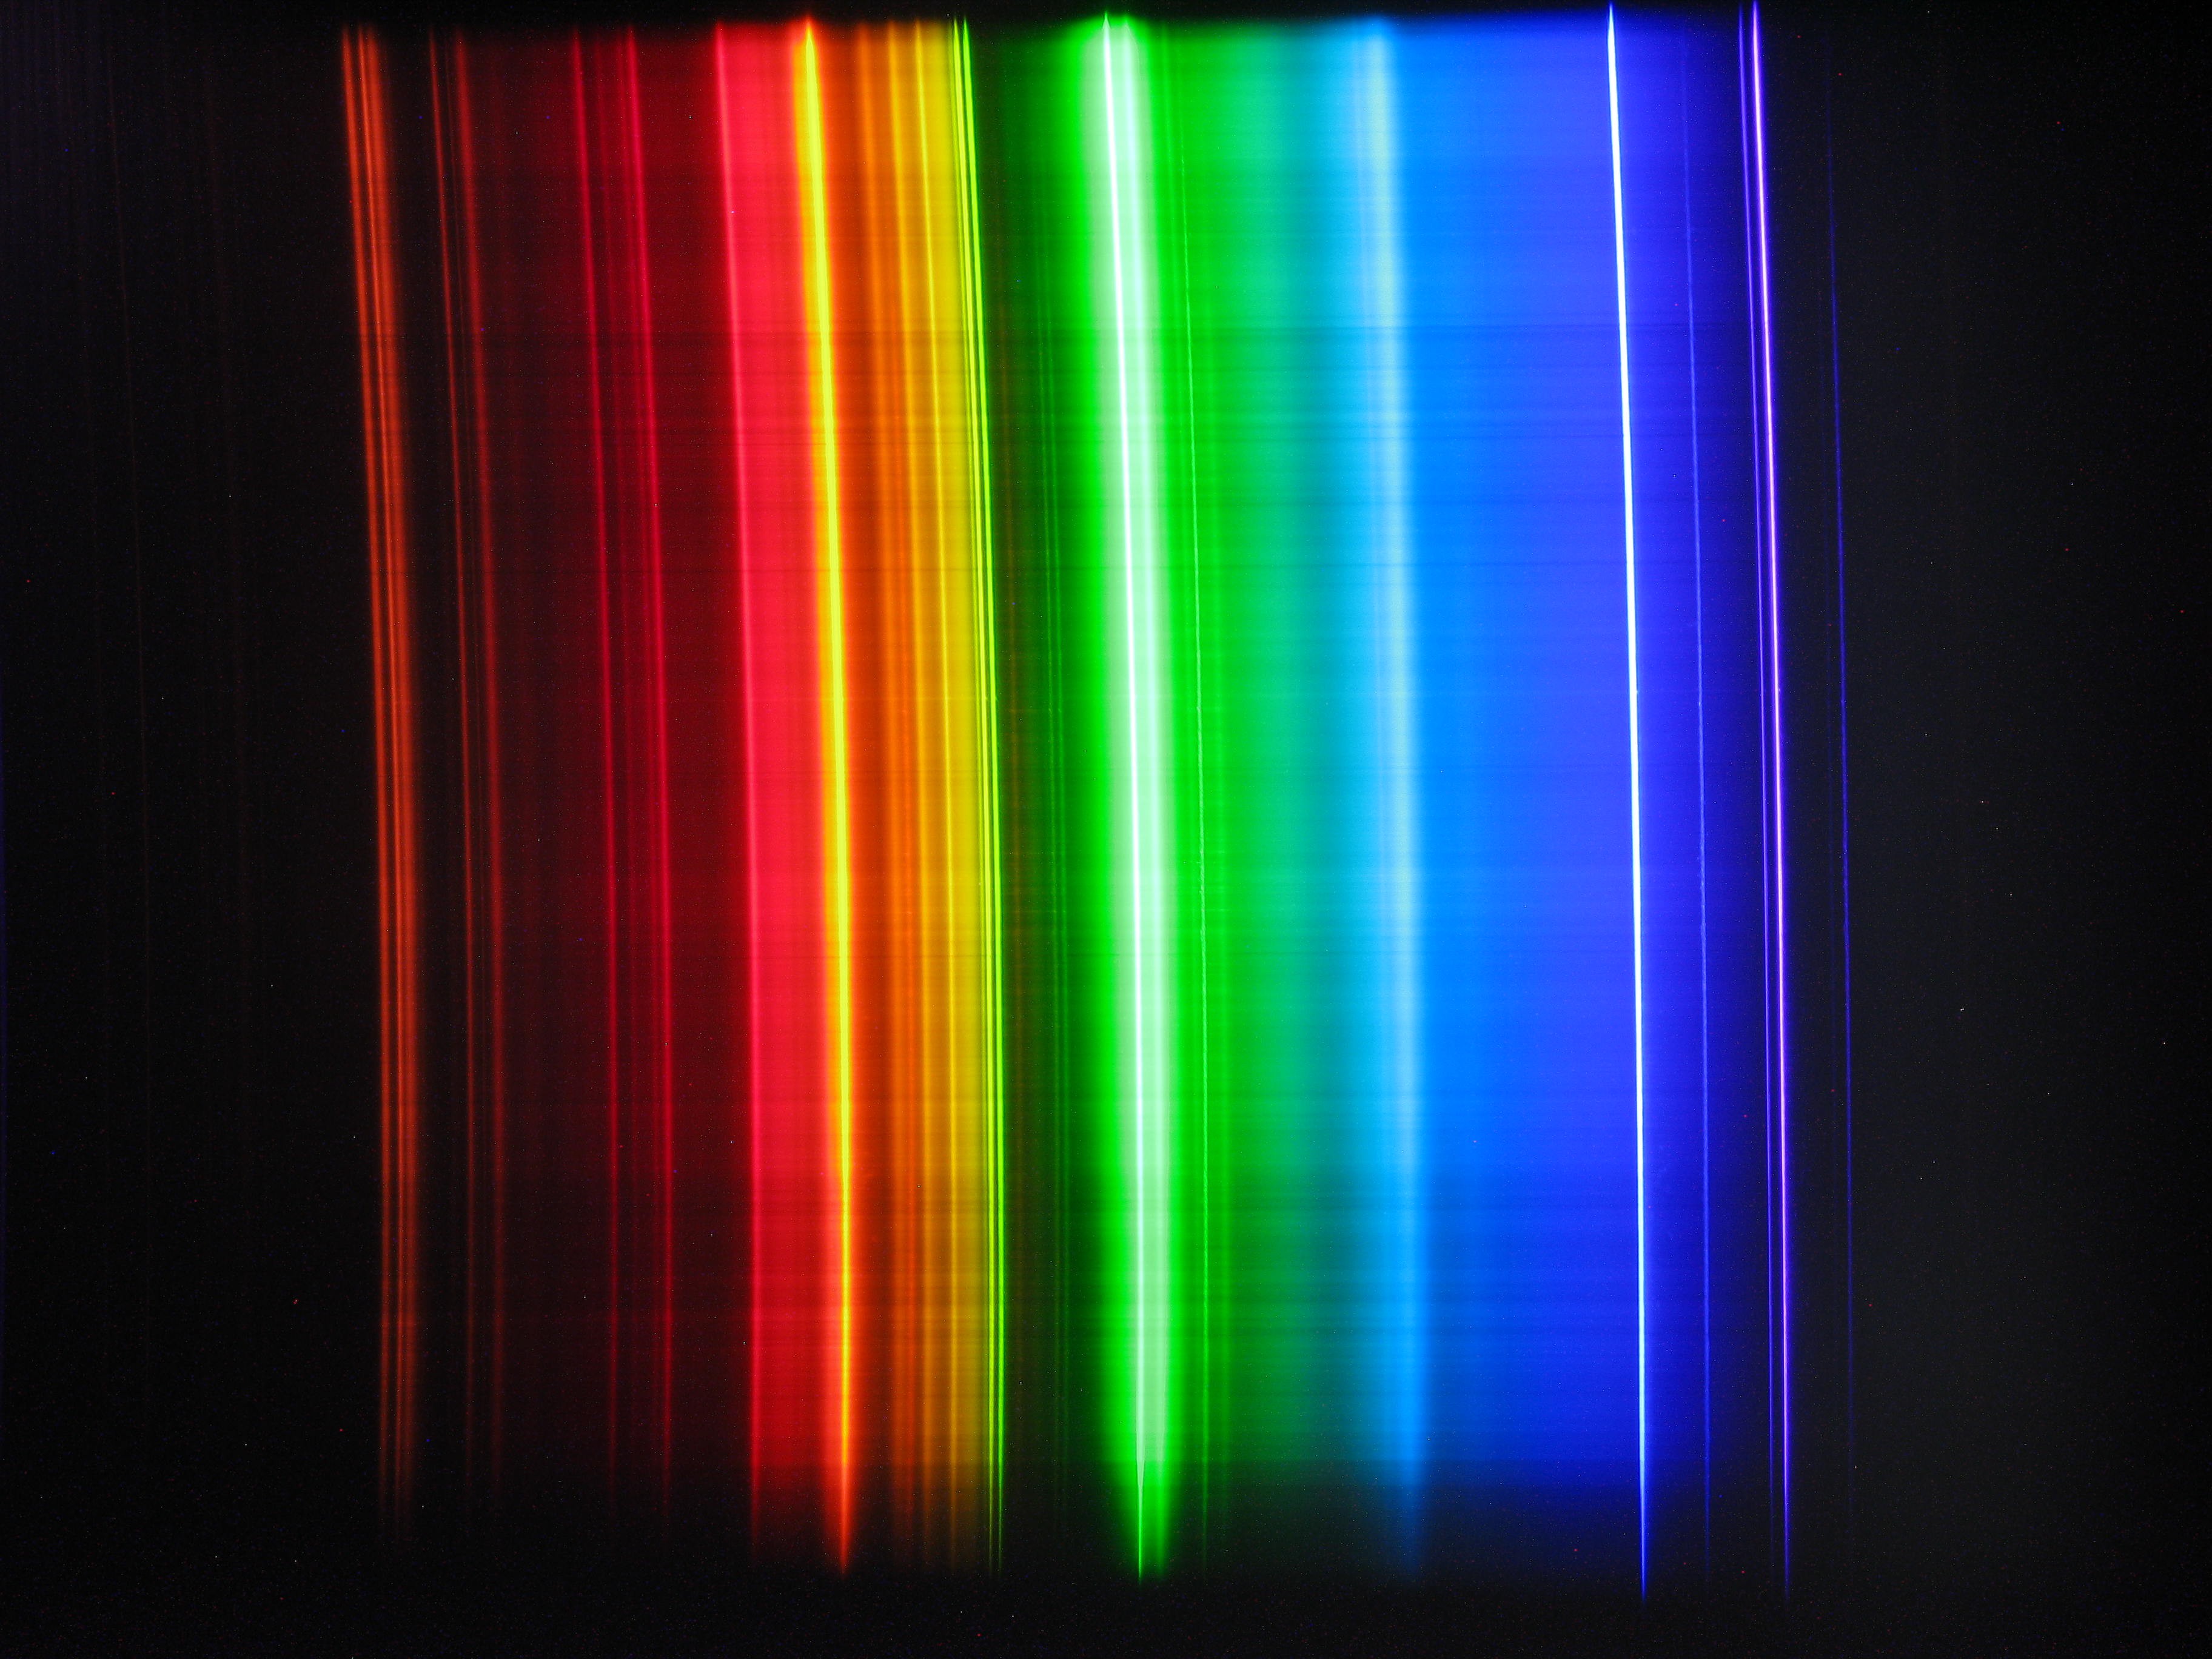
6.1. Compact fluorescent lamp:
![]()
6.2. The sky:
![]()
Currently other work is going on software for data processing.
As is evident from above spectra examples, there is a distortion (the "smile" distortion as I learned recently, which is real term) that causes spectral lines to arch. Also the slit is slightly tilted, as well as the grating, in its own way. It is possible to try to perfectly align the grating and the slit, but the distortion won't go away, as it is inherent to how the spectrometer works. It afflicts professional spectrometers as well, and the solution is in processing in software (unwarping, rotating, etc.).
I am in process of writing a program which will process this data, and now I try to devise a way to (semi-)automatically remove distortions, so the resulting spectrum would look cleaner and with spectral lines almost perfectly vertical. This way I would be able to integrate along the vertical axis over more than 1000 rows which will lead to acquiring spectra with very high signal to noise ratio.
-
The computational model
12/17/2020 at 09:18 • 0 commentsRecently, I have my interest in spectrometry relighted, and started to think about improving the spectrometer.
Now I plan to build a new version using plastic sheets instead of cardboard, and do it with better precision. Also collimating lens would be added so the spectrum can be focused sharp over wider wavelength range.
To better plan the layout the new version of spectrometer, and simply to better understand peculiarities of its operation, I created an interactive model, where many parameters can be adjusted, and results are seen right away.
The model is written in Javascript/html/css, works in web browser. Just download it to your desktop, unzip, and open included html file; best to view it at 50% scale.
It shows positions of main elements, and traces rays coming through slit, and also diffracted ones. It also shows the spectrum focused on camera sensor.
Here is the screenshot:
![]()
On the bottom is the image of spectrum. It is modelled as a series of spectral lines at regular intervals, ranging from 350 to 1050 nm, maximal range of camera sensor sensitivity.
For camera lens focal distance, the 21.6mm is used as it stated maximum zoom focal distance for Canon A490 camera.
In this model, to see how spectrum is formed without collimating lens, one should move it to the left of grating, so it has no effect on rays hitting it. This way one can see how my cardboard spectrometer works.
I hope to build actual new version in less than a month, and post progress here in further logs.
DIY Optical spectrometer / spectrograph
The apparatus allows to take spectra of light sources in range from ~400 to ~1000 nm