 Brenda Armour
-
When a Step has been Taken
11/10/2016 at 23:48 • 0 commentsI know I have missed so many deadlines but this project still intrigues me so I will continue. Blue Mix gave me grief all last weekend up until today. I received errors that the route could not be found or the endpoint could not be reached. I had rebuilt my Node Red on Saturday but then received the same errors on Sunday. So I restaged the application after going through the logs that the app had run out of memory. Bluemix is not for the faint of heart. Rebuilding the app did have its advantages and did provide an opportunity to simplify the model. I included a High Pass Filter to compare to the Dynamic Threshold. I added an indicator to light up if the Filtered data is < Dynamic Threshold i.e. a step has been taken. But this short video does not include a time frame to exclude steps outside of the time frame.
Red Node Model Revised:
![]()
-
Moving forward on Calculating Distance
10/21/2016 at 12:13 • 0 commentsMeasuring distance is a important component of this project. I am finding graphing the data in Freeboard is an excellent check to see if my calculations make sense. I have calculated the dynamic threshold and now will compare the second data to the first. I have used a node that delays the second flow by 1 second. Abit tricky but here is the initial graph. What I want is to determine if :
A step is defined as happening if there is a negative slope
of the acceleration plot (Flow2 < Flow1 ) when the
acceleration curve crosses below the dynamic threshold. I split the flow threshold into two flows. On Flow 2 I added a delay function to compare the first data to the second data coming in.
var delay=1000; //1 second
setTimeout(function() {  //your code to be executed after 1 second}, delay);
return msg;
As you can see in the video there is vibration going on even when the sensor tag is on my desk. A time window will next be added to discard invalid steps. At one point I move the tag around. The interval between two valid steps will be between .2 seconds and 2.0 seconds. Anything outside that time window will be ignored.
-
Understanding Motion Data
10/16/2016 at 12:29 • 0 commentsI am using Node Red and IBM BlueMix to send the sensor tag data to the cloud. I am using the accelerometer and magnetometer on the sensor tag to determine next position of a moving object. The Raspberry Pi 3 with built in Blue Tooth and WiFi is the gateway to the cloud. I have installed iot-sensor-tag to connect the Raspberry Pi 3 to Bluemix. More info can be found here.
Lets look at the raw data from the sensor tag. I am shaking the sensor tag in this demo.
I started experimenting with sensor data in 2014. The first board I used was the MEMS sensors evaluation board from Element 14. The board had a low-power 3D Magnetometer and a 3-Axis Digital Accelerometer. The video shows the board on a Raspberry Pi B. The kit also allows you with a website to move the board and visualize the accelerometer moving a car and a compass using the data from the magnetometer.
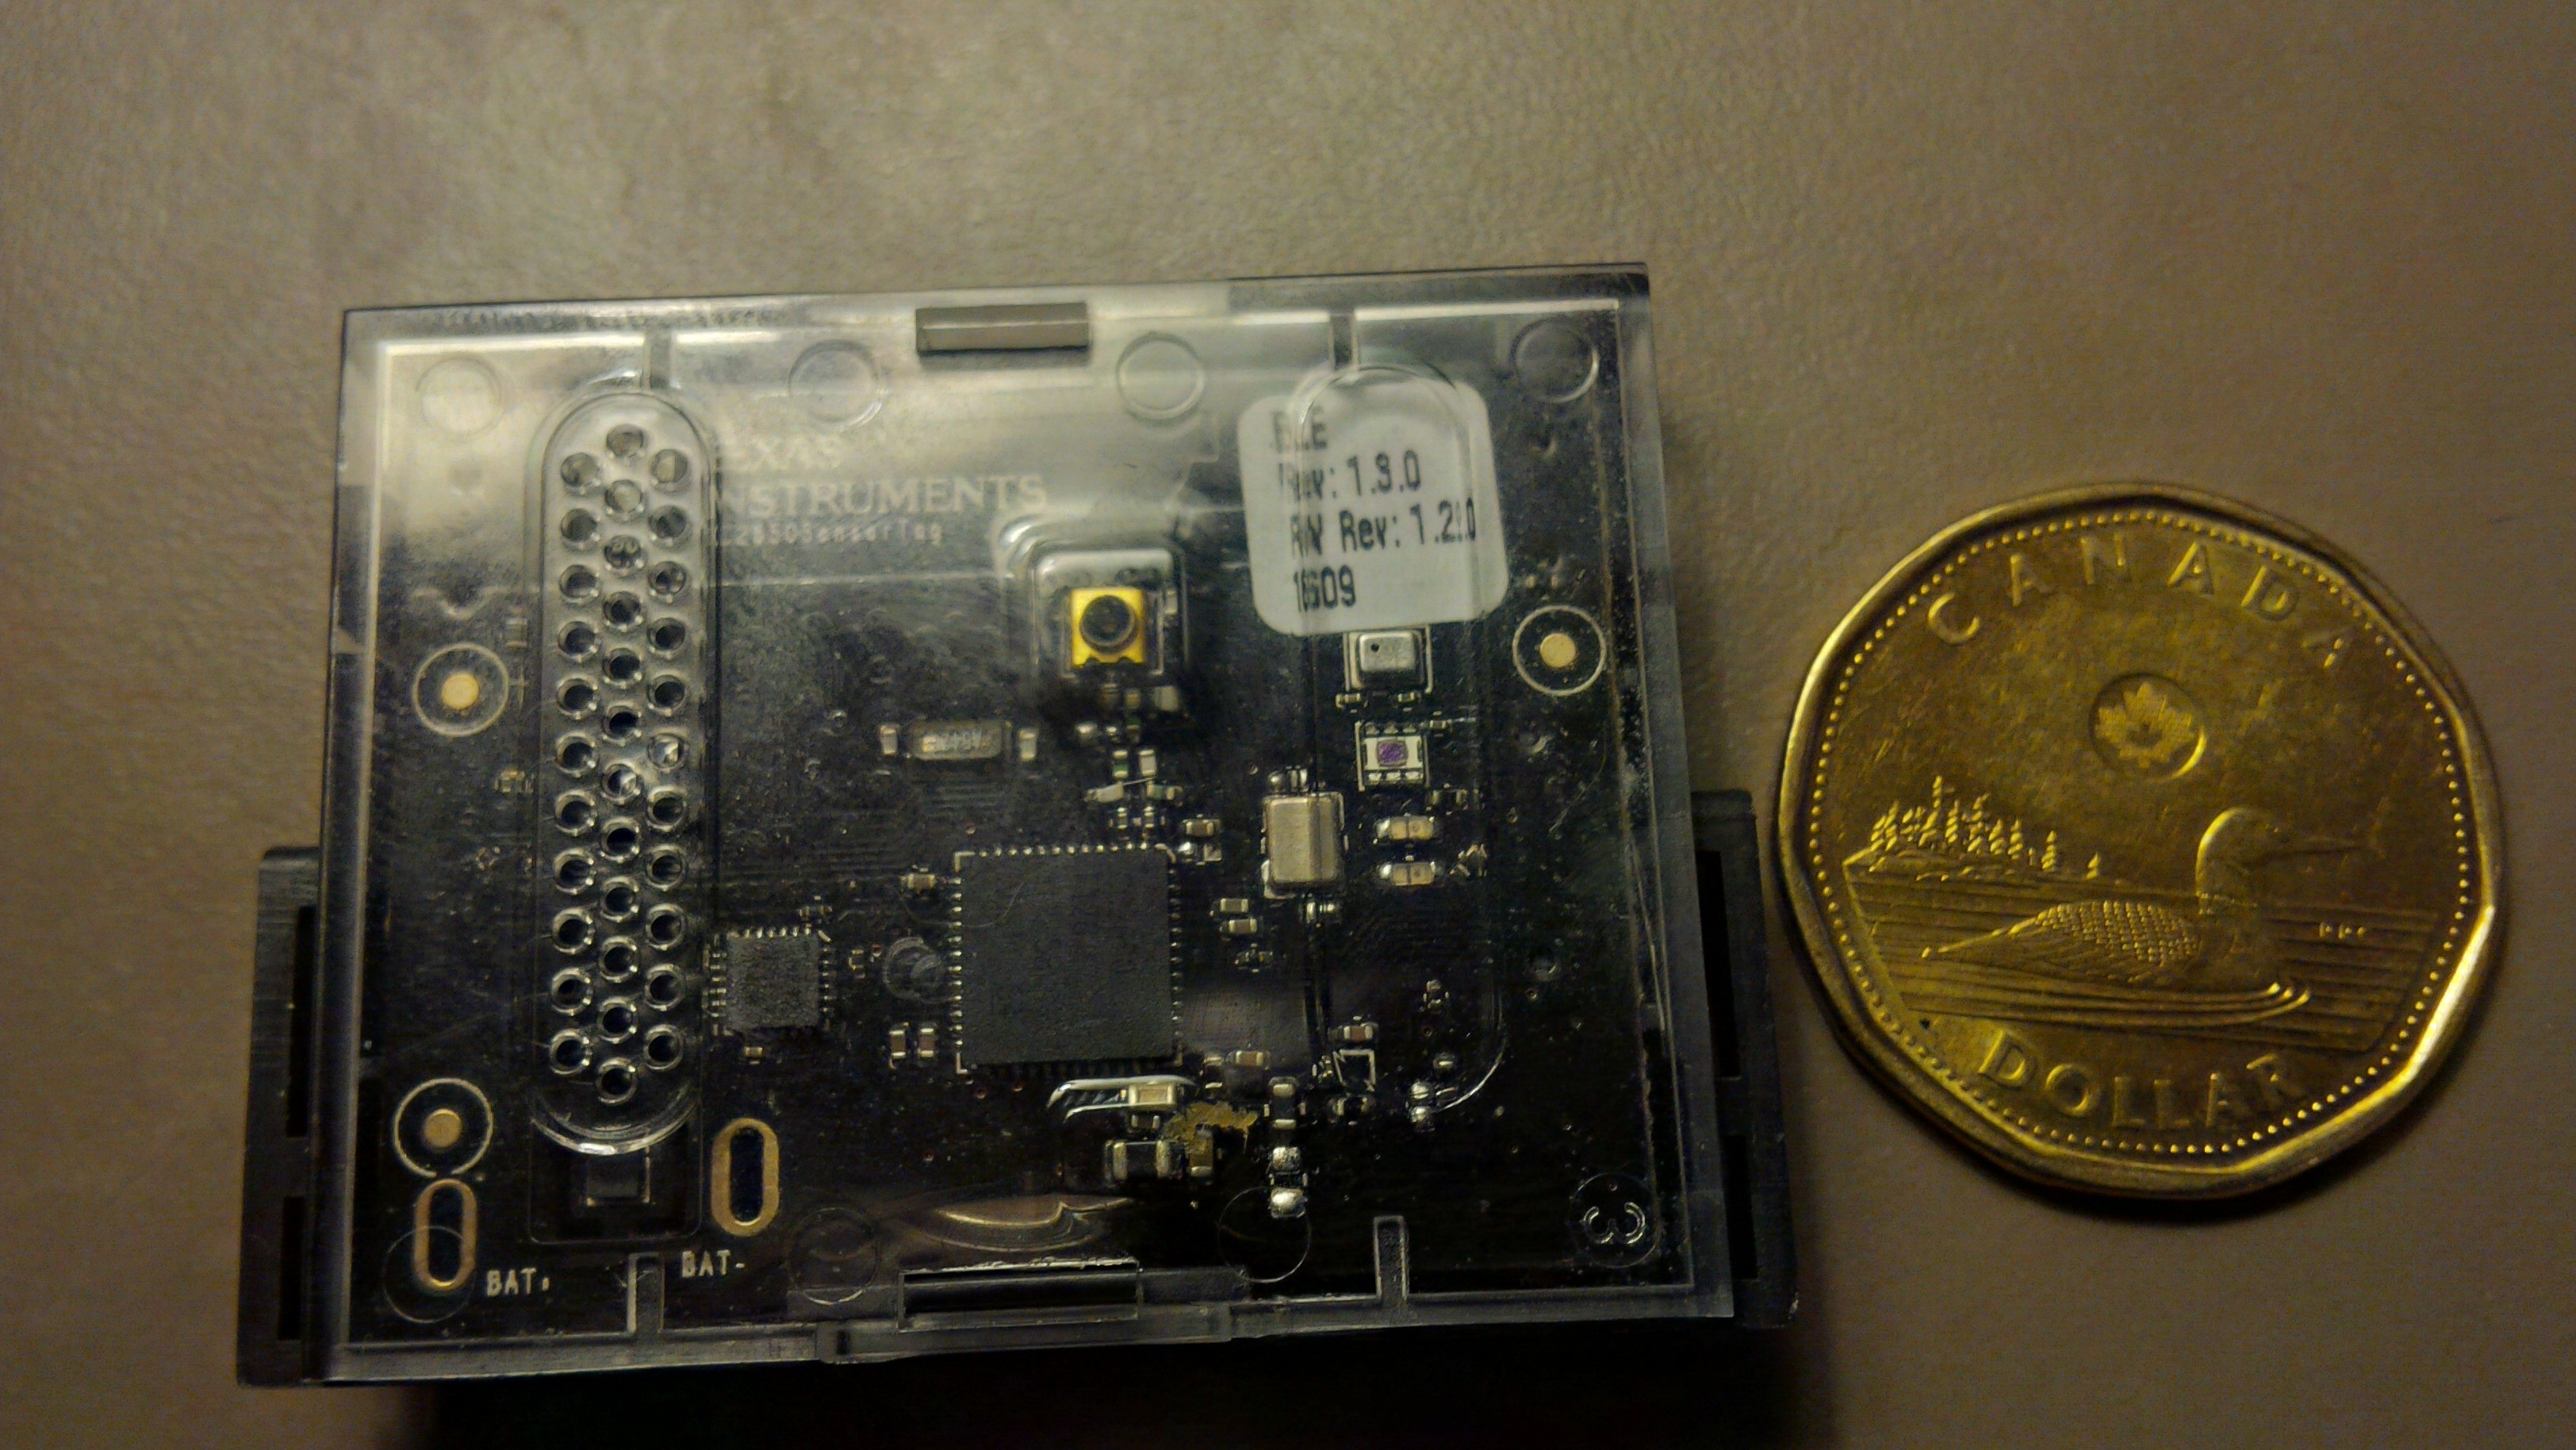
So the evaluation board was a great starting point. IBM Bluemix cloud/ Node Red and the Sensor Tag provided a way to mathematically calculate distance, bearing and velocity using the accelerometer and magnetometer. The sensor tag uses a coin cell battery that can last up to a year. All 10 sensors are enclosed in a small case. It is Bluetooth enabled and you can also use Zigbee protocol to increase distance. At this point I will be using Bluetooth.
![]() Node Red already comes installed on the Raspberry Pi. I am using the cloud version because it was easier to program. I am also using Freeboard as a dashboard and Dweet.io to collect the data. I added some nodes to accomplish calculations for the algorithm. Smooth node info can be found here.
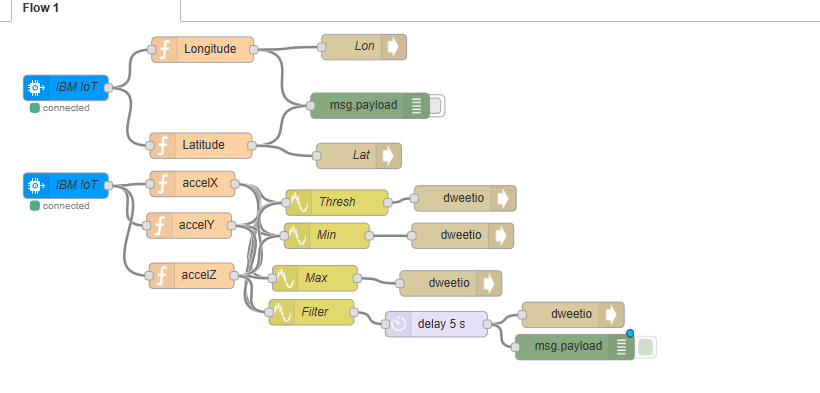
Node Red already comes installed on the Raspberry Pi. I am using the cloud version because it was easier to program. I am also using Freeboard as a dashboard and Dweet.io to collect the data. I added some nodes to accomplish calculations for the algorithm. Smooth node info can be found here. So can you calculate distance using an accelerometer ? This is essential to calculate position of a moving object. I am going to be using a pedometer design based on the 3 axis of the accelerometer data. Here is my node red design ( work in progress ) . The goal is to recognize and count steps. This will allow me to measure distance and speed. It appears I have two different flows but I am using Global Variables in my equations. I highly recommend this article on writing functions in Node Red.
![]() A simplified view of the model :
A simplified view of the model :At every 10 samples the maximum and minimum of the accerometer axis is taken. The dynamic threshold is calculated with (Max + Min)/2 . A placeholder holds the first sample and then compares it to the next sample. A step has been taken if the new sample < previous sample. . More to come !
-
Using Accelerometer and Magnetometer Data to Calculate Position
10/13/2016 at 00:08 • 1 commentAs you can see this is a Work In Progress. I will publish more detail as to how I reached this point. I have included Outside Weather Conditions in this model.
Tracking without GPS
A different approach to tracking animals using Raspberry Pi 3, Texas Instruments Sensor Tag cc2650
 Node Red already comes installed on the Raspberry Pi. I am using the cloud version because it was easier to program. I am also using Freeboard as a dashboard and
 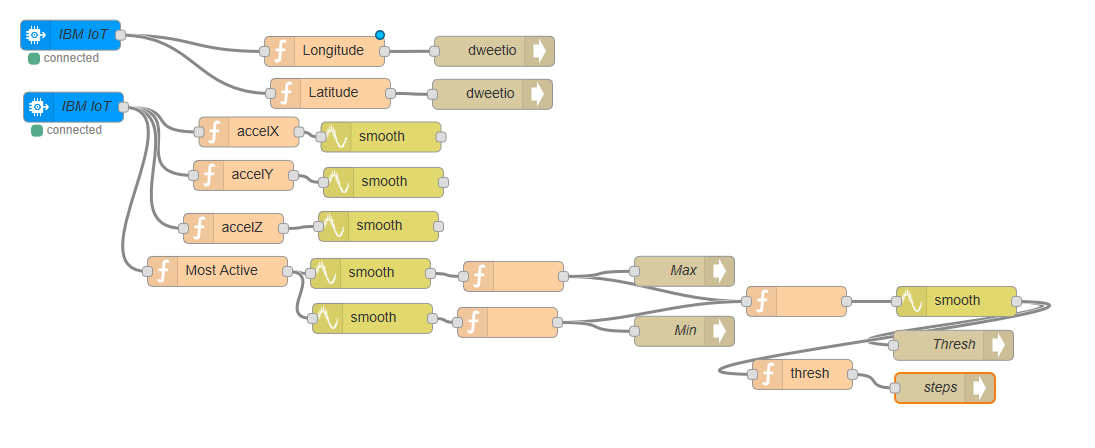 A simplified view of the model :