 Initial State
-
1Initial State
The first thing you'll need to do is create an Initial State account. Go to https://iot.app.initialstate.com to register a new account or login into your account. It's as simple as entering your email & password. You'll have a 14-day free trial before it requires a subscription and it's free for students with an edu email address.
![]()
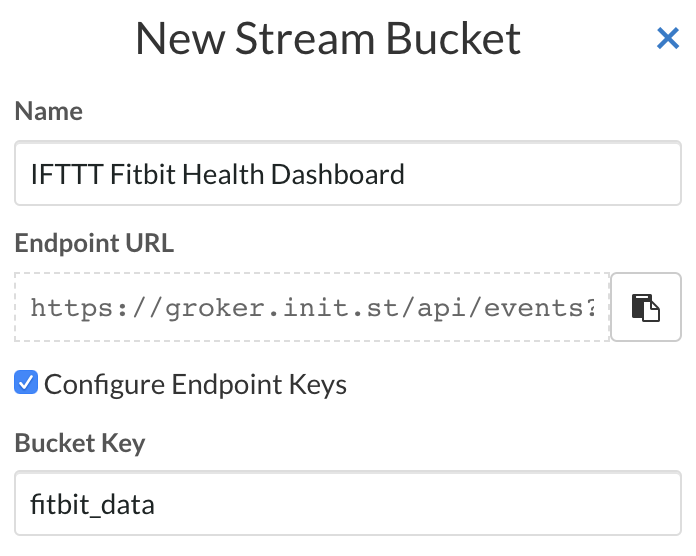
You will need to create a new bucket for your Fitbit data. Go to your bucket shelf on the left and look for the plus sign cloud button to the right of the search bar. This will create a new stream bucket. Check the Configure Endpoint Keys box to have access to the Bucket Key name. I changed the name of the bucket to "IFTTT Fitbit Health Dashboard" and the bucket key to "fitbit_data", but you can make these whatever you want. Once you've made those changes click the Done button at the bottom and your bucket is now created.
-
2IFTTT
The second account you will need to created is an IFTTT account. Go to https://ifttt.com/ and sign up with a email address, Google account, or with your Facebook account.
Some vocabulary to help us get started with IFTTT. Services are apps and devices you use daily that IFTTT is connected to (Fitbit, Strava, Instagram, Evernote, etc.). Applets use the Services to create actions. We will be creating Applets with Fitbit and Webhooks to send the data to Initial State.
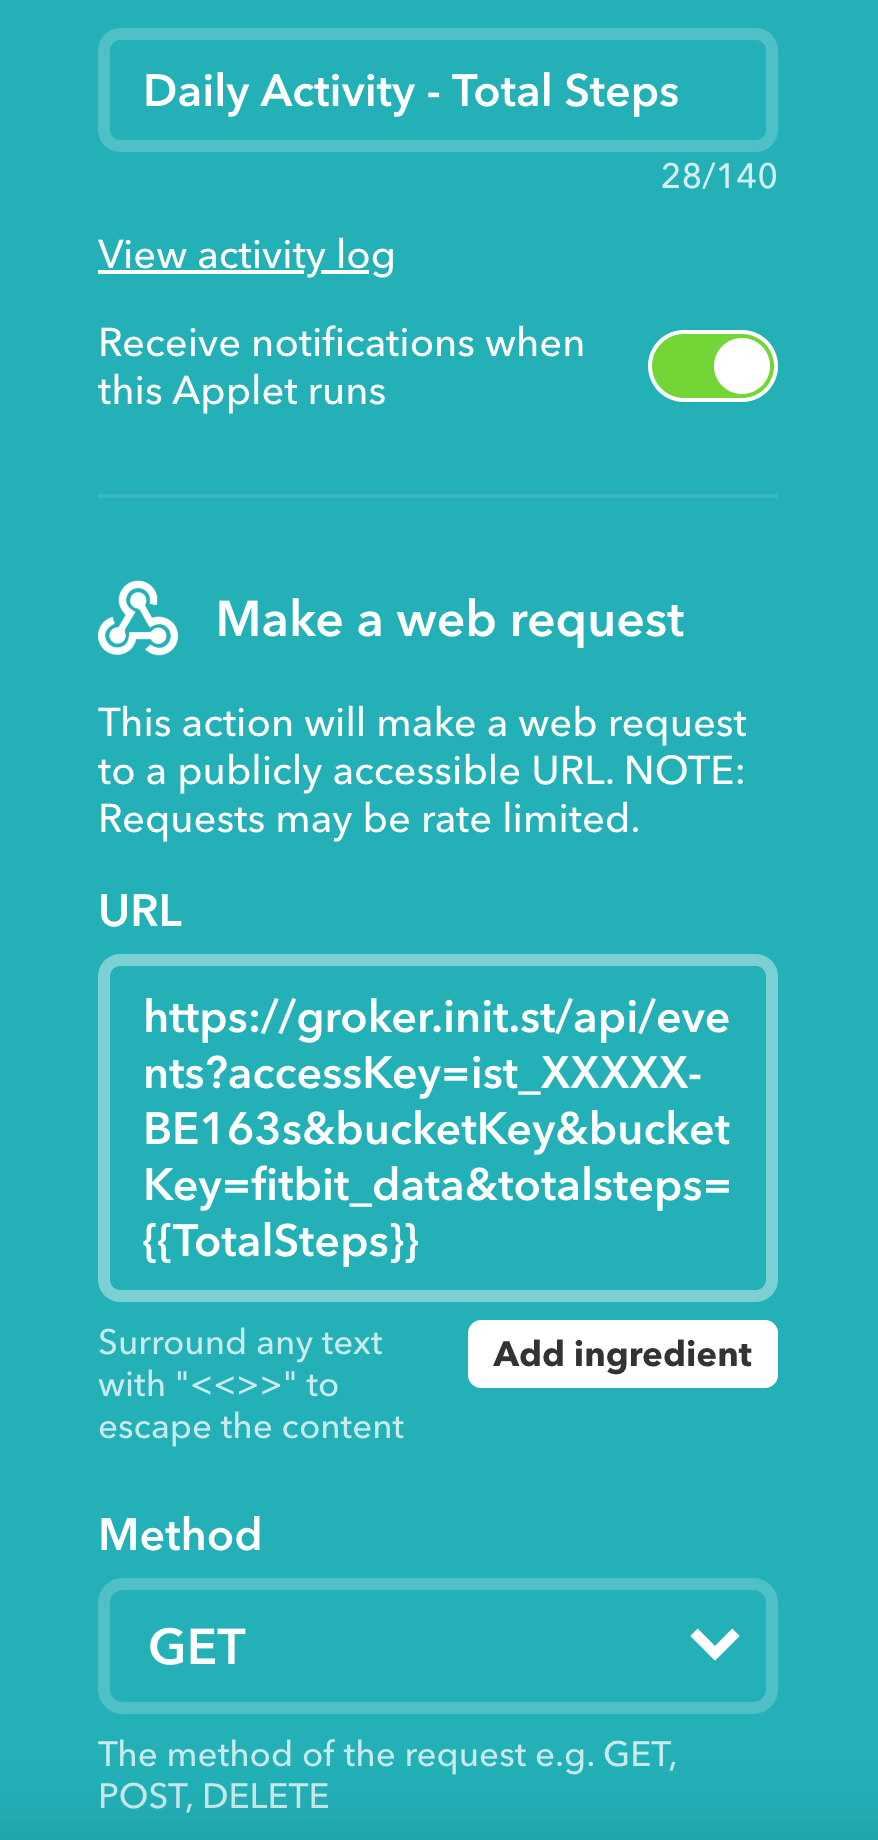
Go to My Applets and click the New Applet button. Click the +this button and search for Fitbit. To start, select Daily Activity Summary. Next click +that and search for Webhooks and select make a web request. In the URL box you will want to copy and paste your API endpoint from your Initial State account. You will find this in the Settings of your Fitbit data bucket. To the end of that API endpoint you will add "&", a data value name, then "=". Click add ingredient and choose the data you want to stream.
![]()
For my example I chose Total Steps. So my URL looks as follows:
https://groker.init.st/api/events?accessKey=ist_XXXXX-BE163s&bucketKey=fitbit_data&totalsteps={{TotalSteps}}Select Method as GET. Leave Content Type and Body blank. Once complete click save. You've now created your first Applet!
-
3Create More Applets
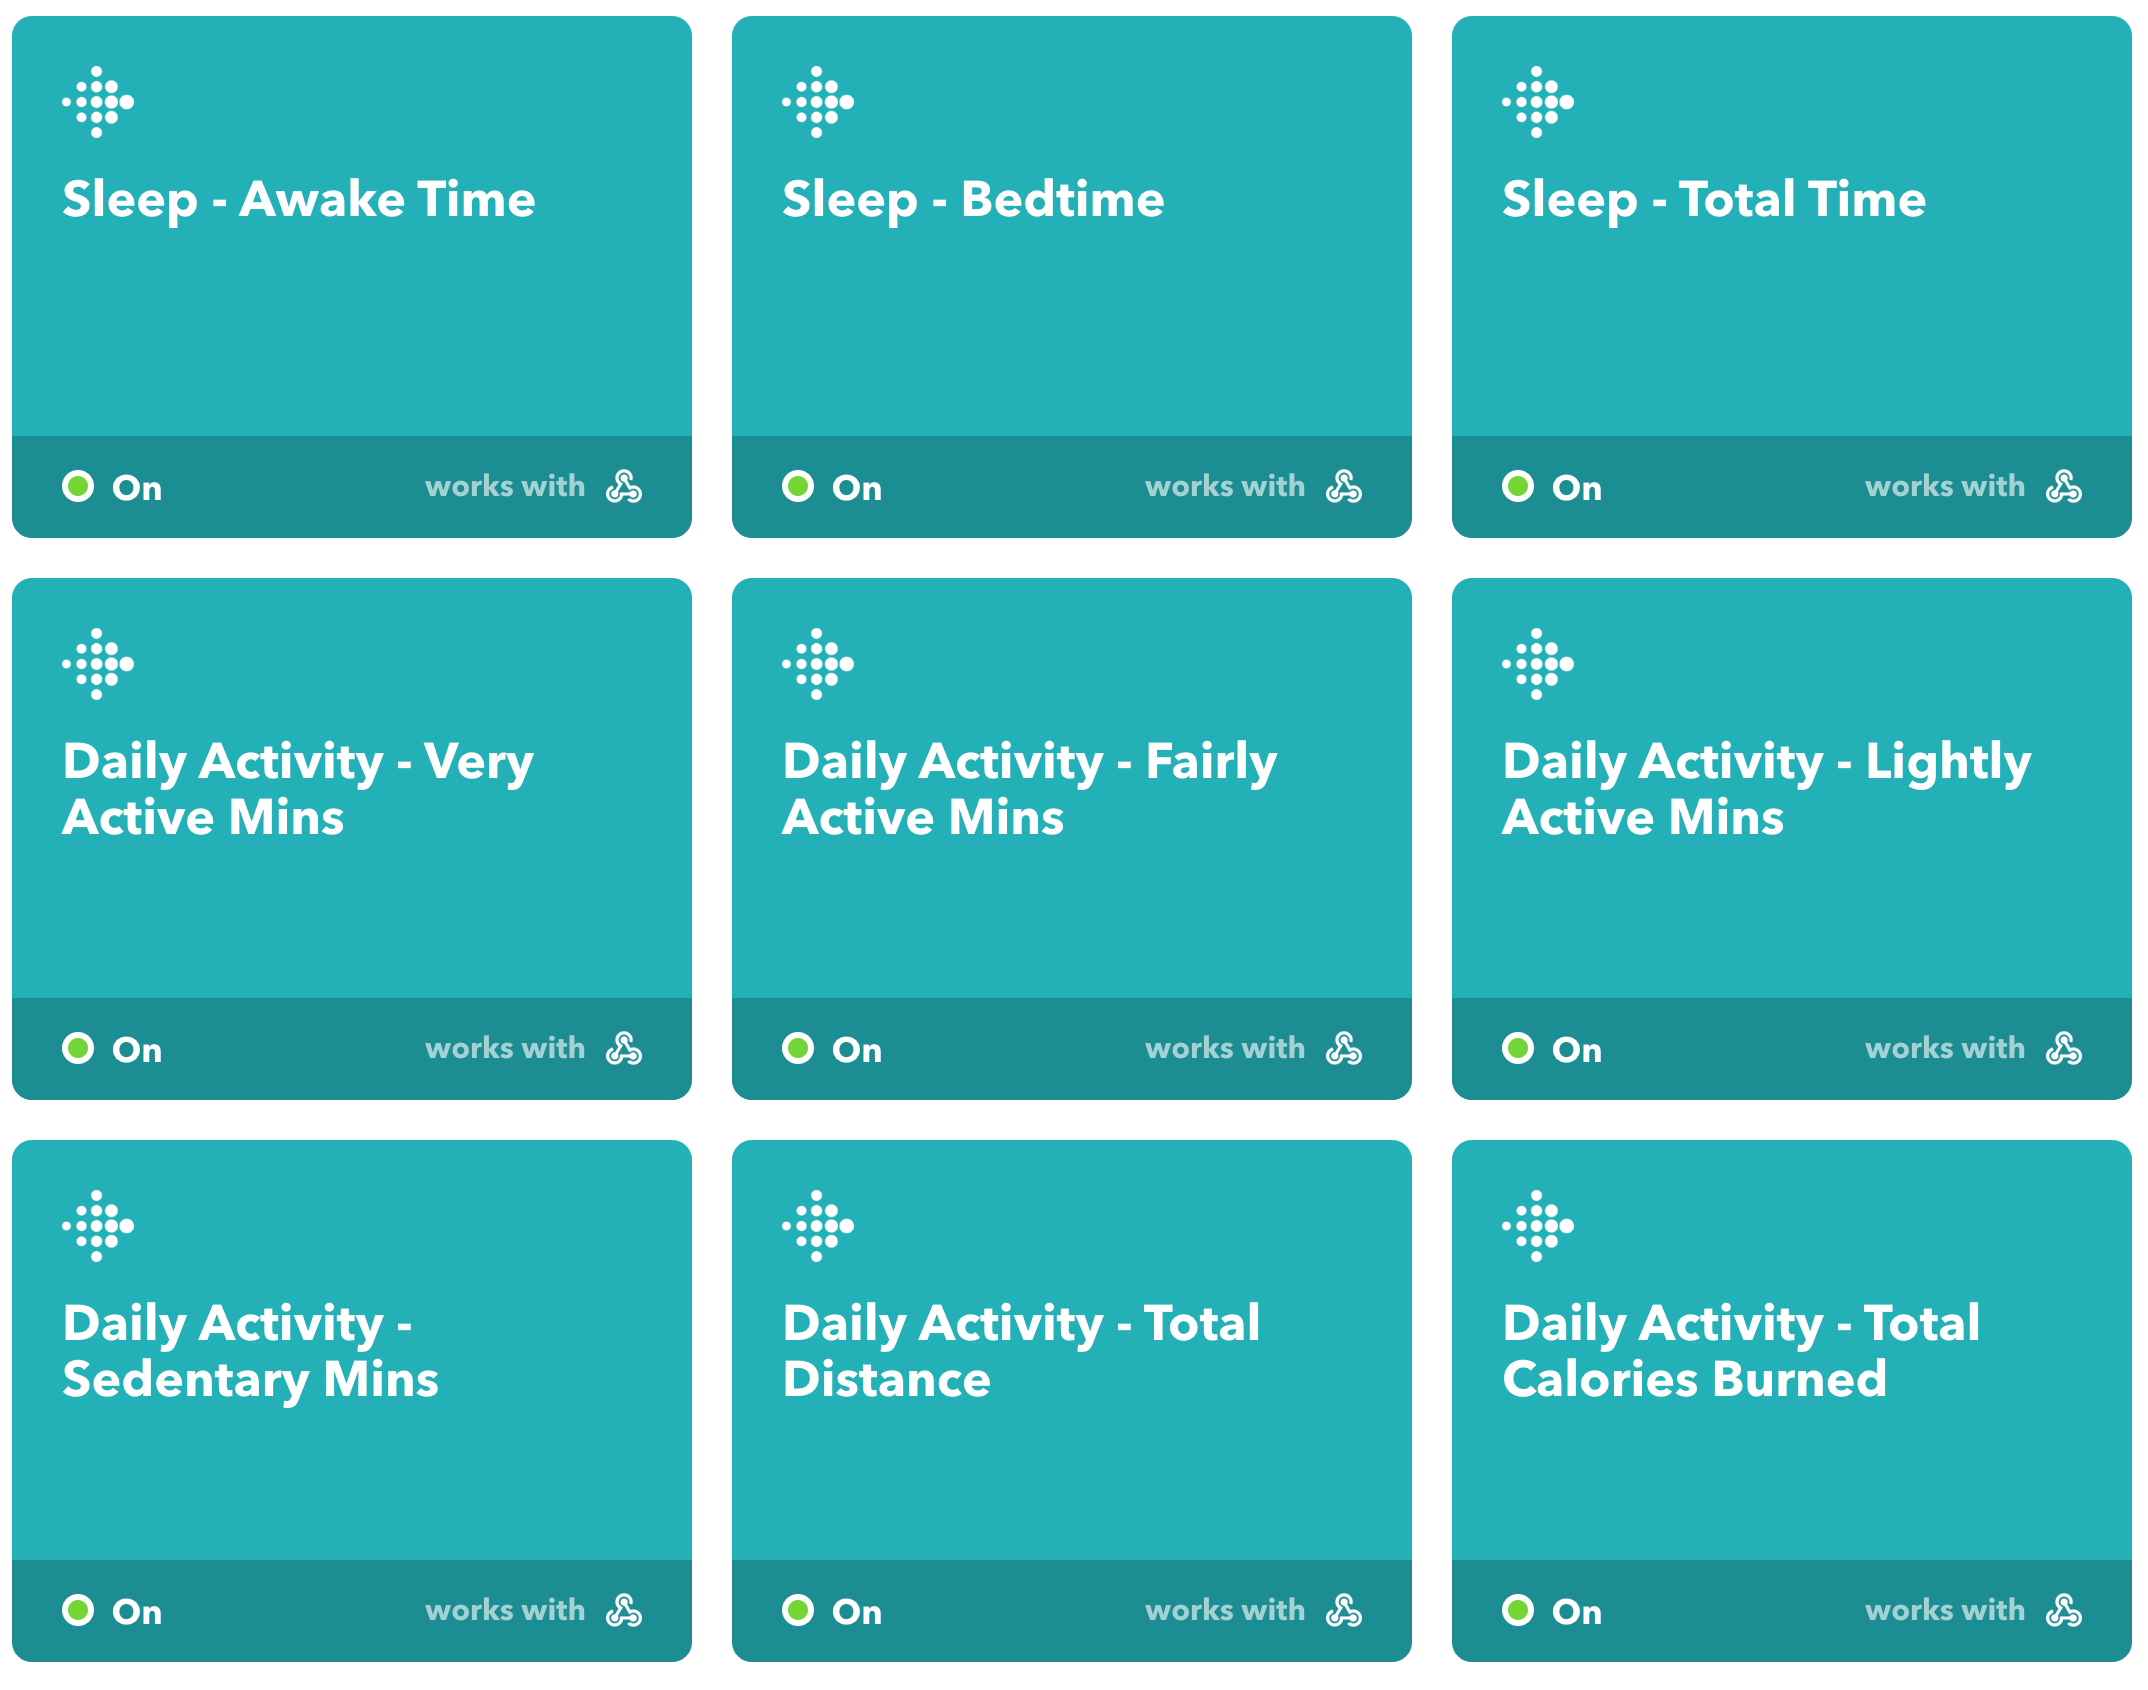
Now you need to repeat the last step for all the data you want to track. This can be a bit tedious but it's necessary to track everything you want to track.
![]()
I personally decided to track the following:
- Awake Time
- Bedtime
- Total Sleep Time
- Sedentary Minutes
- Lightly Active Minutes
- Fairly Active Minutes
- Very Active Minutes
- Total Calories Burned
- Total Steps
- Total Distance
- Weight
Any Applets that use the Daily Activity Summary will update once a day when you sync your Fitbit and the others will update once information is logged (weight, sleep, etc.).
There is one thing to note here. There is a usage limit on the Fitbit service, aka how often you can use it. If a usage limit is reached the applet will generally try to run again later that day. You can view whether an Applet successfully runs by going to the Activity Summary page.
-
4Initial State Dashboard
![]()
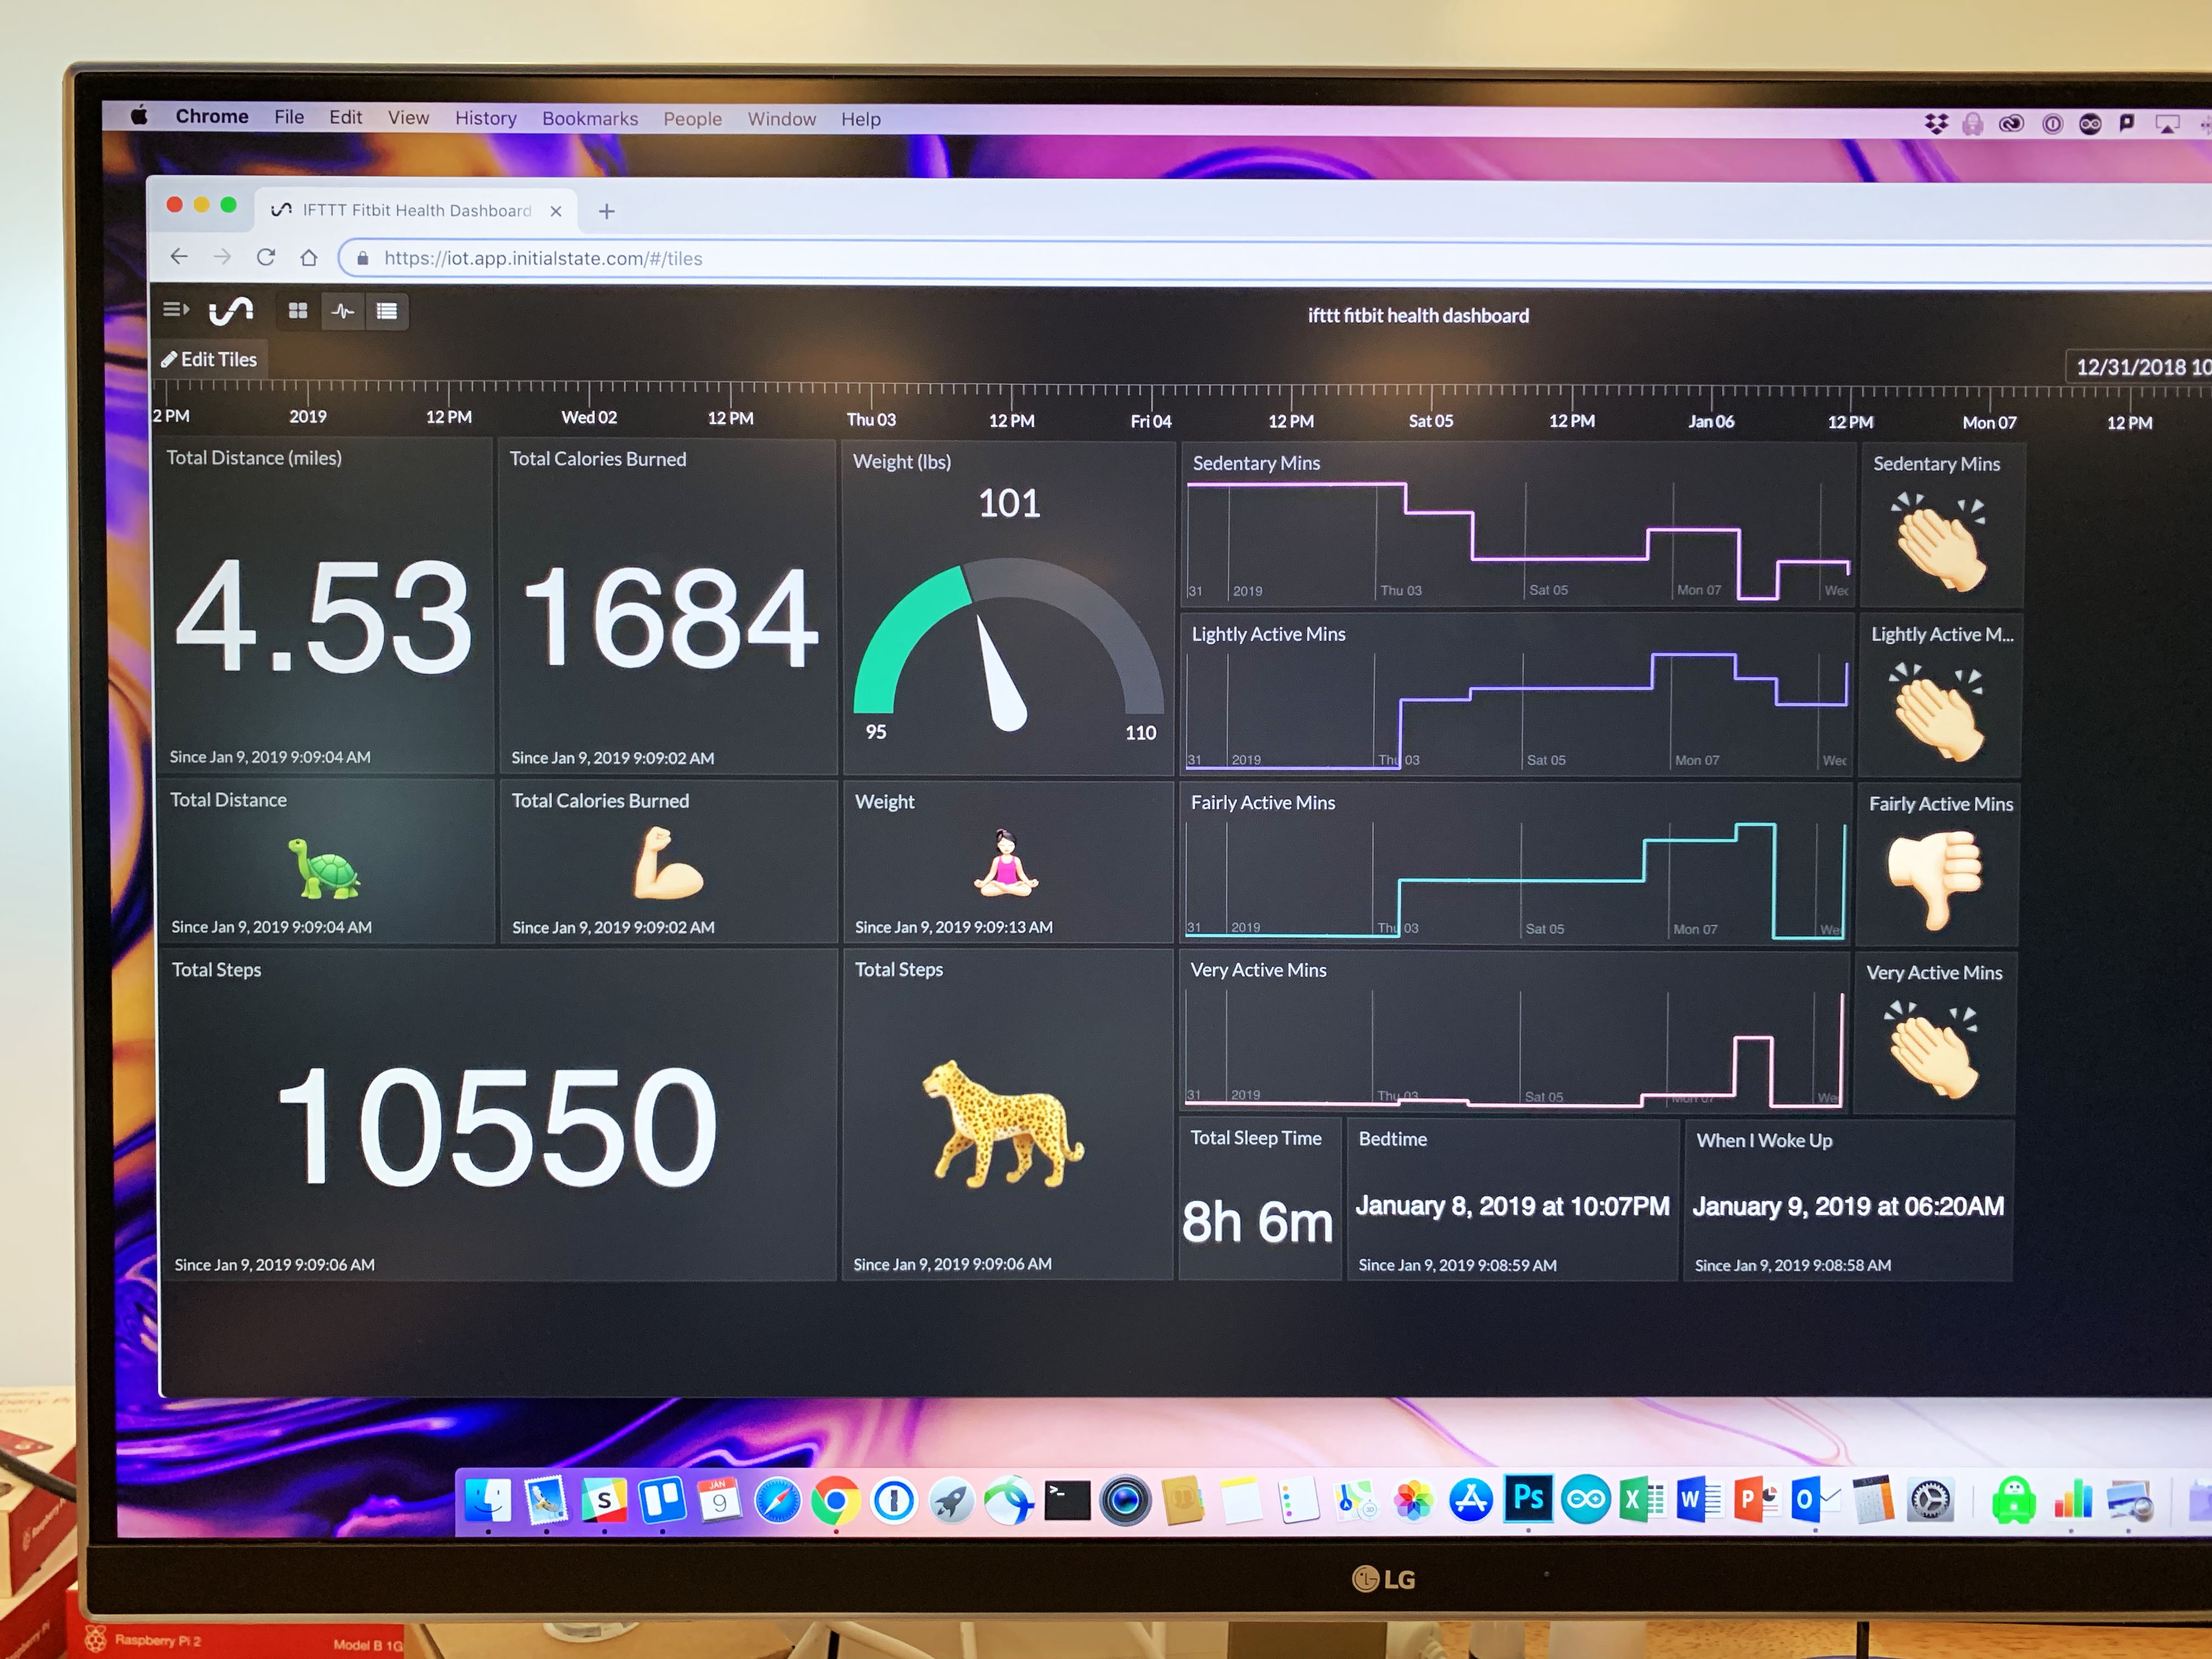
All your data will come in and set as a general data type in Tiles. This is the fun part. Change your Tiles to different data types and add Real-Time Expressions. I'll explain how to do all of these to make your dashboard to most effective and beautiful it can be.
Tile Types
To change a Tile, right click on the Tile and select Edit Tile. You can change the Title, use the dropdown to select a Tile type, and for line/bar/gauge graphs you can select the data color.
There are lots of options of how to display your data. For my own dashboard I used a summary for total distance, calories burned, total steps, wake time, bedtime, and total sleep. I used a line graph for sedentary, lightly active, fairly active, and very active minutes. For weight I used a gauge graph. There is an unlimited combination to design our dashboard.
To move the tiles around click Edit Tiles in the top left corner. You can change Tile shapes & sizes and move them anywhere on your dashboard.
Expressions - Emojis!
I use Real-Time Expressions to code emoji Tiles. This allows me to get an instant update when I check my dashboard to see if I've hit my goals or not. My favorite example is for total distance. If I get 5 miles it is the running lady emoji and if it's 4.9 or less then it's a turtle.
-
5Conclusion
Here is a link to my personal dashboard so you can see how it looks and how I'm doing!
Now you have a fully built dashboard. You can view your trends and compare different days to see how your activity varies. Let me know if you have any questions!!
Fitbit IFTTT Dashboard
Send all your Fitbit data to a single dashboard where you can view trends and compare activity at different times.
Discussions
Become a Hackaday.io Member
Create an account to leave a comment. Already have an account? Log In.