 Radu Motisan
-
Site v5.0
05/14/2017 at 18:24 • 0 comments![]()
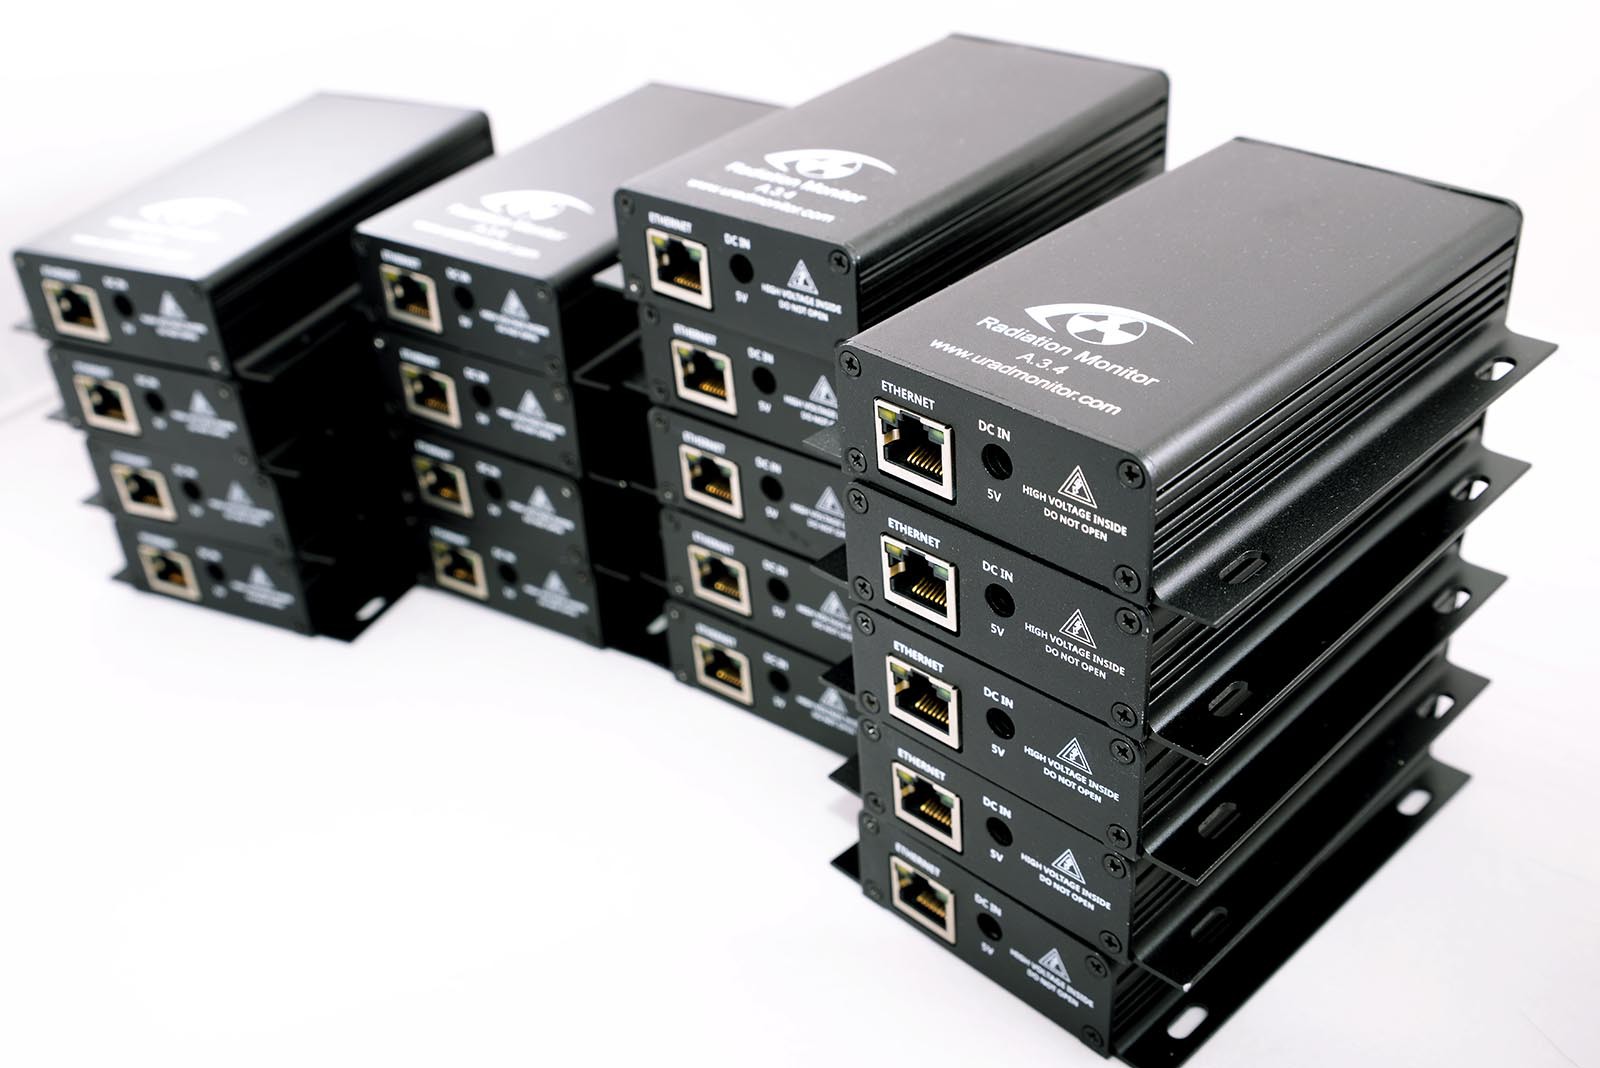
The continuous improvements to the uRADMonitor network are demanding more changes both to the units themselves but also to the central infrastructure. While we saw considerable progress on the hardware side with the model D and the new model A3 and model CITY units, the server was also been in the attention with important new additions like the Dashboard or the Dynamic ID system used in the Open Source KIT1 hardware. And since the last 4.0 upgrade, these are just a few of the many new features implemented.
![]()
To summarise the new v5.0 frontend in a word, that would be “dynamic”. Both the maps and the charts are interactive, and this translates to better access to the data. With the new uRADMonitor detectors (like the model D that runs on battery and has a built in GPS), the frontend had to support a new class of uRADMonitor devices, the mobile units. Here’s a demo video presenting these units and the support we added for them:To iterate some of the things presented in the video, the major features include:
1.Mobile units support
The map will refresh automatically to update the position of mobile units in real time. Speed and altitude are displayed, while the readings in the chart will update accordingly. Make sure the “Automated refresh” option is enabled, and your unit is selected (Blue dot). In “Cluster” and “Gradient” visualisation modes, the mobile units are displayed as triangles, while the fixed units are represented as squares. A cluster of units is a circle, with its size proportional to the number of units contained.2.History view
If History view is enabled in the left menu and a mobile unit is selected, you will see the history chart at the bottom for the time interval you’ve selected, but also the corresponding path that unit covered on the map. This powerful feature will quickly identify various measurements to their exact location on the map.3.The left menu
Includes two new selectors: one for the sensor parameter and one for the time interval. You can use them to see uniform global data on the map. If a particular unit is equipped with the sensor you’ve selected (eg. Temperature), its last 24hours average of the particular measurement will appear on the map. The default visualisation view is set for “Clusters”, meaning nearby units will be joined in clusters, depending on the zoom level, to make the vizualization cleaner and easier to follow. The clusters will be labeled with an average of all the units included, and the circle symbol will have its size proportional to the number of units included.![]()
Clicking a cluster will zoom in to its comprising area, while also showing the contained units at the bottom. Click them to open:![]()
4.Direct ID access
When you click a cluster you see its comprising units. You can click these IDs to open a particular unit and see the readings history. If you want to open a unit directly, you can still use the previous syntax:http://www.uradmonitor.com/?open=ID
Here is a quick example to that: http://www.uradmonitor.com/?open=11000017
5.Visualisation options
The other visualisation options include Simple, Gradient, Heatmap and Cluster, use them as needed. Change the Sensor selector to the value you are interested in.
The heatmap presents a color function that takes both the weight and the density as arguments. Keep that in mind when interpreting the visual representations. Zooming in will be needed to remove the density factor if color interpretation is required.![]()
5.Legend
For the “Clusters” and “Gradient” visualisation methods, a Legend is displayed at the right-bottom corner of the map, to provide a quick indication on the scale of the values represented on the map. The legend will show a minimum and a maximum value, and the Unit of Measure of the sensor you selected. For example, PM2.5 will use micrograms per cubic meter, while CO2 will display in ppm (parts per million). Radiation will show in microSieverts per hour, and so on.![]()
6.More detailed unit view
When selecting a unit, the bottom part of the screen will load a chart showing readings for the selected time interval, and for the selected sensor. This part of the screen was also designed to pack more information, like type of hardware detector, version, time it joined the network, and more.![]()
Like before, these charts support zooming by drag and drop, both on the horizontal and the vertical axis. This mechanism allows to zoom in on the time factor, or the actual value being measured, to analyse various pulses and trends in the data. To revert to default zoom level, simply double click the chart.7.The dashboard
This part of the new site v5.0 was covered in a separate article. The Dashboard can be used to access raw data and measurements from the uRADMonitor cloud, both in CSV/JSON format, but also via the RESTful API as direct HTTP Calls. If you own a uRADMonitor hardware unit, you can use the Dashboard to configure your unit. Finally, the dashboard is the place to set notifications and alarms to be informed when a particular unit reaches a given threshold eg. excessive PM2.5 in your area to avoid any outdoor walks, to protect your health.8.Open Layers 4.1.0
Not visible to the naked eye, but important from a programatic point of view and directly impacting performance, the new frontend was upgraded with the latest version of OpenLayers map library, for the data map representations.9.Animations
Not to leave aesthetics aside, certain animation effects where added to the frontend, to make navigation more appealing, like when opening a unit by direct ID access or by clicking a node on the map, the map will zoom and pan to bring the unit in the center.There is a forum section created to discuss the new features, propose new ideas or report any issues. See it here.
-
First IndieGogo funded unit went ONLINE
02/16/2016 at 13:04 • 0 comments![header_110000E0]()
There are now three uRADMonitor units running in Poland. The last one went online this month, and even if it’s technically similar to the other two by being a model A unit, it is special because it’s the first indieGogo funded unit to go online, part of the first batch of perks delivered.
![poland_110000E0]()
Thanks to the great people that supported this project. Here’s how the network takes shape right before our eyes, thanks to your trust in this work.
To access the unit readings and see the measured values of that area in Poland, click here. More units are currently in transit, and will go online soon, part of the campaigns scheduled calendar. -
Right on time
01/27/2016 at 10:55 • 0 commentsFollowing the successful indieGogo campaign, we are now ready to deliver the first perks to our backers, right on time, as promised, with the first batch of model A units. Thanks to the community supporting this amazing project!
![]() More details on https://www.indiegogo.com/projects/uradmonitor/x/7951265…
More details on https://www.indiegogo.com/projects/uradmonitor/x/7951265… -
Weather vs Radiation readings
08/04/2015 at 11:30 • 0 commentsThe correlation between weather factors and background radiation levels have been investigated in an experiment that took place in Australia.
David put together one uRADMonitor unit and a weather station, and aligned the output data using a python script.
![wind]()
As David explains:
"I’ve been running uRAD unit #12000003 here in Australia for around 12 months now and the only time I’ve really seen a solid increase in readings is during heavy rain which got me thinking, what other weather conditions affect radiation levels?"
![weather]()
See the tools he used and more details on Weather vs Radiation readings
-
uRADMonitor in Shenzhen, China
05/17/2015 at 13:08 • 0 comments![14_07_11_header]() Unit 1100007D went online in Shenzhen, China, showing slightly elevated radiation readings:
Unit 1100007D went online in Shenzhen, China, showing slightly elevated radiation readings:![1100007D_uradmonitor_china]()
This unit is located in an industrial electronics production centre. Its purpose is more connected to future uRADMonitor production than to environmental surveillance, so the readings might go offline from time to time.![1100007D_china]()
Other units in that part of the world, include the 1100008D in Taiwan, and the 11000080 in Japan, but unlike the 1100007D these last two show normal readings. -
uRADMonitor KIT1
03/08/2015 at 14:48 • 0 comments![uradmonitor-kit1-pcbtop]()
uRADMonitor KIT1 is the first open source DIY dosimeter KIT, that can be used to collect radiation measurements and push them to the uRADMonitor network. Similar to model B that is to be released later this year, the KIT1 is intended for those interested in building their own radiation devices and contribute to the uRADMonitor network.
The device was designed so that it an be easily reproduced by DIY enthusiasts. It features a single layer PCB and solely trough hole components.
![uradmonitor-diy-kit-06]()
The PCB file, and the firmware source code are available on the project's page: http://www.pocketmagic.net/diy-dosimeter-geiger-counter-kit/ . The code is hosted both on Google code and Github, all those interested are welcome to contribute.
-
200 uRADMonitor units deployed
03/01/2015 at 15:07 • 0 commentsAs you know, uRADMonitor was one of the HackADay.io 2014 semifinalists. The competition brought together a lot of excitement and constructive energy, but for some of the competing projects it went as quickly as it came, leaving only deserted project pages behind.
We would have chosen the space trip, like true hackers do, but uRADMonitor didn't win the competition. Yet it is still going, building on the exposure it got from this great event, and only a few months later, the global network of radiation detectors has reached an exciting number of 200 deployed, interconnected units, moving a DIY project to an unprecedented scale.
![uradmonitor_devices_feb_2015]()
The new locations are many and it would be a rather complicated task to name them all in a decent size blog post, but iterate just a few, the additions include:![uradmonitor-australia-new-zealand]()
![uradmonitor-italy]()
![uradmonitor-united-kingdom-isle-of-man-ireland]()
![uradmonitor-norway-sweden]()
![uradmonitor-moscow-russia]()
![uradmonitor-istanbul-turkey]()
![uradmonitor-france]()
![uradmonitor-estonia]()
![uradmonitor-british-virgin-islands]()
![uradmonitor-austria-czech-republic-hungary-slovakia]()
With this impressive increase in units reaching two hundred, the volume of global radiation data collected has gone up as well, getting closer to a total of 20 million entries.
![uradmonitor_total_data]()
The stats show a major presence of uRADMonitor units in the United States, followed by Australia, Germany, Canada and Great Britain. The column marked TMP represents mostly units currently in transit or waiting to be installed.
![uradmonitor_units_per_country]()
Join now to contribute to this community global radiation monitoring project and help the network expand even further! -
uRADMonitor + RESTful APIs + Encryption = v111
02/26/2015 at 22:24 • 0 commentsWith the uRADMonitor network covering more ground, constant effort is invested in making the project serve its purpose better. Code improvements come with extra features or better stability, and new firmware updates are released to anyone interested in upgrading their units.
Firmware 111 is the latest code released for the uRADMonitor model A units. We are excited to announce a set of changes that is the start of several improvements impacting both the hardware devices and the server infrastructure.
![restful_api_uradmonitor]()
- RESTful APIs. Easy to understand, maintain and extend, this will handle all data interfacing. This is also a first step in supporting custom DIY detector units that wish to join the uRADMonitor network, in an effort of expanding Global coverage even faster.
- in compliance with the new API, we'll use HTTP POST requests for all unit data uploads, while we reserve HTTP GET transactions mostly for data access part of the new API. New Standards are getting in place.
- Encryption and integrity control. In early versions all resources were invested in getting the job done, and ignored the possibility of cybernetic attacks. Since this is not a perfect world in regards to people with bad intentions, and to protect the integrity of the data we deliver – firmware v111 is the first to integrate advanced encryption techniques, to make sure the data sent from the uRADMonitor units arrives unaltered to the servers.
- embedded code improvements to speed, memory size and stability, as well as some bug fixes related to JSON formatting and temperature readings.
More details here: http://www.uradmonitor.com/new-firmware-v111/
-
The Compensation Capacitor
02/18/2015 at 21:49 • 0 commentsNormally, the Geiger tube delivers a sharp short pulse, with an abrupt descending path, as the quenching gas very quickly neutralises the conductive ions, and so terminating the current flow. The uRADMonitor pulses appear with a slightly rounded tip because an extra capacitor is added in the circuit, named the "compensation capacitor". All uRADMonitor model A units have this capacitor:
![compensation_capacitor]()
Here is the original pulse, as recorded on an uRADMonitor model A unit, with the compensation capacitor removed (left picture) and a similar pulse, with the capacitor in place (right picture):![geiger_oscilloscope_compensation_capacitor]()
The first pulse has an amplitude of 8.48V correctly verifying the resistive voltage formula presented previously, while the second image shows a dampened pulse with a rounded tip and a decreased amplitude that is little over 5V, as an effect of the extra capacitance. Note the voltage divs are different in the two images.The role of this compensation capacitor has been further explained here: http://www.uradmonitor.com/compensation-capacitor/
-
Checking the Geiger tube
02/18/2015 at 00:16 • 0 comments![uradmonitor_oscilloscope_geiger_pulse]()
The Geiger tubes used in uRADMonitor model A units are mostly the SBM-20 or the SI-29BG, both of Russian provenience, manufactured at military grade specs. Therefore they were meant to resist fluctuations over a wide interval of temperature or pressure. If a tube failure is suspected for a particular uRADMonitor unit, for example when the number of counts per minute reported shows zero, checking the Geiger tube might be necessary, and the following indicators should be verified:
Voltage on tubeAssuming the uRADMonitor unit is otherwise functional, it should first be connected to the LAN Network to get a valid IP, so that it can be accessed locally by opening the IP in the web browser:
Geiger tube pulses![uradmonitor_web]()
The voltage on tube is displayed in the web interface, together with several other parameters. The voltage on tube should read 380V +- 5V. The duty cycle must be between 25% and 45%.
This method of checking the tube voltage is preferred over directly measuring high voltage inverter output for a several reasons:
– it is safe: no electric shocks can accidentally occur by touching the high voltage sections of the circuit
– a high impedance voltmeter would otherwise be needed to directly measure the voltage on the board. A 10M impedance voltmeter (or higher) would be needed to measure the voltage directly, to avoid the voltage drop and so erroneous readings to a maximum extent. The high voltage inverter is a low current high voltage supply.
If both the "radiation" and the "average" fields show zero while the "voltage" is correctly measured close to 380V, it could indicate a tube failure. For certainty in this case, direct tube verification is needed, and the following approaches should be used:The purpose of the Geiger tube is to count radiation induced pulses. When the tube internal environment is ionised by intersecting radiation, it becomes conductive for a very short amount of time. The anode (for example 10M) and cathode (for example 220K) resistors form a resistive divider. If the signal is collected from the cathode, then the maximum pulse amplitude for 380V across the entire assembly will be Vout = 8V according to the following calculations:
![voltage_divider]()
To test the tube is functioning properly, we need to check it is able to count radiation pulses. In the absence of an active radiation source, the background radiation can be used as a source, which for the SBM-20 should be about 20CPM (counts per minute), depending on the particular region. So a first test would be to see if the tube registers any pulses, and to count them to see if we get the expected number, that is approximatively 20 pulses in a minute. Due to the random nature of radiation, we will get more or less, but repeated tests should slowly tend to reach this value. On the other hand absolutely no pulses at all, would clearly be an indication of tube failure.The following tube tests can be used: http://www.uradmonitor.com/checking-the-geiger-tube/
Global radiation monitoring network
The uRADMonitor is a plug-and-play, low power, self contained radiation monitoring device, connected to a centralised server component.


 Unit 1100007D went online in


