 Daniel James Evans
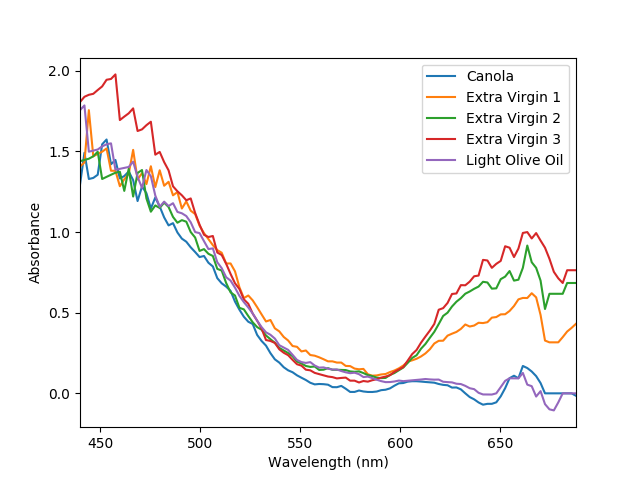
I collected spectra from 3 brands of extra virgin olive oil. I also collected spectra from light olive oil and canola oil.
The right side of the spectrum shows a clear difference between the extra virgin samples and the other samples. I'm worried that the left side of the graph is inaccurate. I'm not convinced that canola oil should have that much absorbance at low wavelengths.
Despite the possible issue on the left edge, I consider the test to be mostly successful. The device shows a clear difference between extra virgin olive oil and other oils, demonstrating its usefulness for food inspection.
Discussions
Become a Hackaday.io Member
Create an account to leave a comment. Already have an account? Log In.