Craig
Craig-
Slow progress
03/10/2017 at 22:56 • 0 commentsFollowing up from our pear experiment
Well unfortunately I was not able to get much of a signal out of measuring a pear. That's a shame because it's one of the fruits we try to harvest in large amounts.
![]()
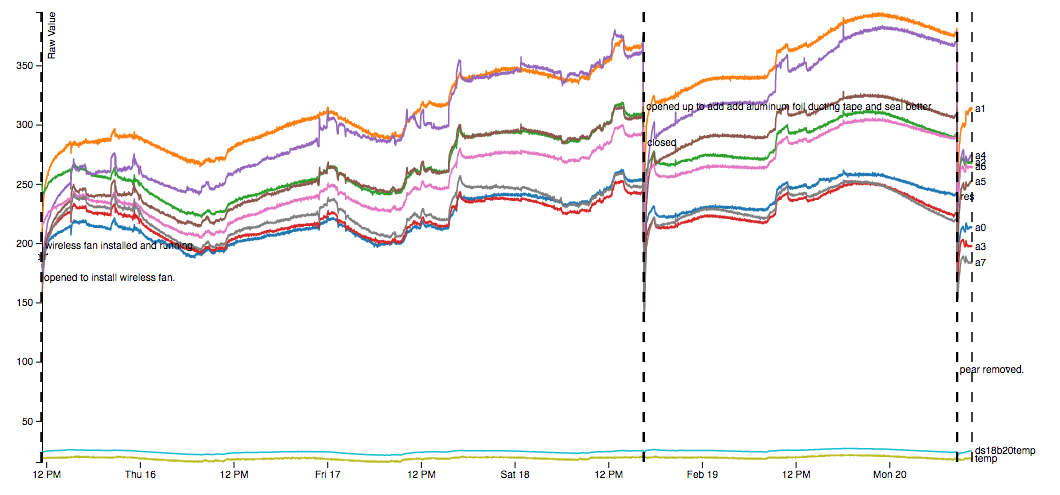
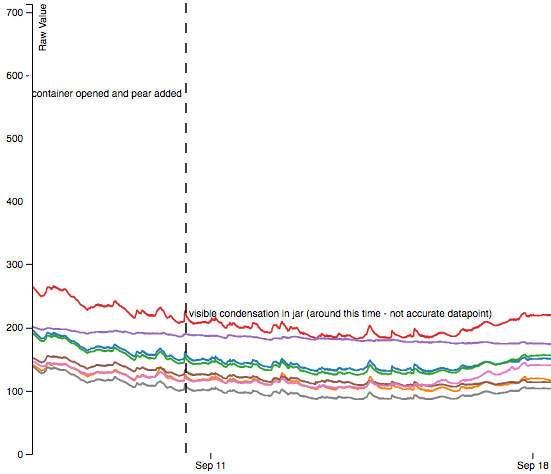
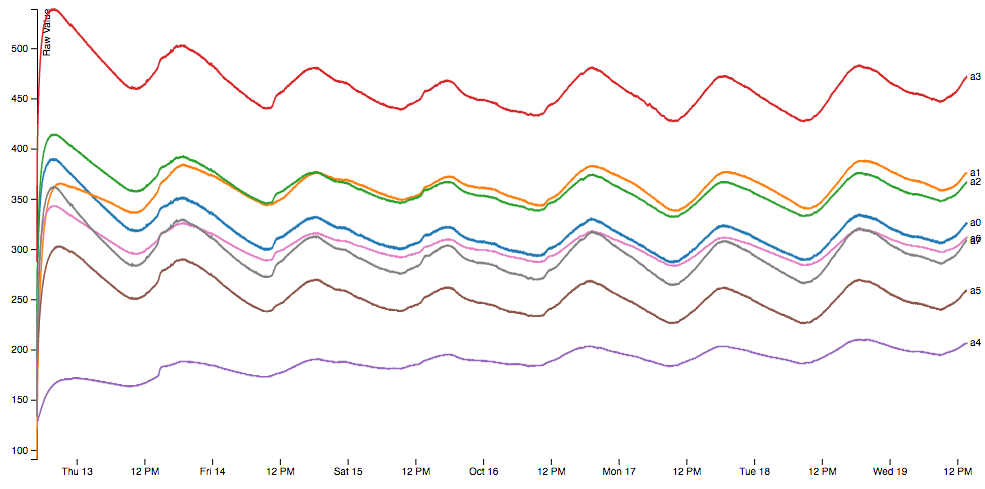
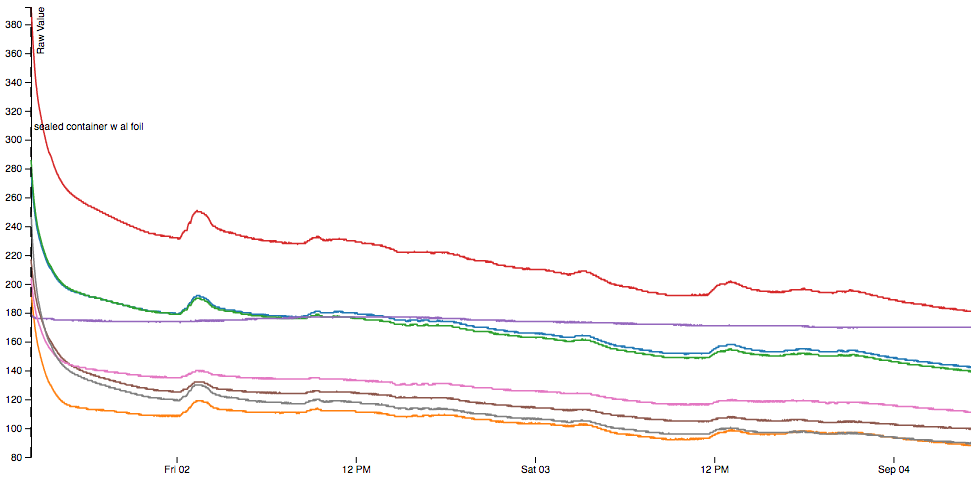
Once I had the chamber somewhat better sealed, this is the best data I was able to get... about 5 days worth. Unfortunately, there's not much of a clear signal here. Stuff is increasing, but it's also got a lot of wander to it and would be hard to determine a GO/NO-GO threshold from this.
There were still sealing issues: a lot of those large spikes appeared when I sat down at my computer next to the sample chamber and this was super frustrating cause I thought I sealed it really damn well.
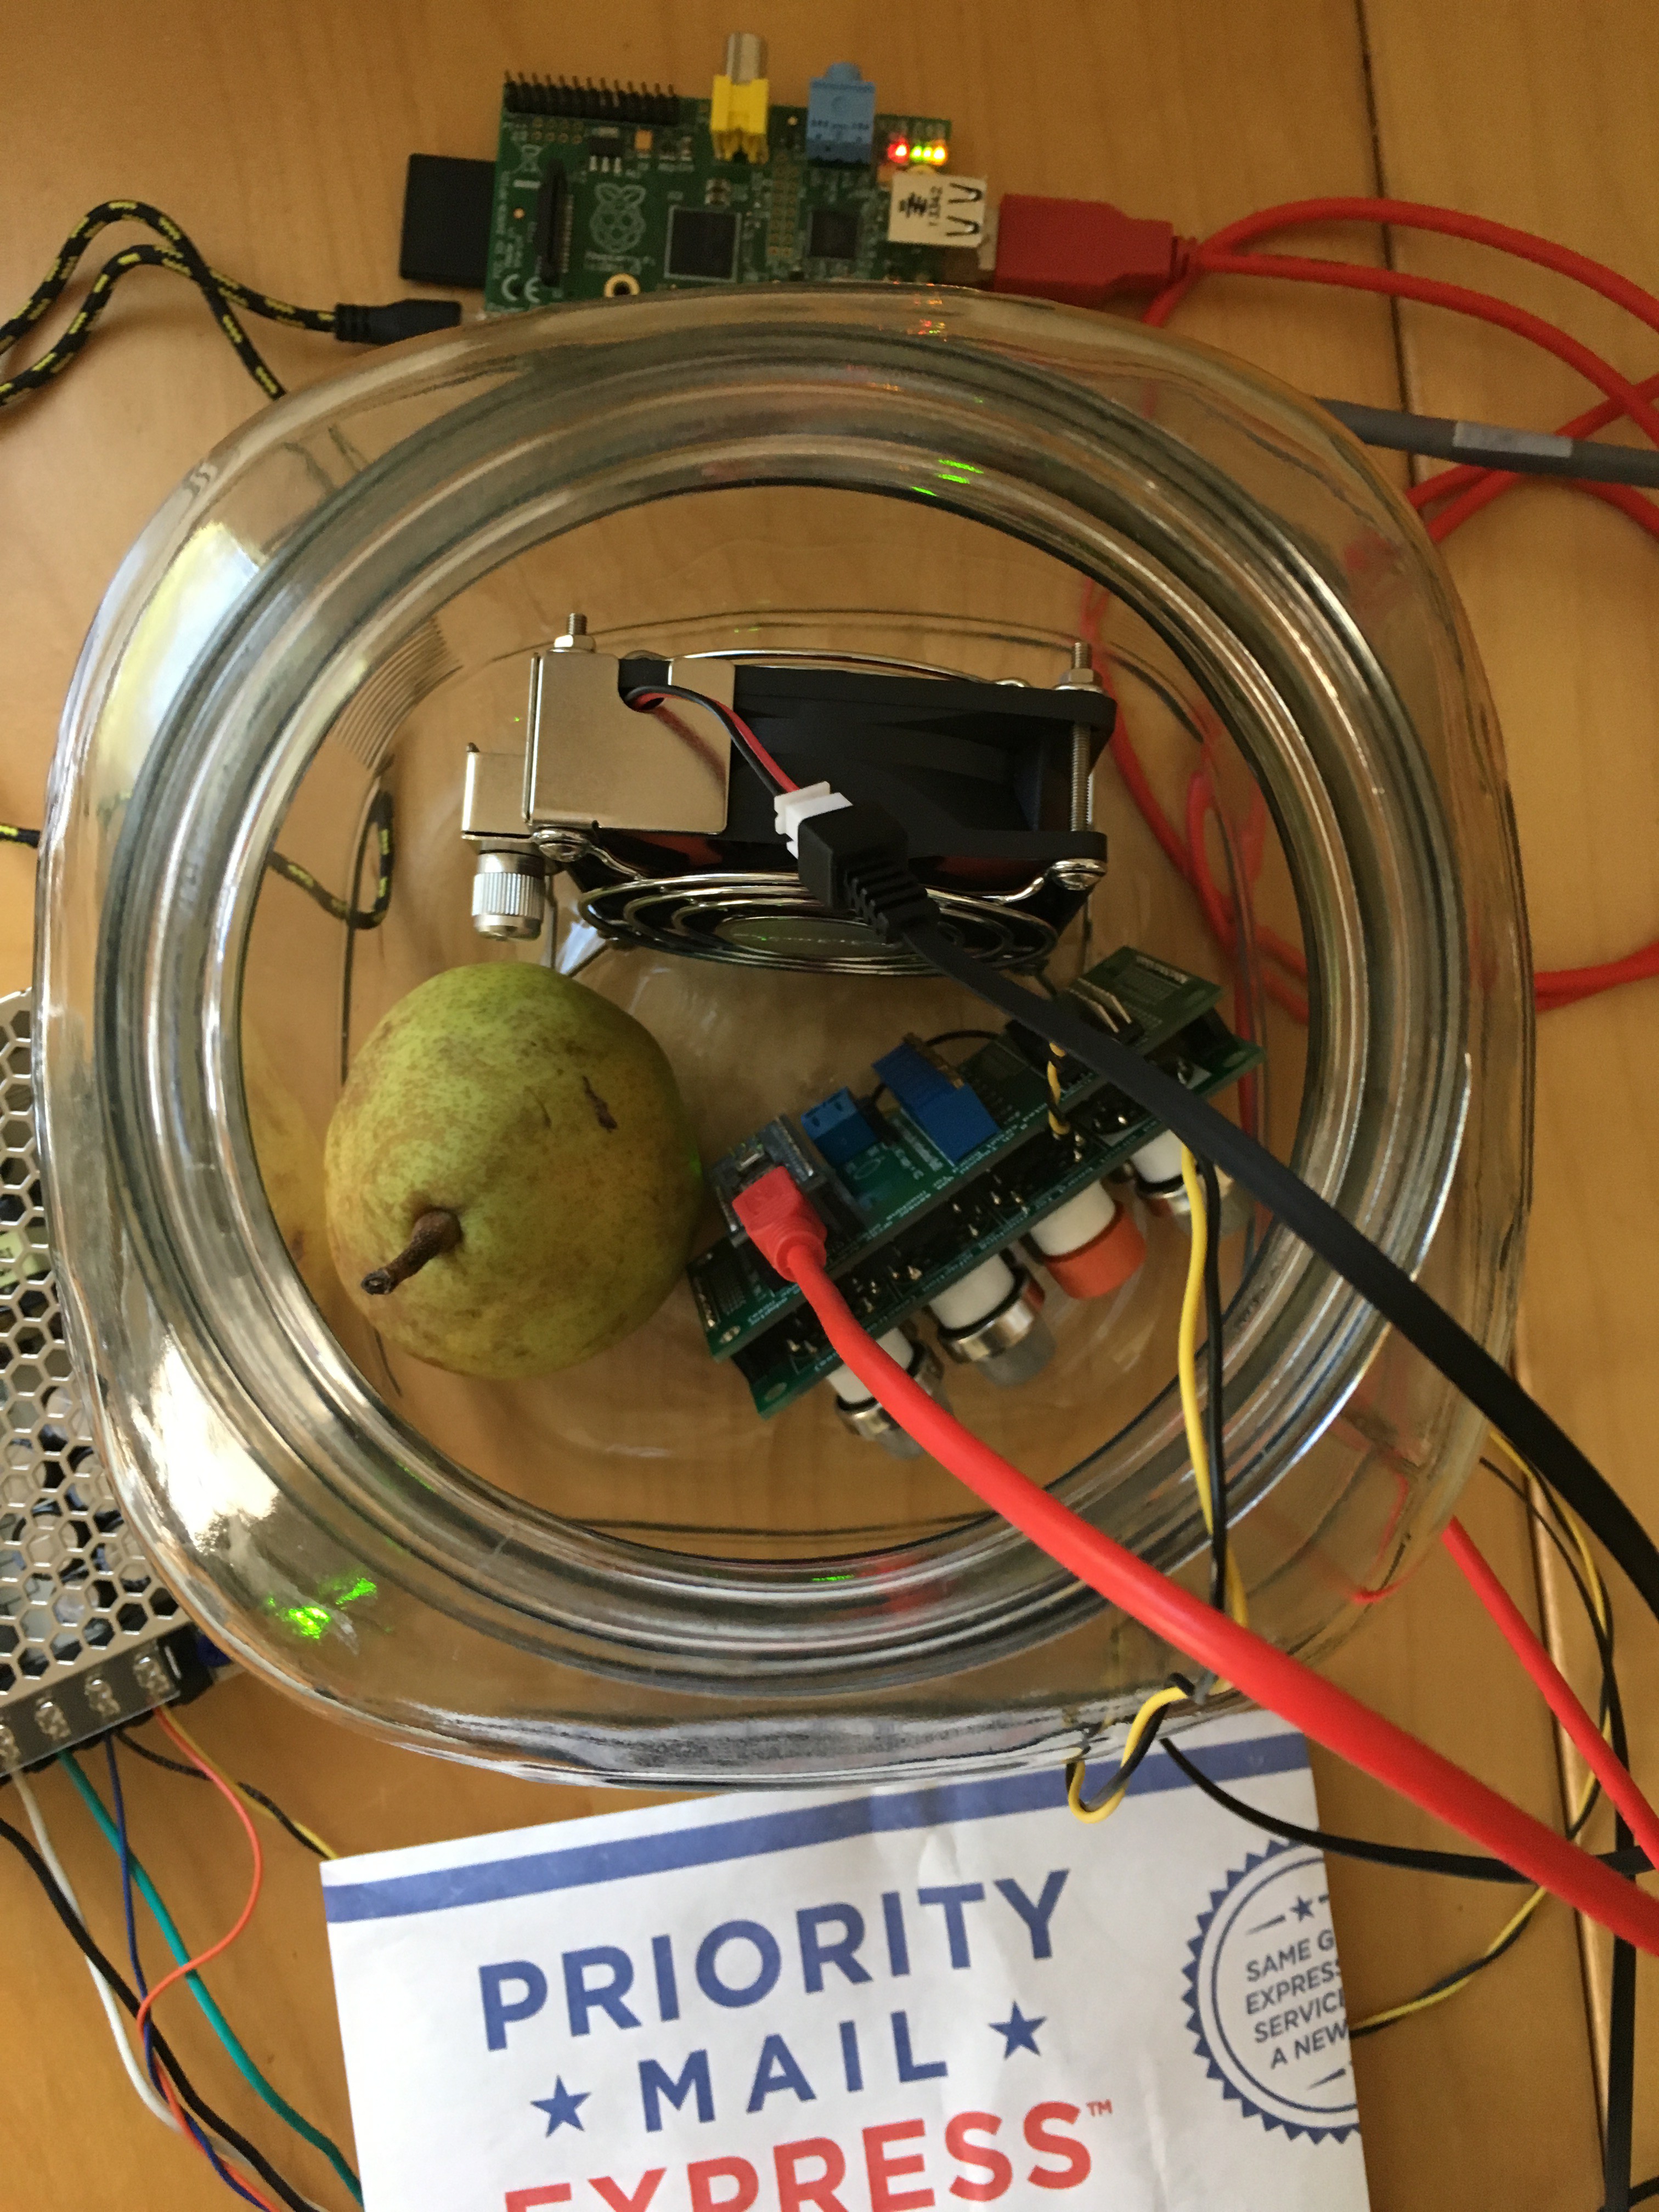
![]()
![]()
Two holes, both with o-rings. All the existing holes were covered with the nice aluminum-foil sealing tape that conforms really well. I don't know what else I have to do here... I can sit down and watch the signals slowly start to climb. Very frustrating.
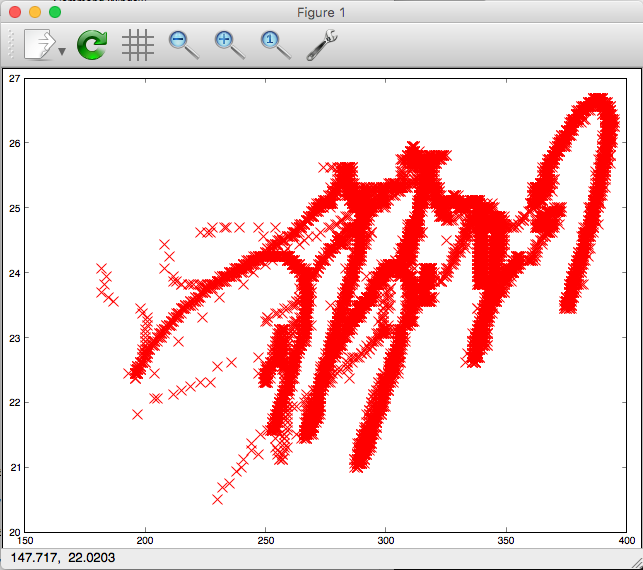
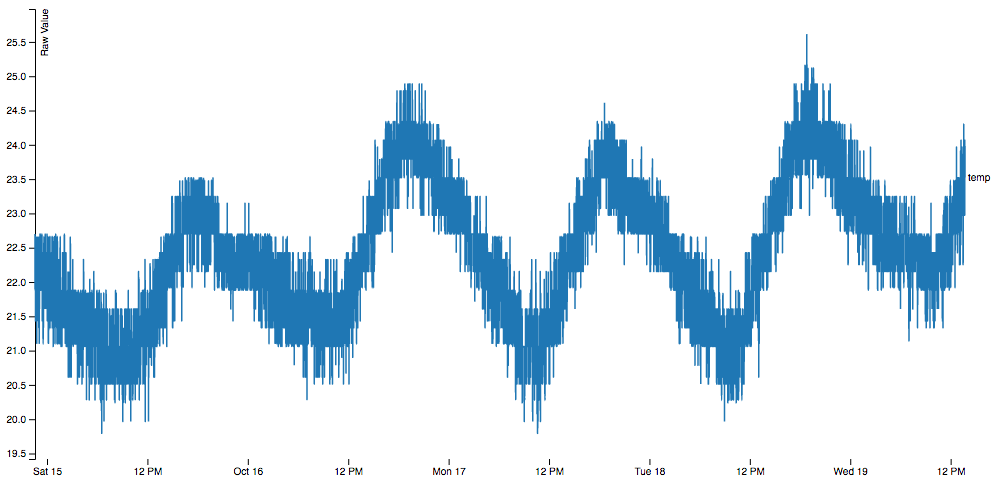
Of the data I got, if we take our strongest signal (A1 -- MQ3 alcohol sensor) and plot it in relation to temperature, we can see a pretty strong relationship:
![]()
You can see that there are several periods where the data decrease in a linear fashion and then increase in an almost identical fashion. It's sort of like someone is writing the letter 'm' over and over.
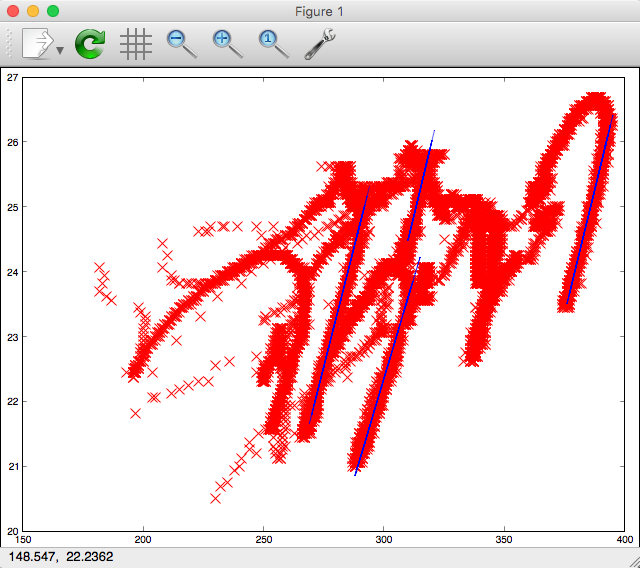
Furthermore, these linear relationships all have about the same slope, and I'm saying that's our temperature compensation coefficient:
![]()
These lines all have a slope between 0.125-0.154. The value I ended up using was 0.1313, but it probably doesn't matter that much.
I'm really trying not to imagine things in the data here. I'm restricting myself to the areas where the sensors decrease and increase along the same linear path because those don't make physical sense with sensing a gas emitted by a fruit but they do make physical sense when considering an oscillating temperature relationship.
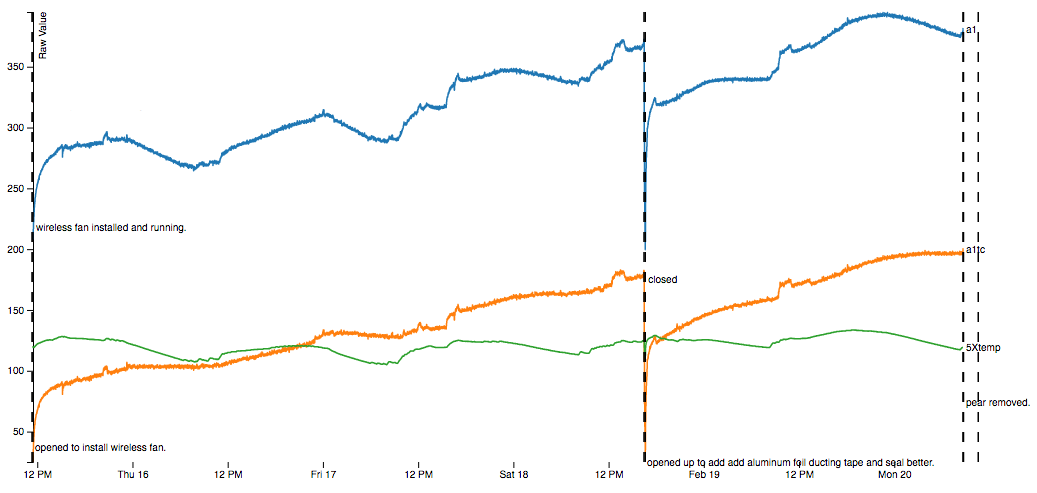
Taking our 0.131-ish slope and compensating, we get:
This graph has the original data (blue), the measured temperature (green, and multiplied by 5 to increase its contrast on the graph scale), and the corrected data (orange). Overall it did a decent job of taking a wobbly signal and making it pretty straight. We do have a signal hidden in there, but it's just not very strong.![]()
One other thing to note: when I ended this experiment, I took the pear out and tried eating it. It was TOTALLY GROSS. It had absorbed whatever rubber chemicals had volatilized from my big 10-conductor cable and just tasted like sweet weird rubber. It was super disgusting and I couldn't take more than 2 bites and I regret swallowing them. So there's something to be said for a new setup entirely that doesn't use that cable.
Next steps
A bit dejected after this one honestly. My thoughts at this point are to get as much wireless as I can so I can completely self-contain the electronics. Benefits of this:
- No holes need to be cut in the container so we can certain that we're sealing really well
- Can get rid of smelly cables
- Can switch to digital potentiometers for sensor calibration, leading to much more repeatability
Disadavantages:
- Have to make a new circuit board with those potentiometers and mounting for some kind of wifi-enabled microprocessor (ESP32 for instance)
- Have to figure out how to program the ESP32 and deal with level shifting 5V sensor outputs to 3.3V analog inputs and deal with its immature toolchain in general.
- Have to figure out how to supply ~1.5A wirelessly. I really don't have enough EE knowledge to be able to do this yet. Qi chargers/general inductive charges seem to top out in the 500-1000mA area. I guess I could get 3 and put them in parallel?
-
Sealing up the chamber even more...
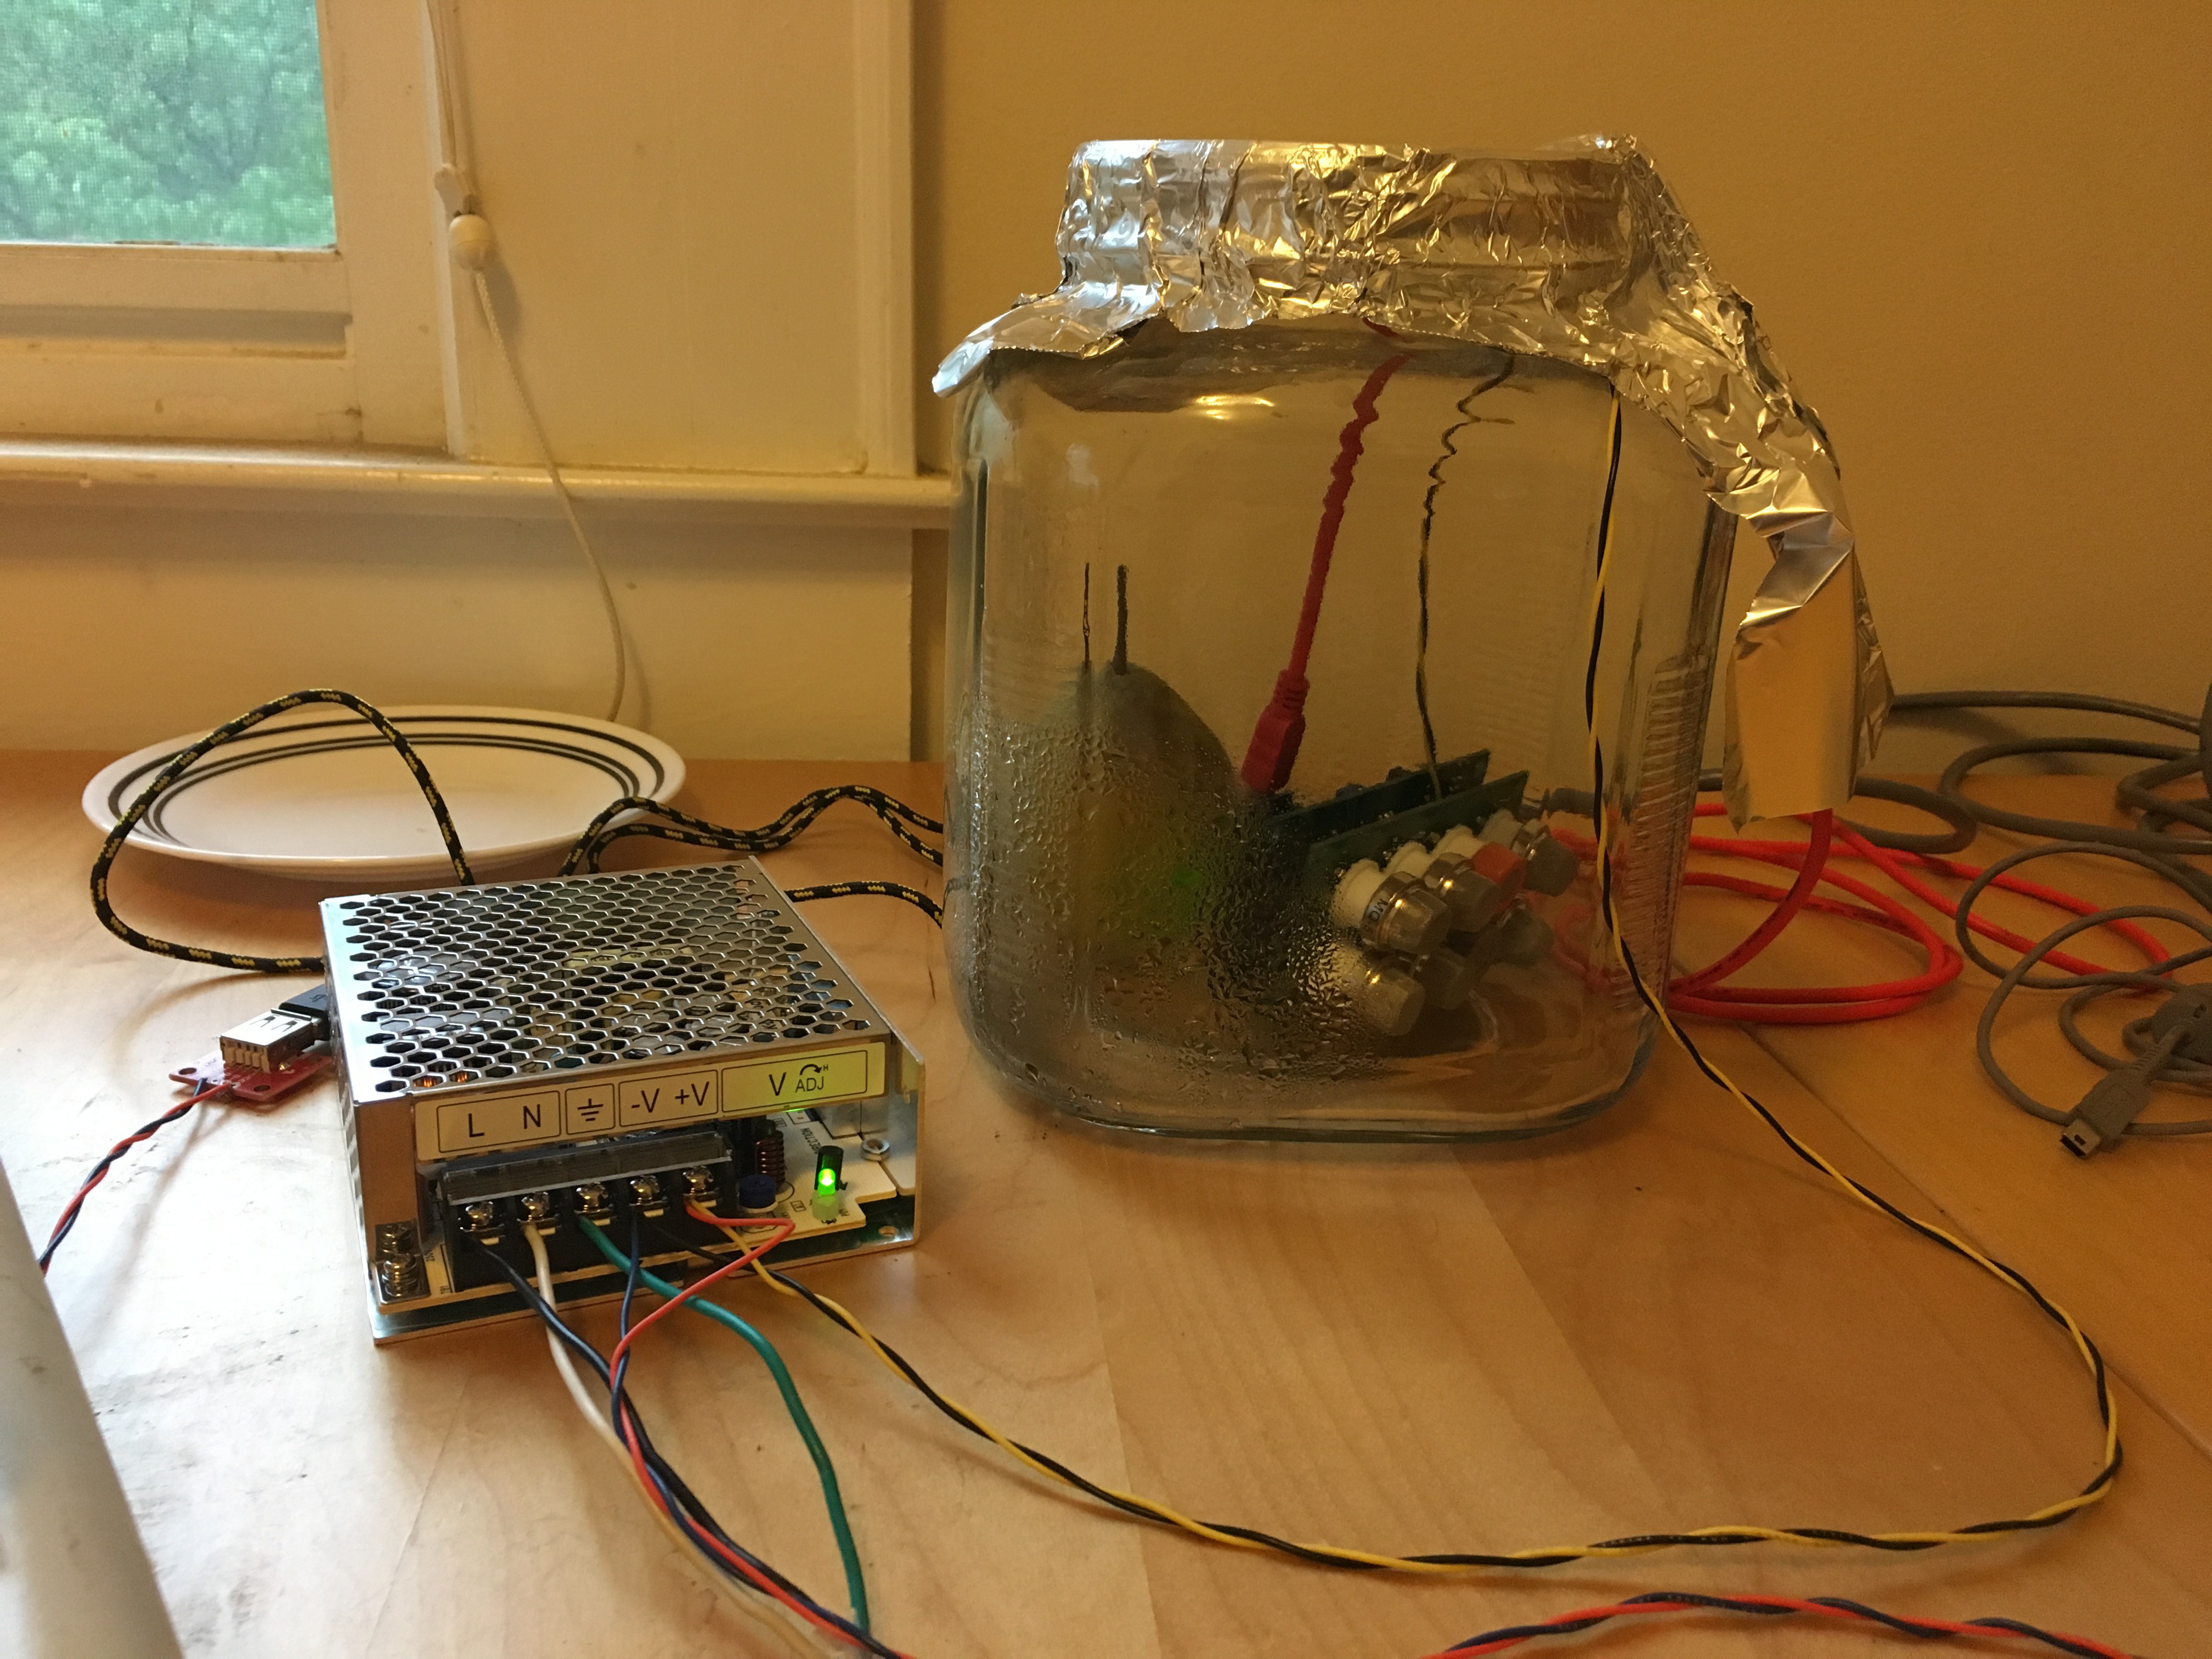
02/17/2017 at 17:10 • 0 comments![]()
Smelling a pear. This will be running for a week+ probably since pears are sold so under-ripe.
These gas sensors are just crazy sensitive to any airflows! With the previous setup, I would notice sensor values slowly begin to take off whenever I sat down at my computer next to the chamber and stay there.
Since these sensors are measuring the gas by depleting it, those elevated sensor readings meant some external gas was continuously entering the chamber somehow.
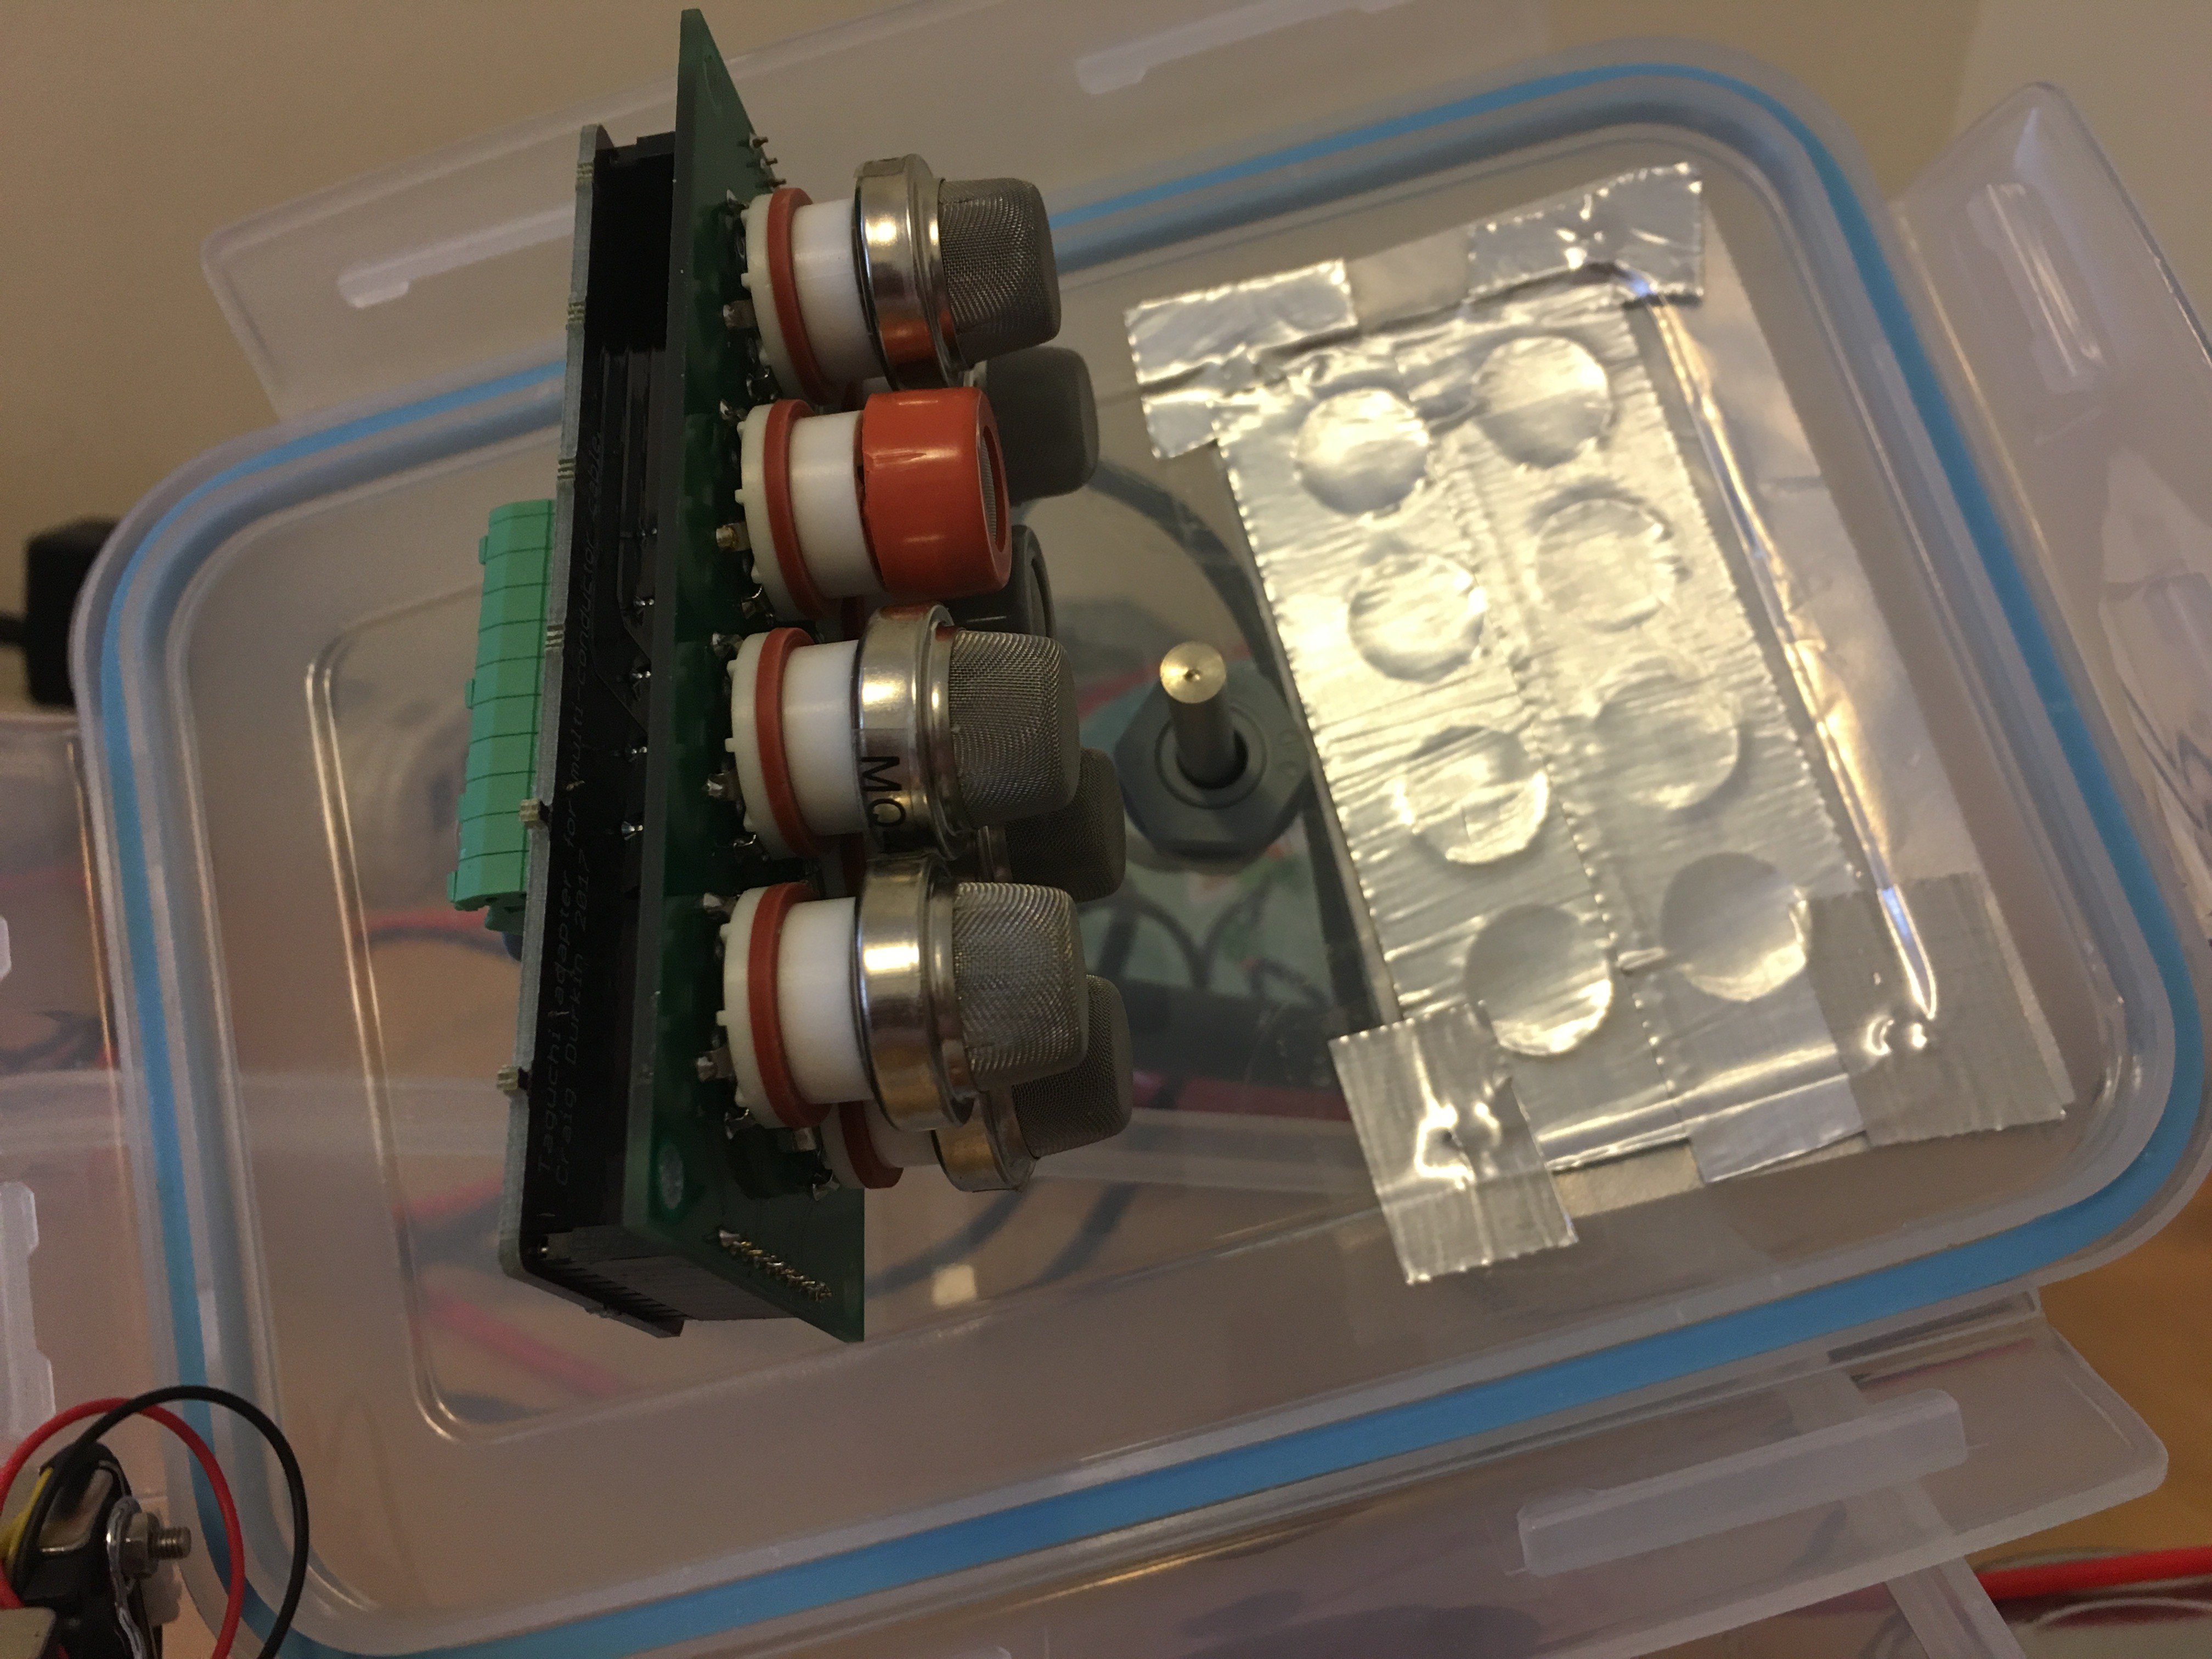
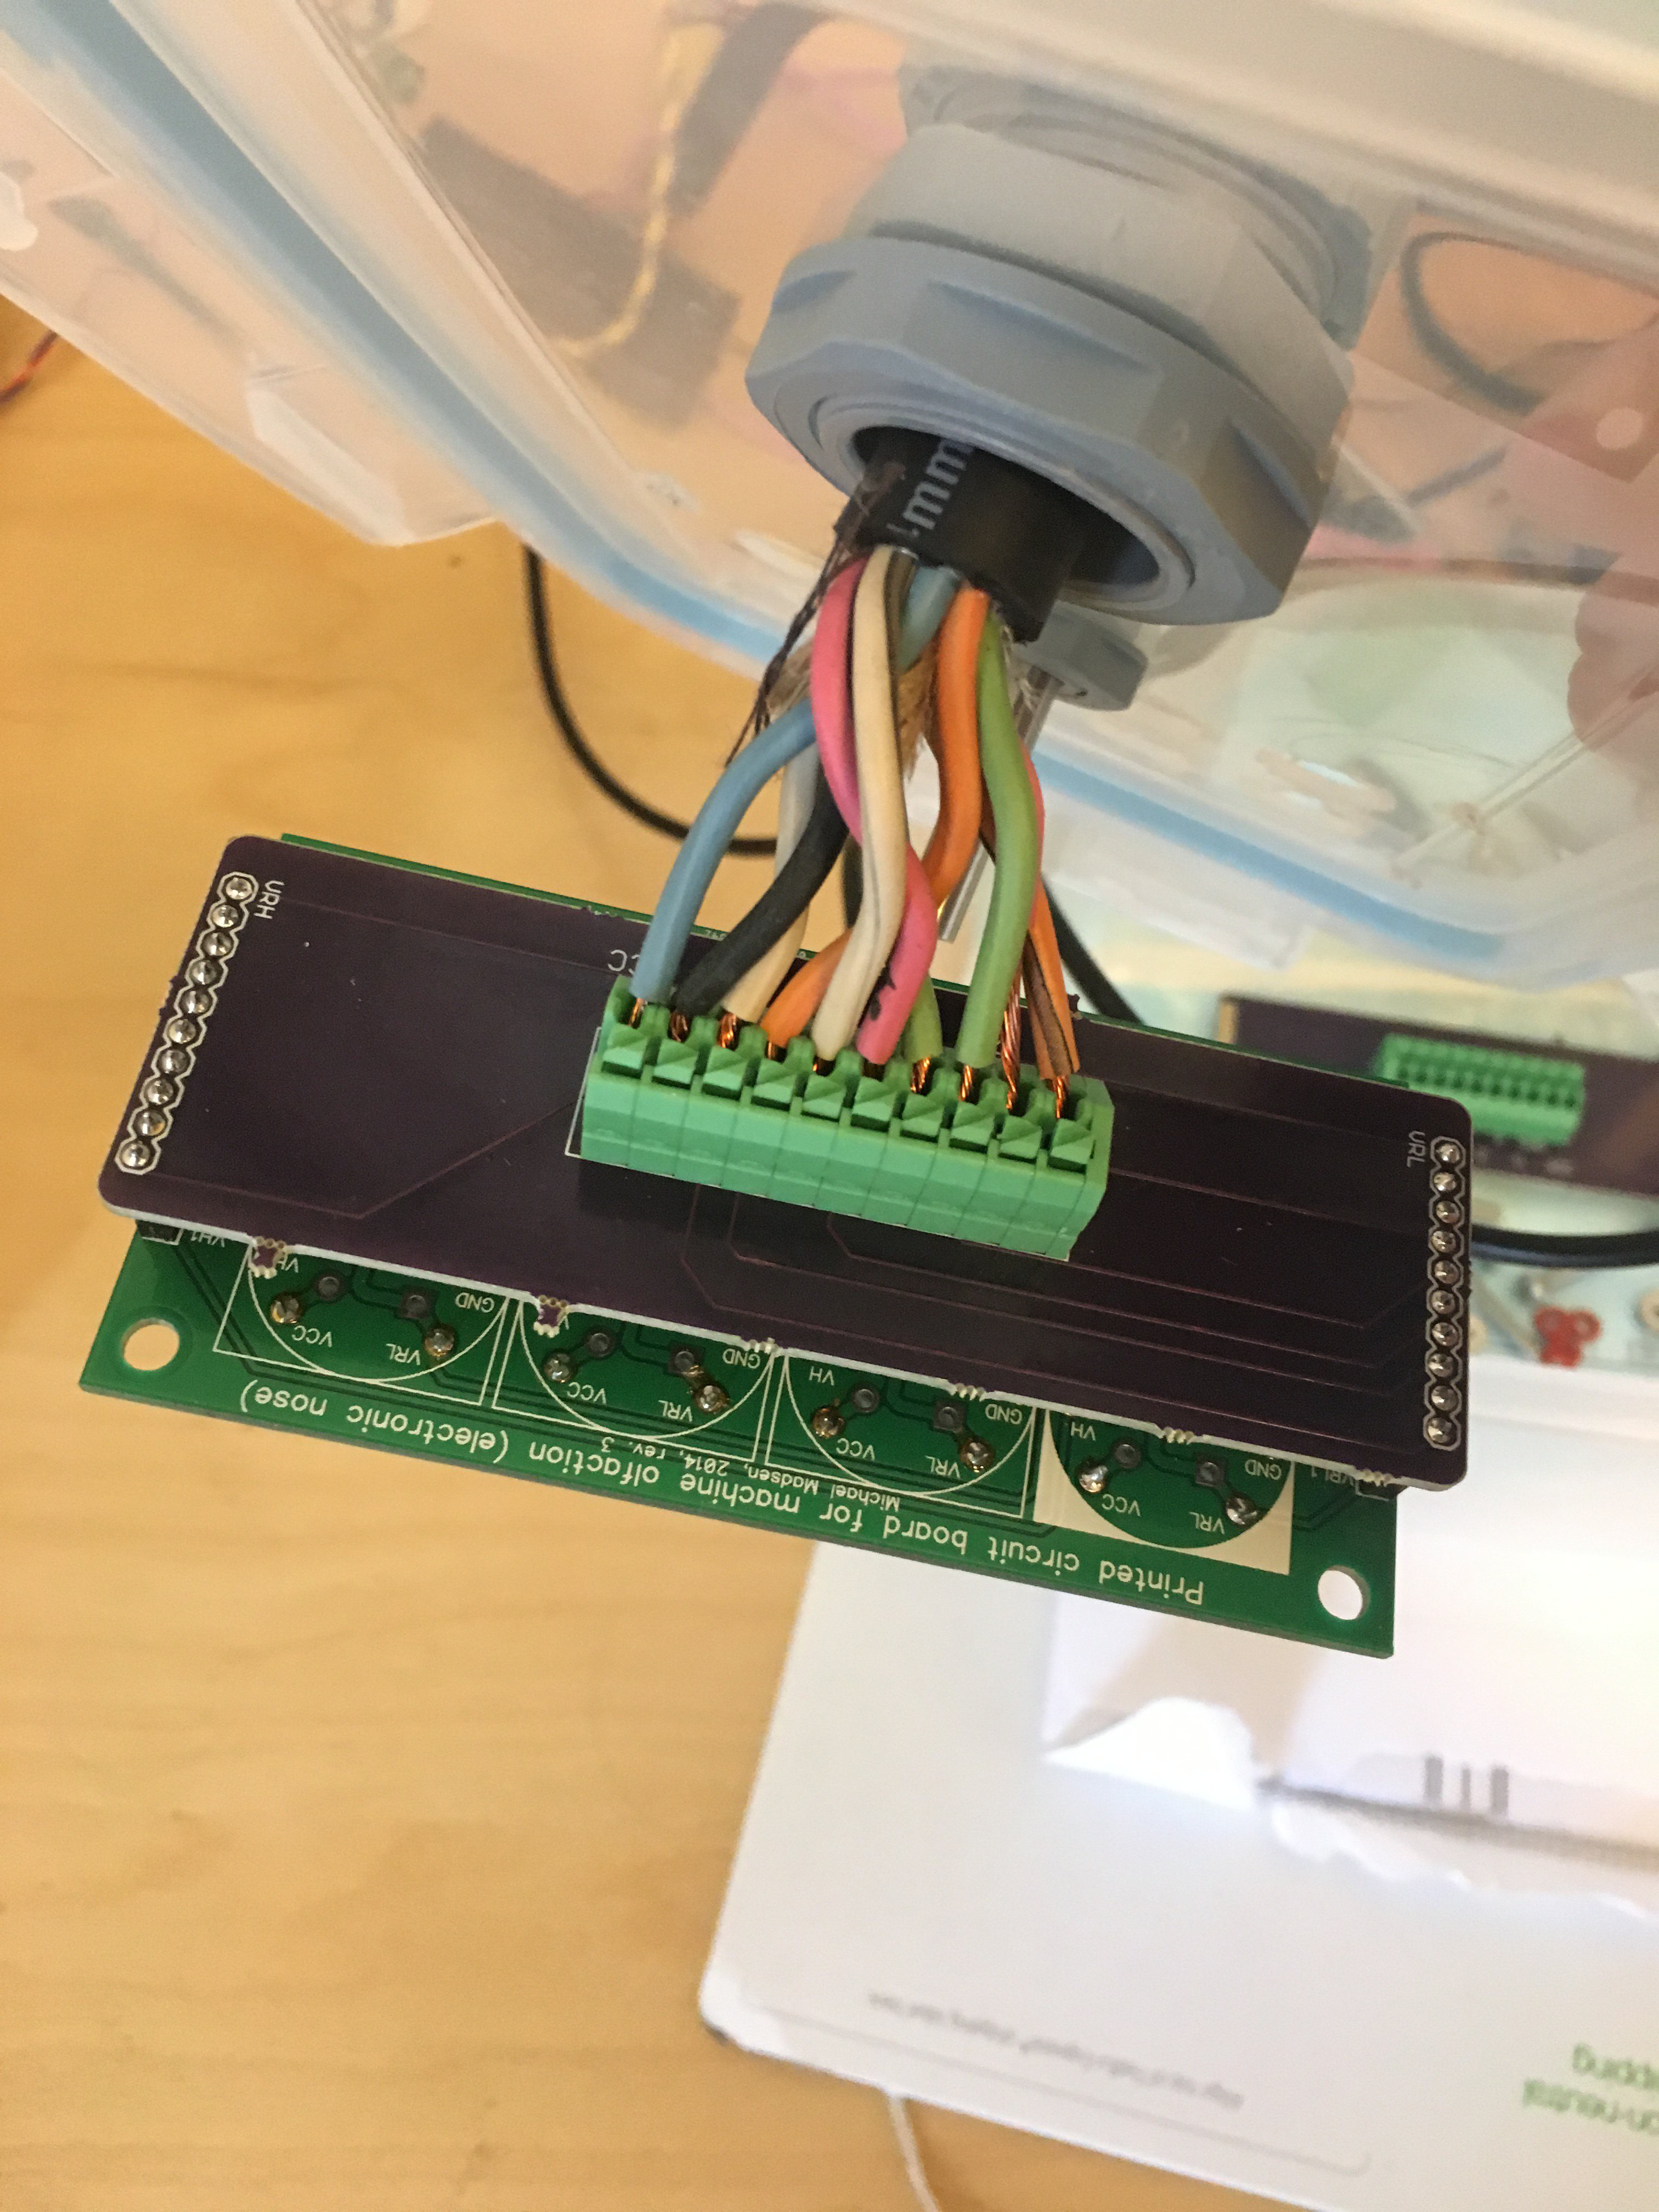
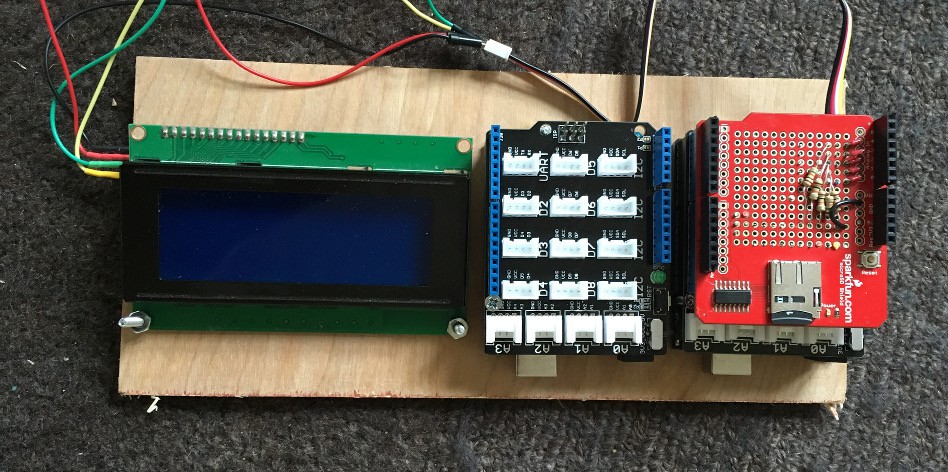
So my goal now is to eliminate as many holes as possible in to the chamber. I got an Adafruit inductive charger kit so that I can wirelessly power the fan inside of the chamber, and I also whipped up a small adapter PCB to route all of the sensor connections in to one cable. This way instead of having to cut 8 holes in to the chamber lid for the sensors, I can instead cut one hole and mount an o-ring sealed cord-grip in it:
![]()
This particular cable is definitely overkill for this situation, but it was the only one I could find that I could buy by the foot instead of by the spool. McMaster FTW (as usual).
-
New setup is coming along...
01/19/2017 at 19:57 • 0 commentsStill working on some issues, but things are getting better:
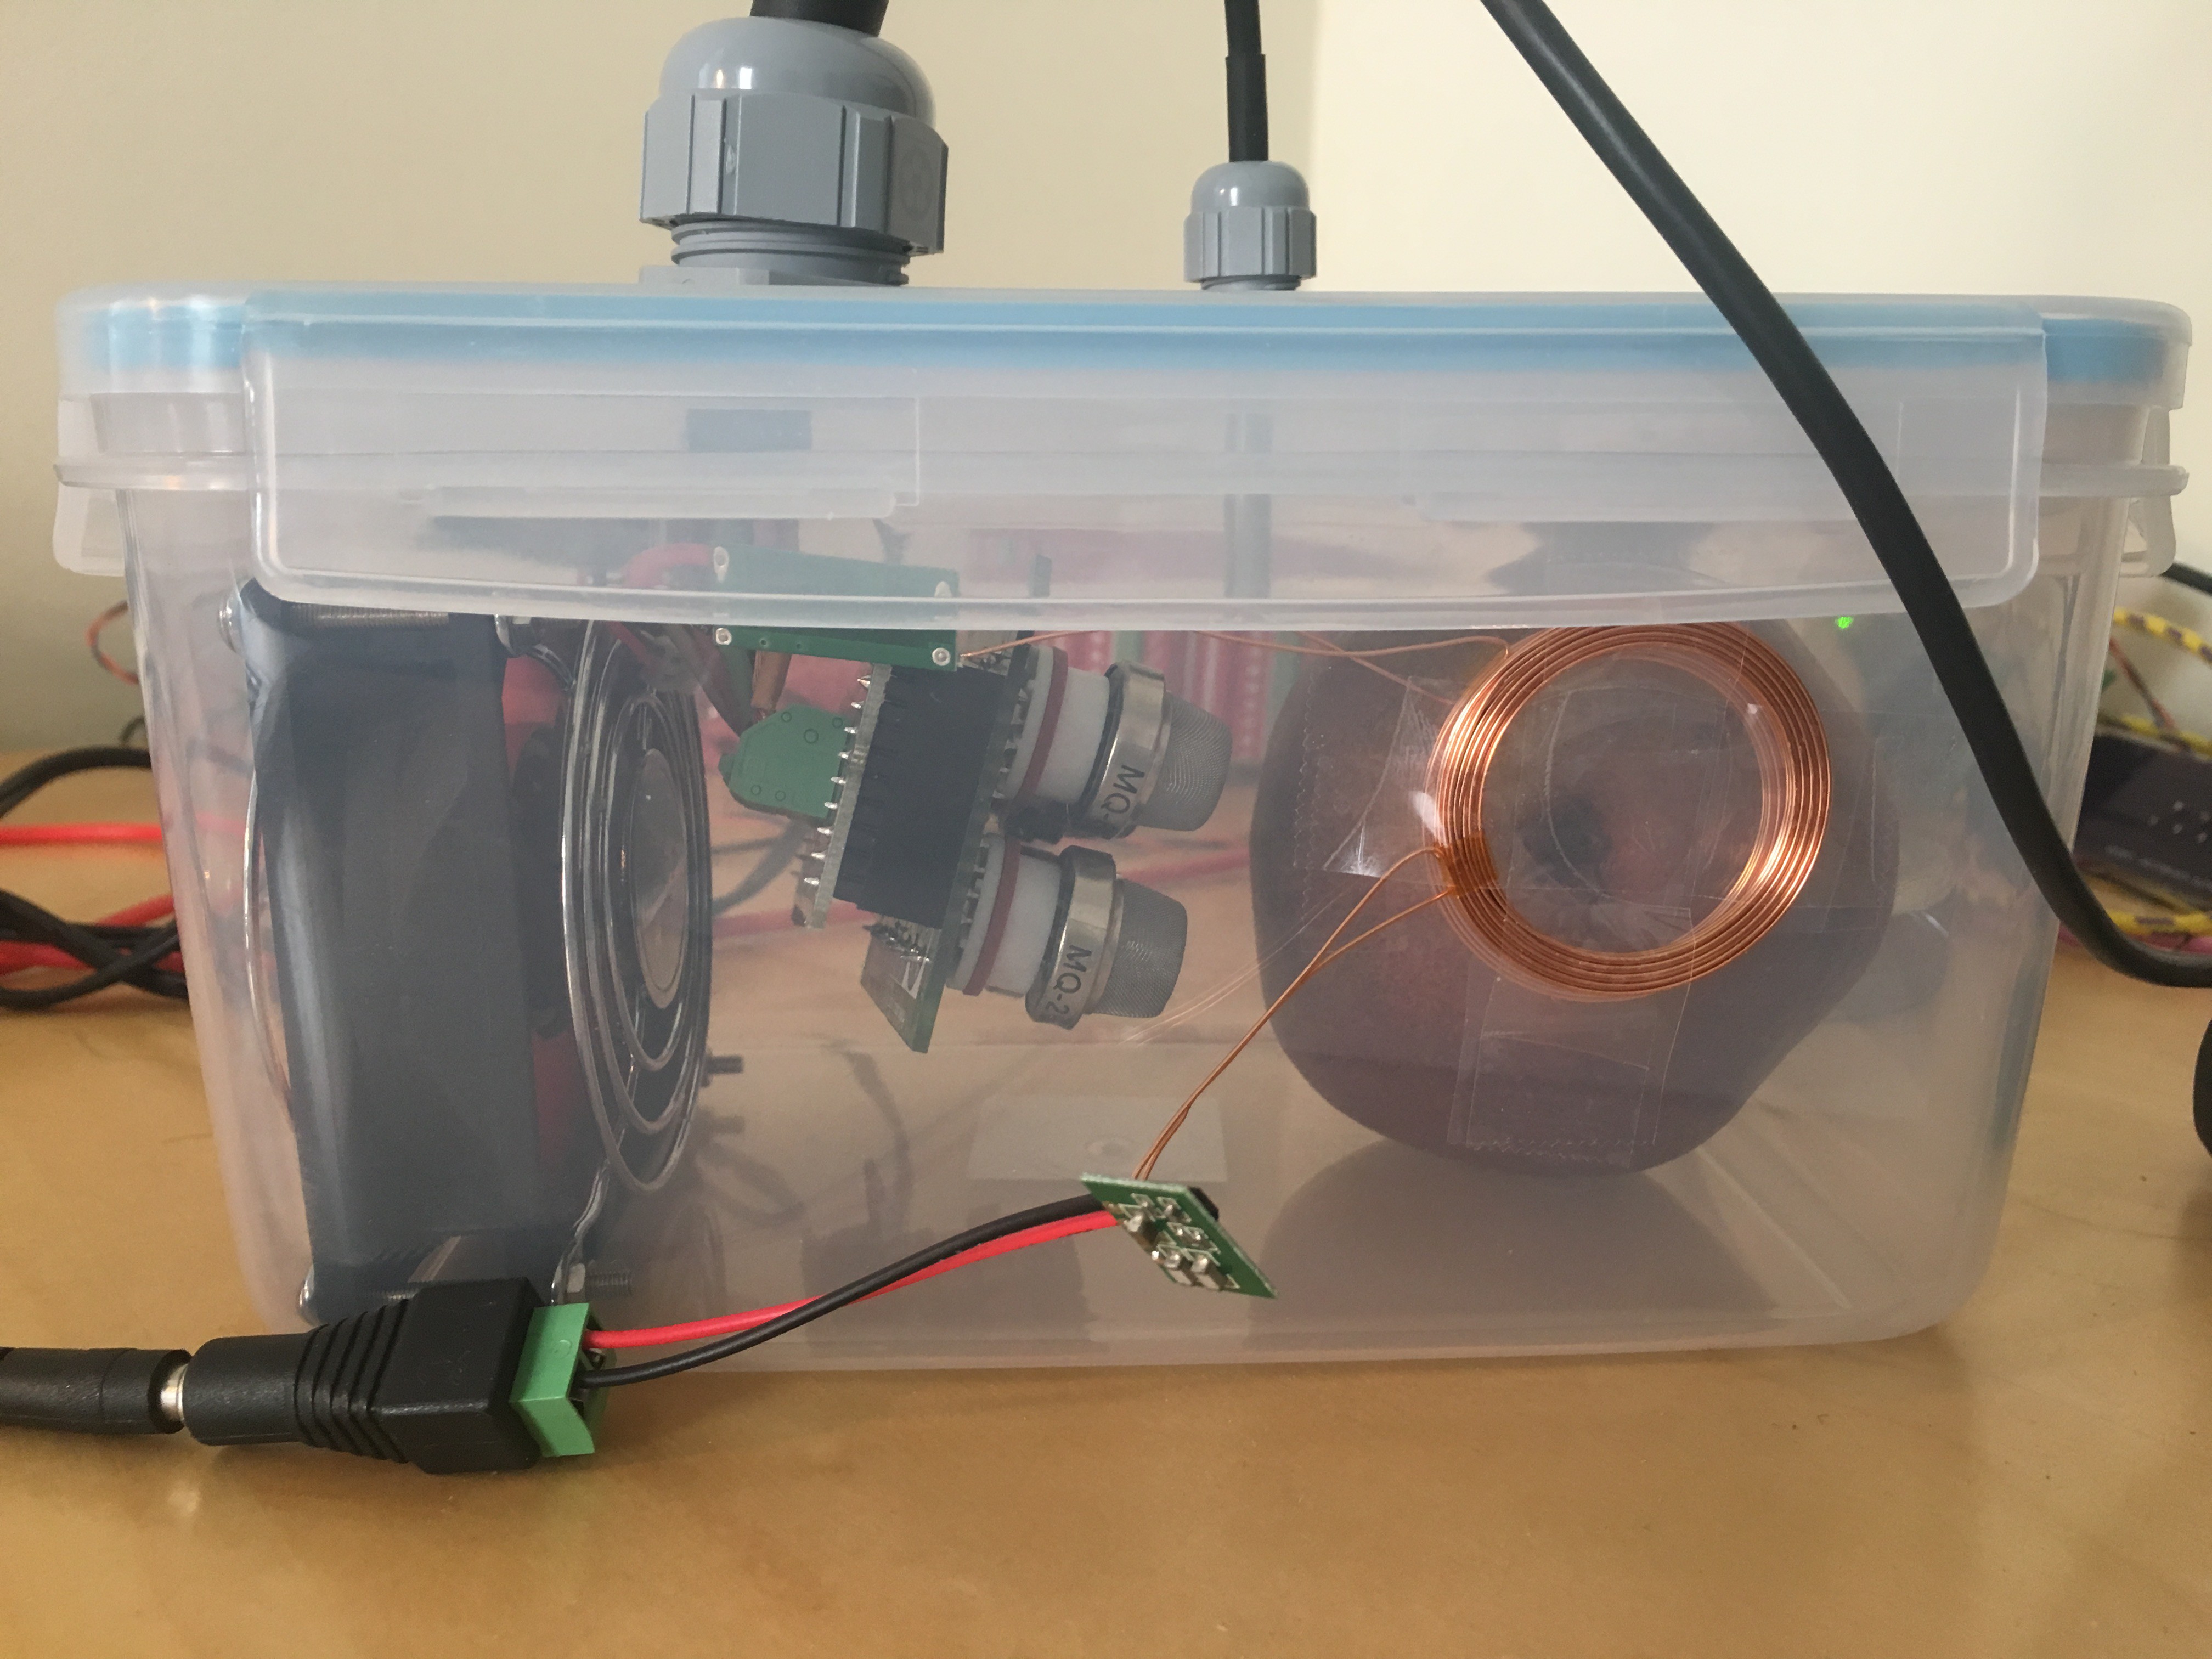
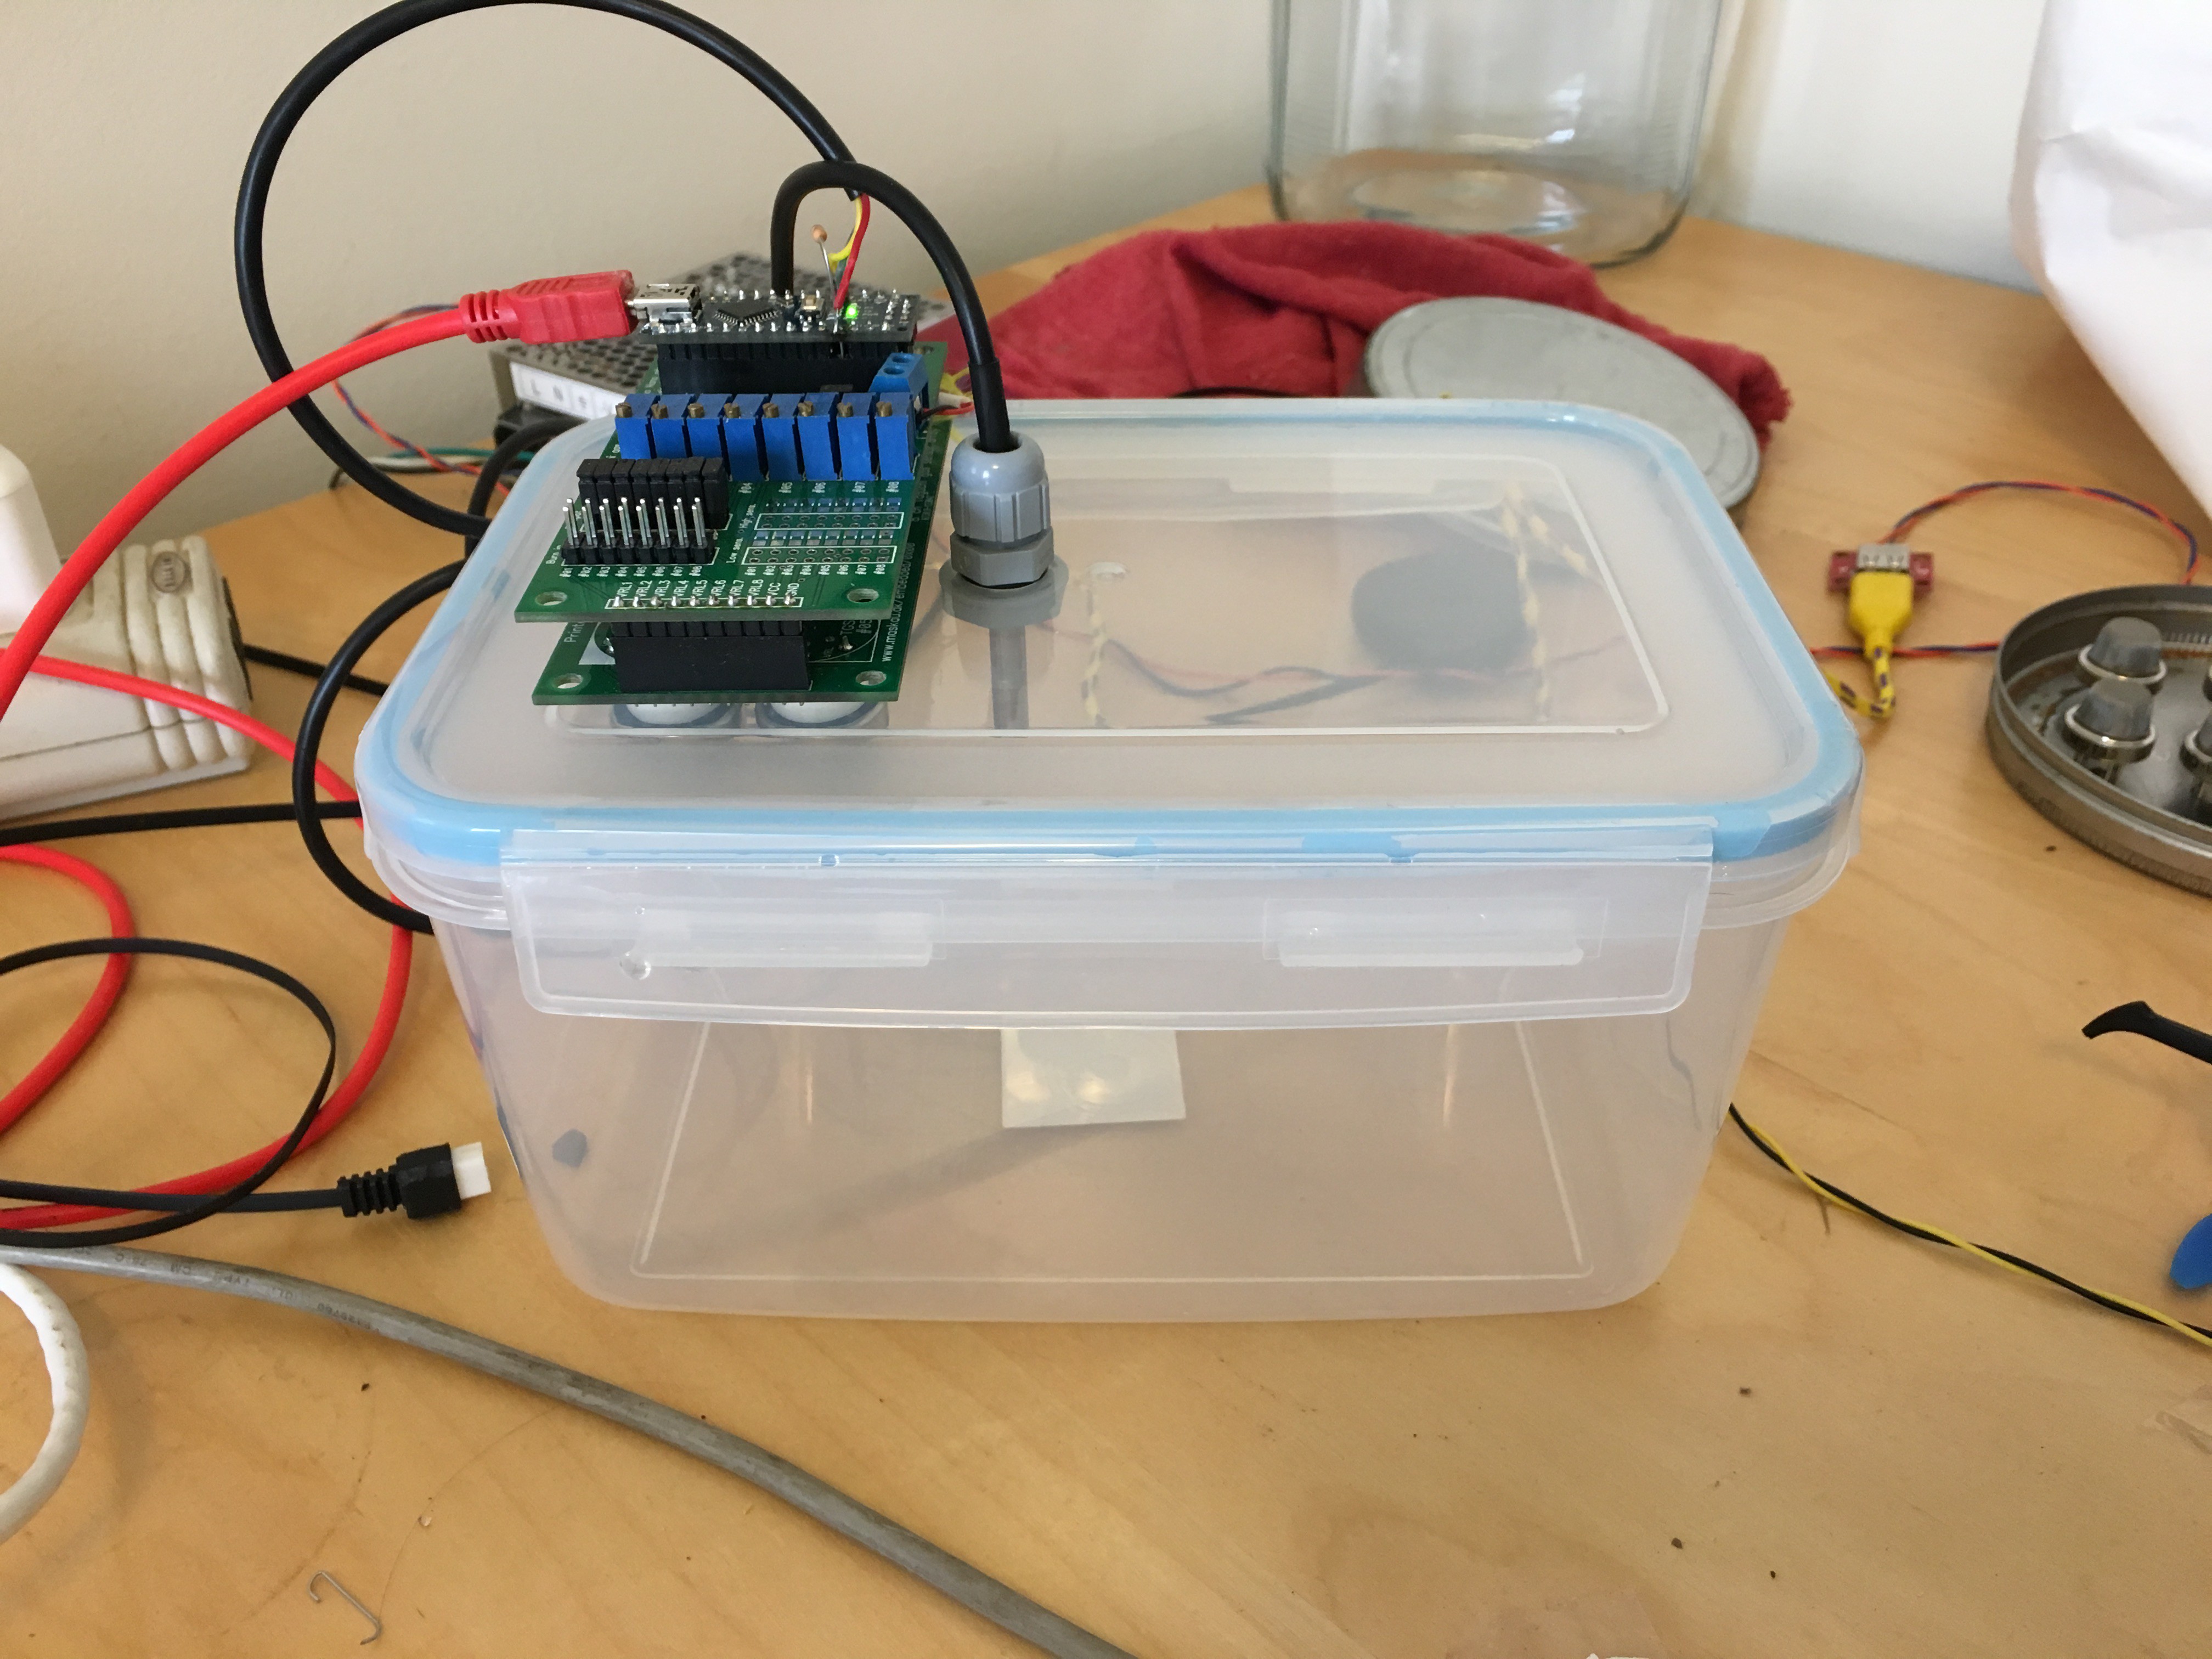
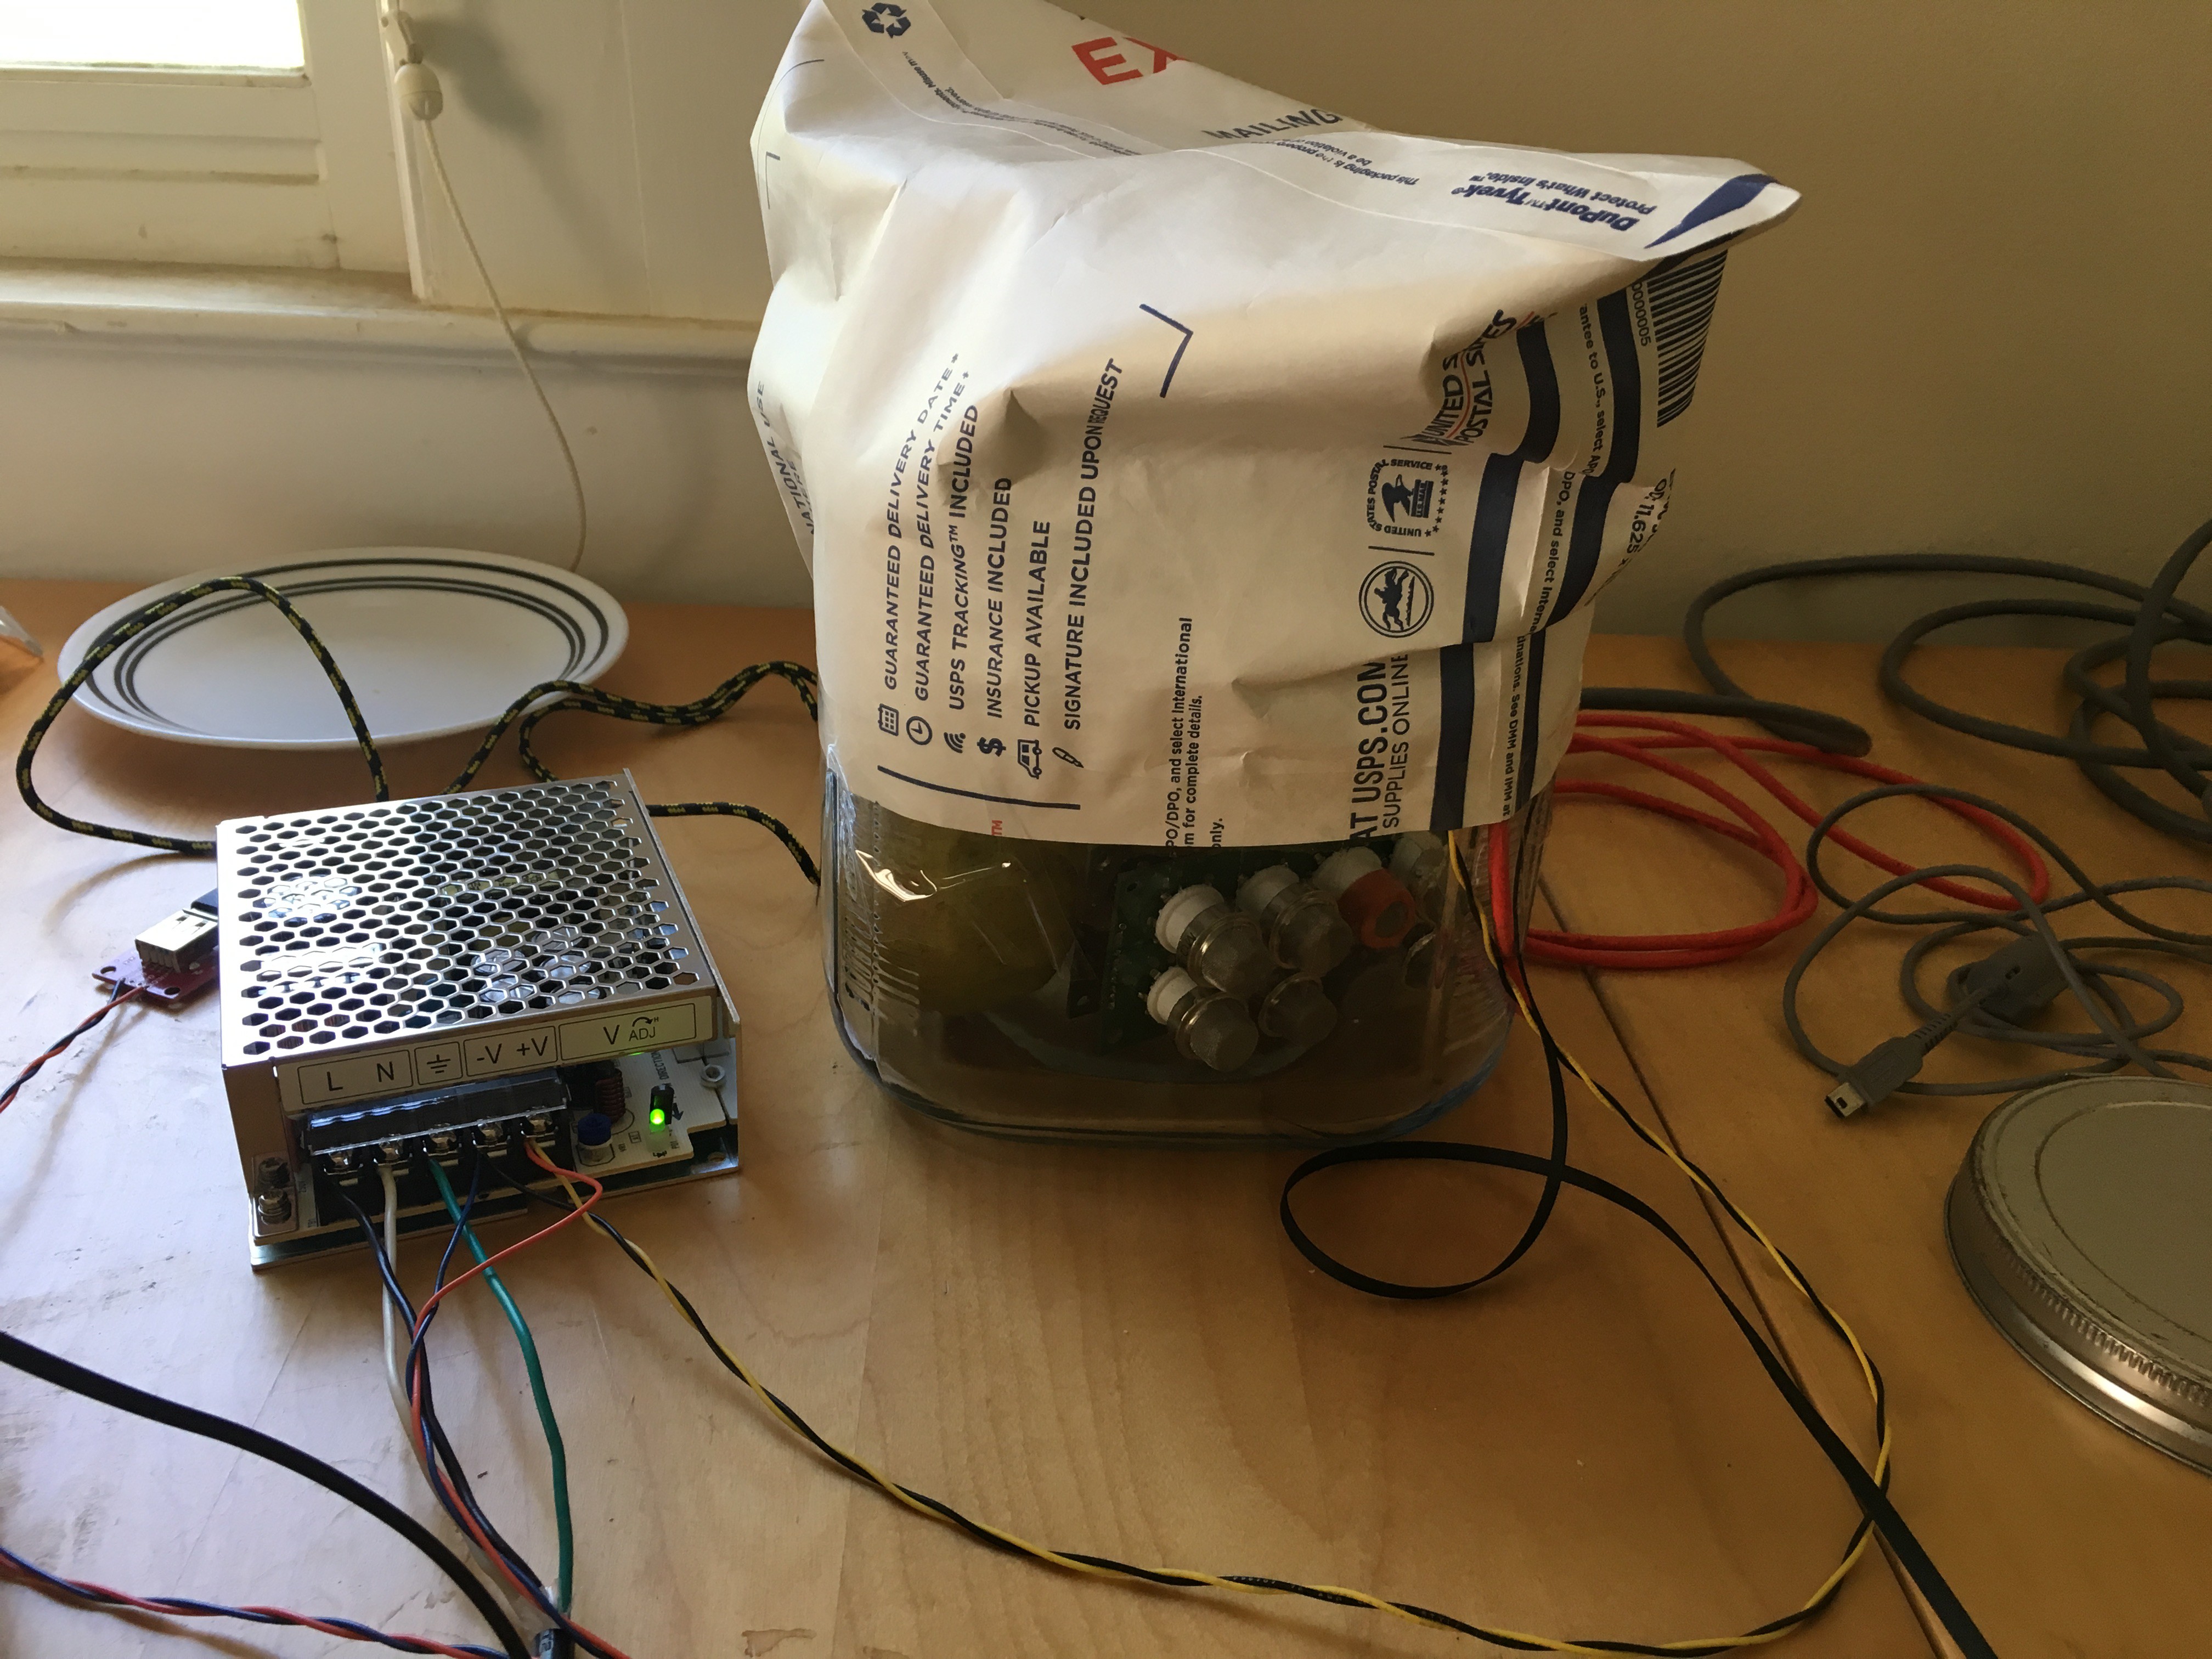
* New, better-sealed sample chamber:
![]()
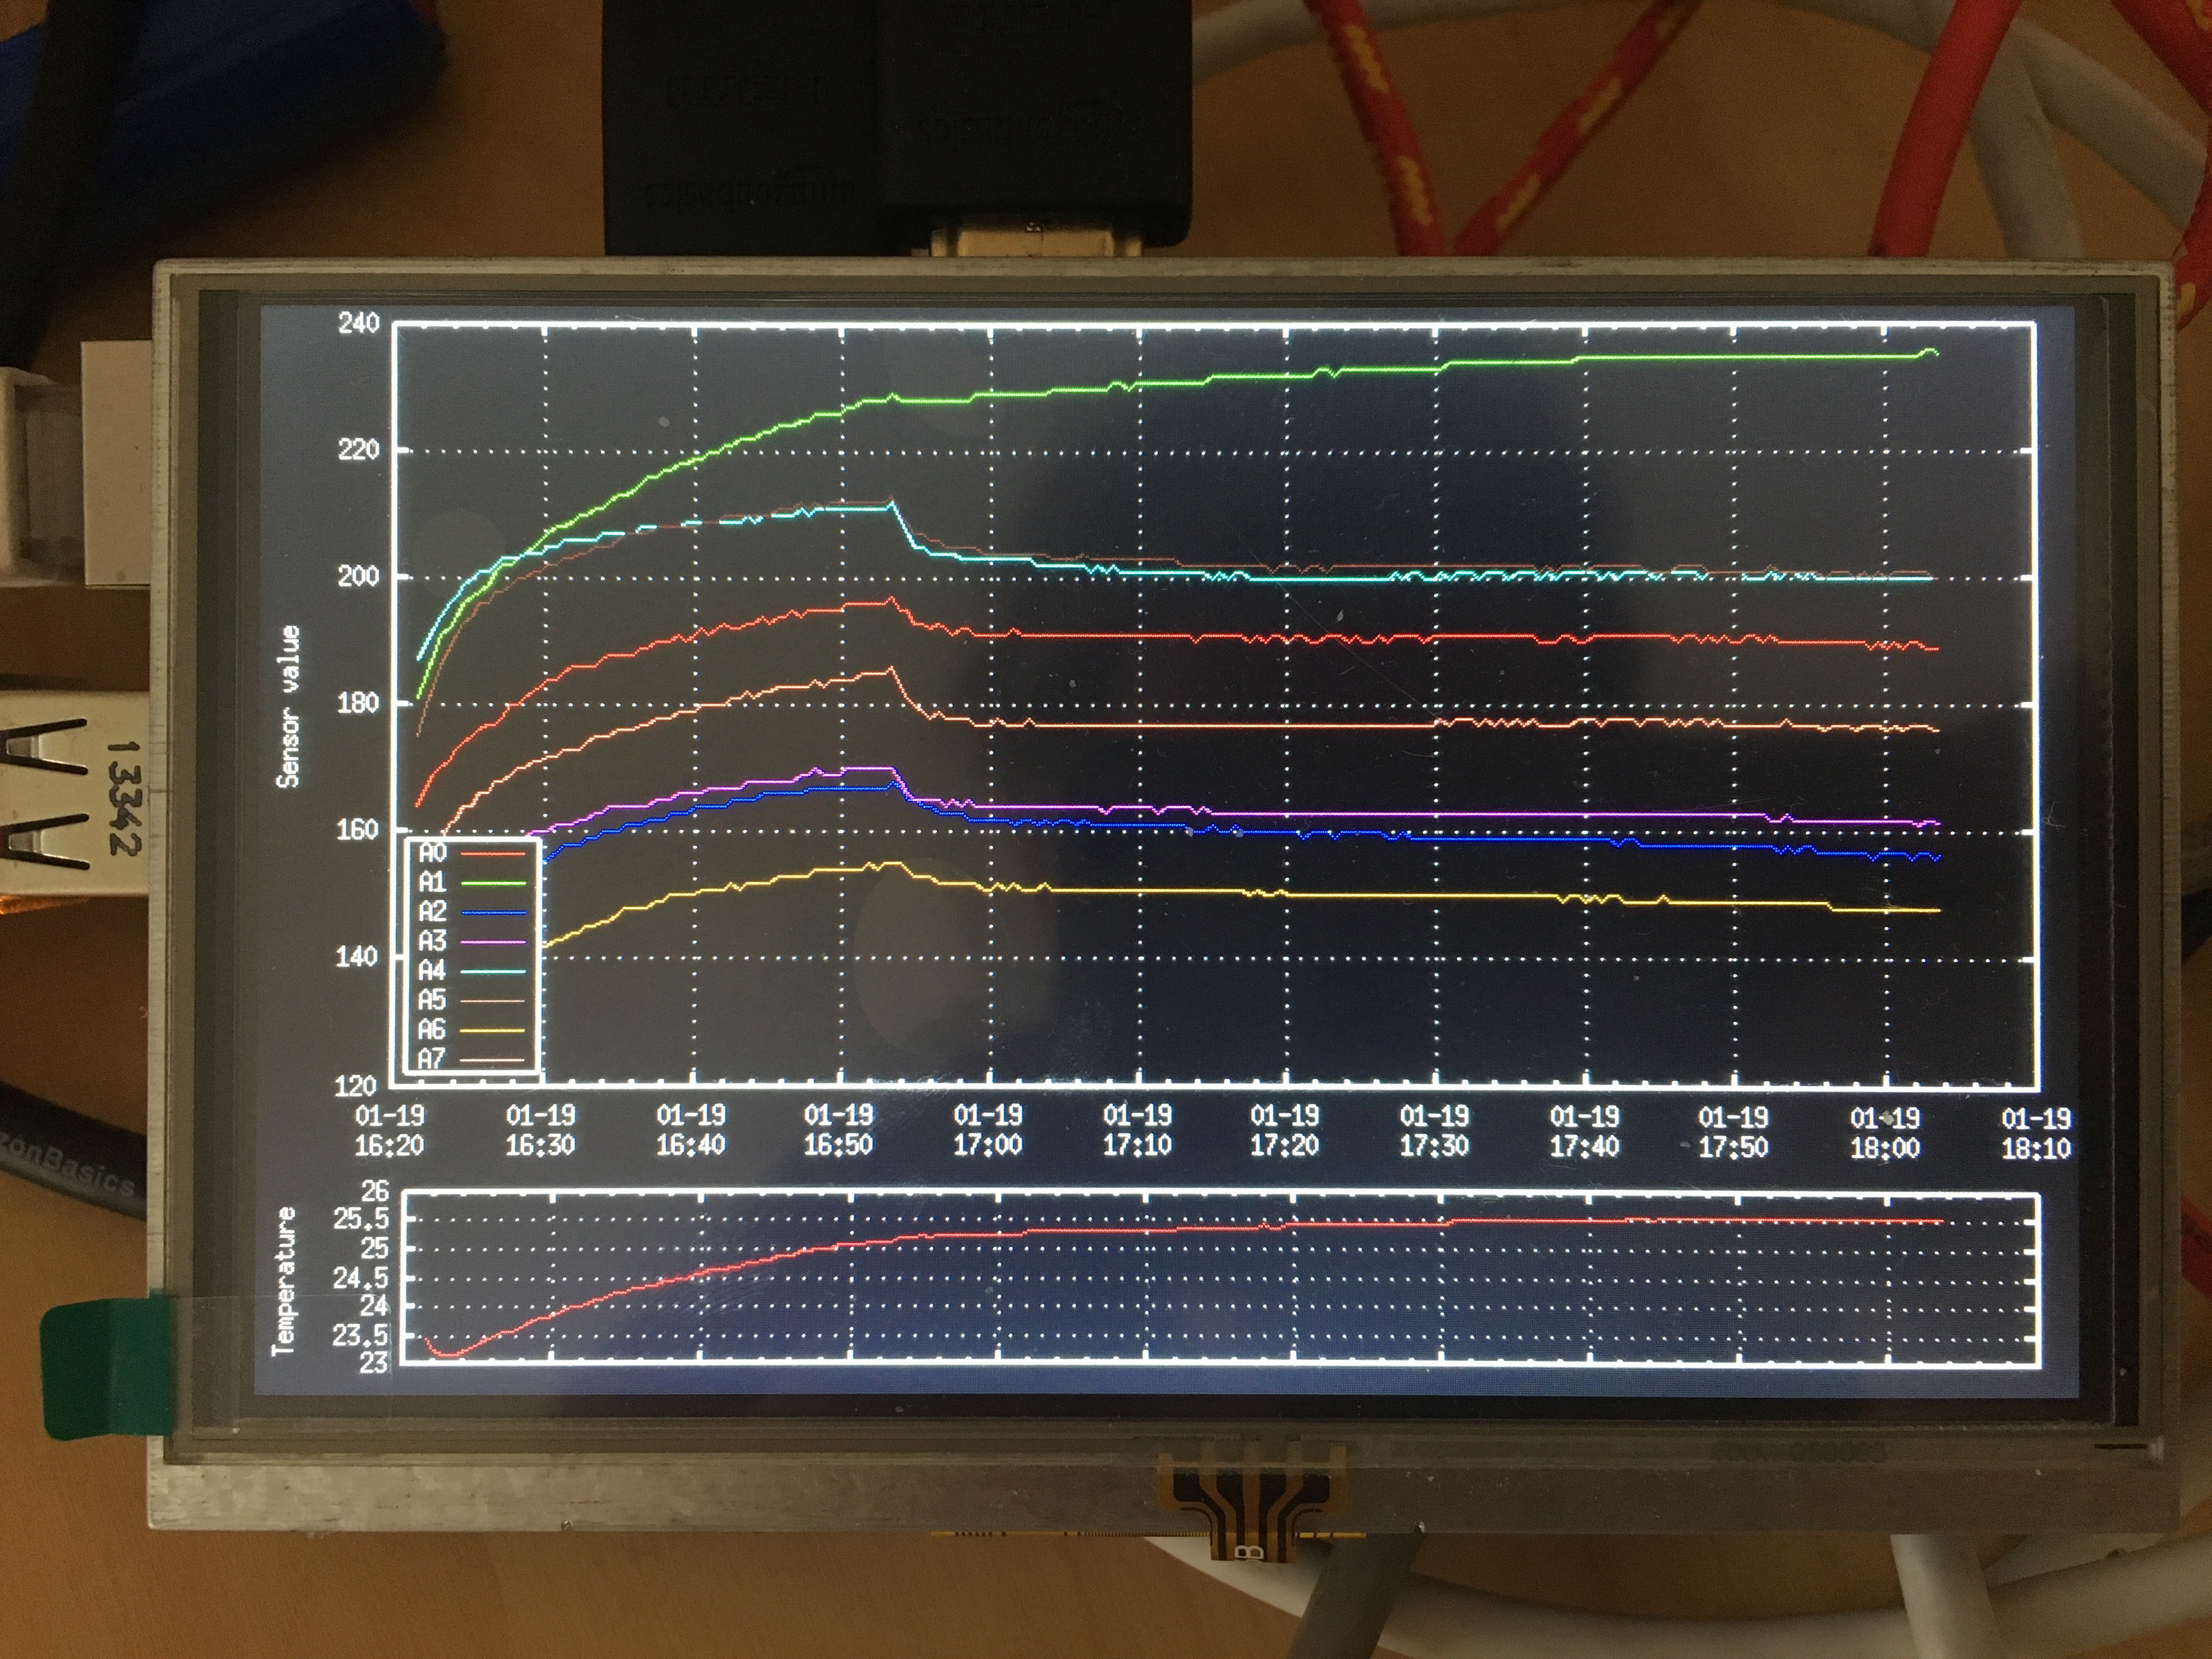
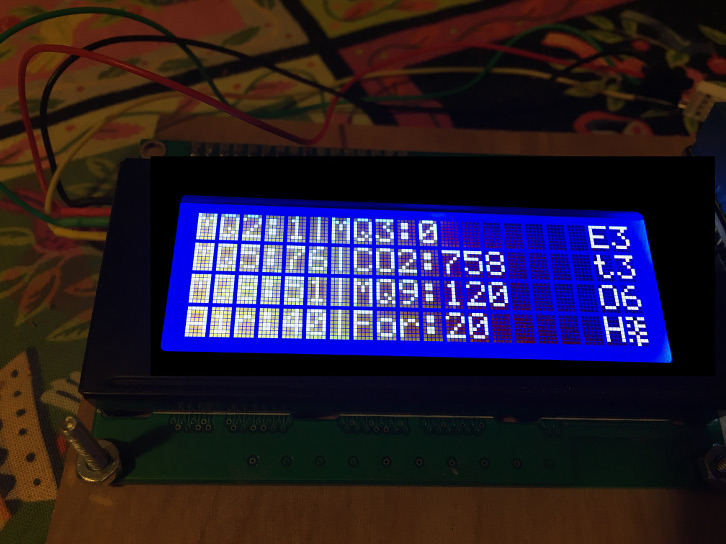
* New, better-sealed and less-noisy data on a new real-time 5" display
![]()
* Adafruit Power Boost 1000 upstream of the Raspberry Pi. This seems to be an actual pass-through USB power source...I had been getting so many elusive and random power outages that would kill the Pi, corrupt its SD card and forced me to reinstall everything, so this is hopefully a little insurance against that.
-
Getting somewhere (October/November)
12/13/2016 at 04:01 • 0 commentsLast time we left off with kind of a one step forward, two steps backward situation: I found that Tyvek is too gas-permeable to be a good sensor chamber material, that our sensors are quite temperature sensitive, and that store-bought apples don't really have much to report to these sensors.
That last part's not too big a deal. If we're buying an apple in a store then we know it's already ripe and ready to eat. That's not relevant to our goals. Apples were an easy fruit to test out as fruit season wound down here in Atlanta and there's less to choose from on the trees.
But I did start getting real, clean data. So now we can move on to fruit that we care about, which is also conveniently our last real option for the season: the native persimmon.
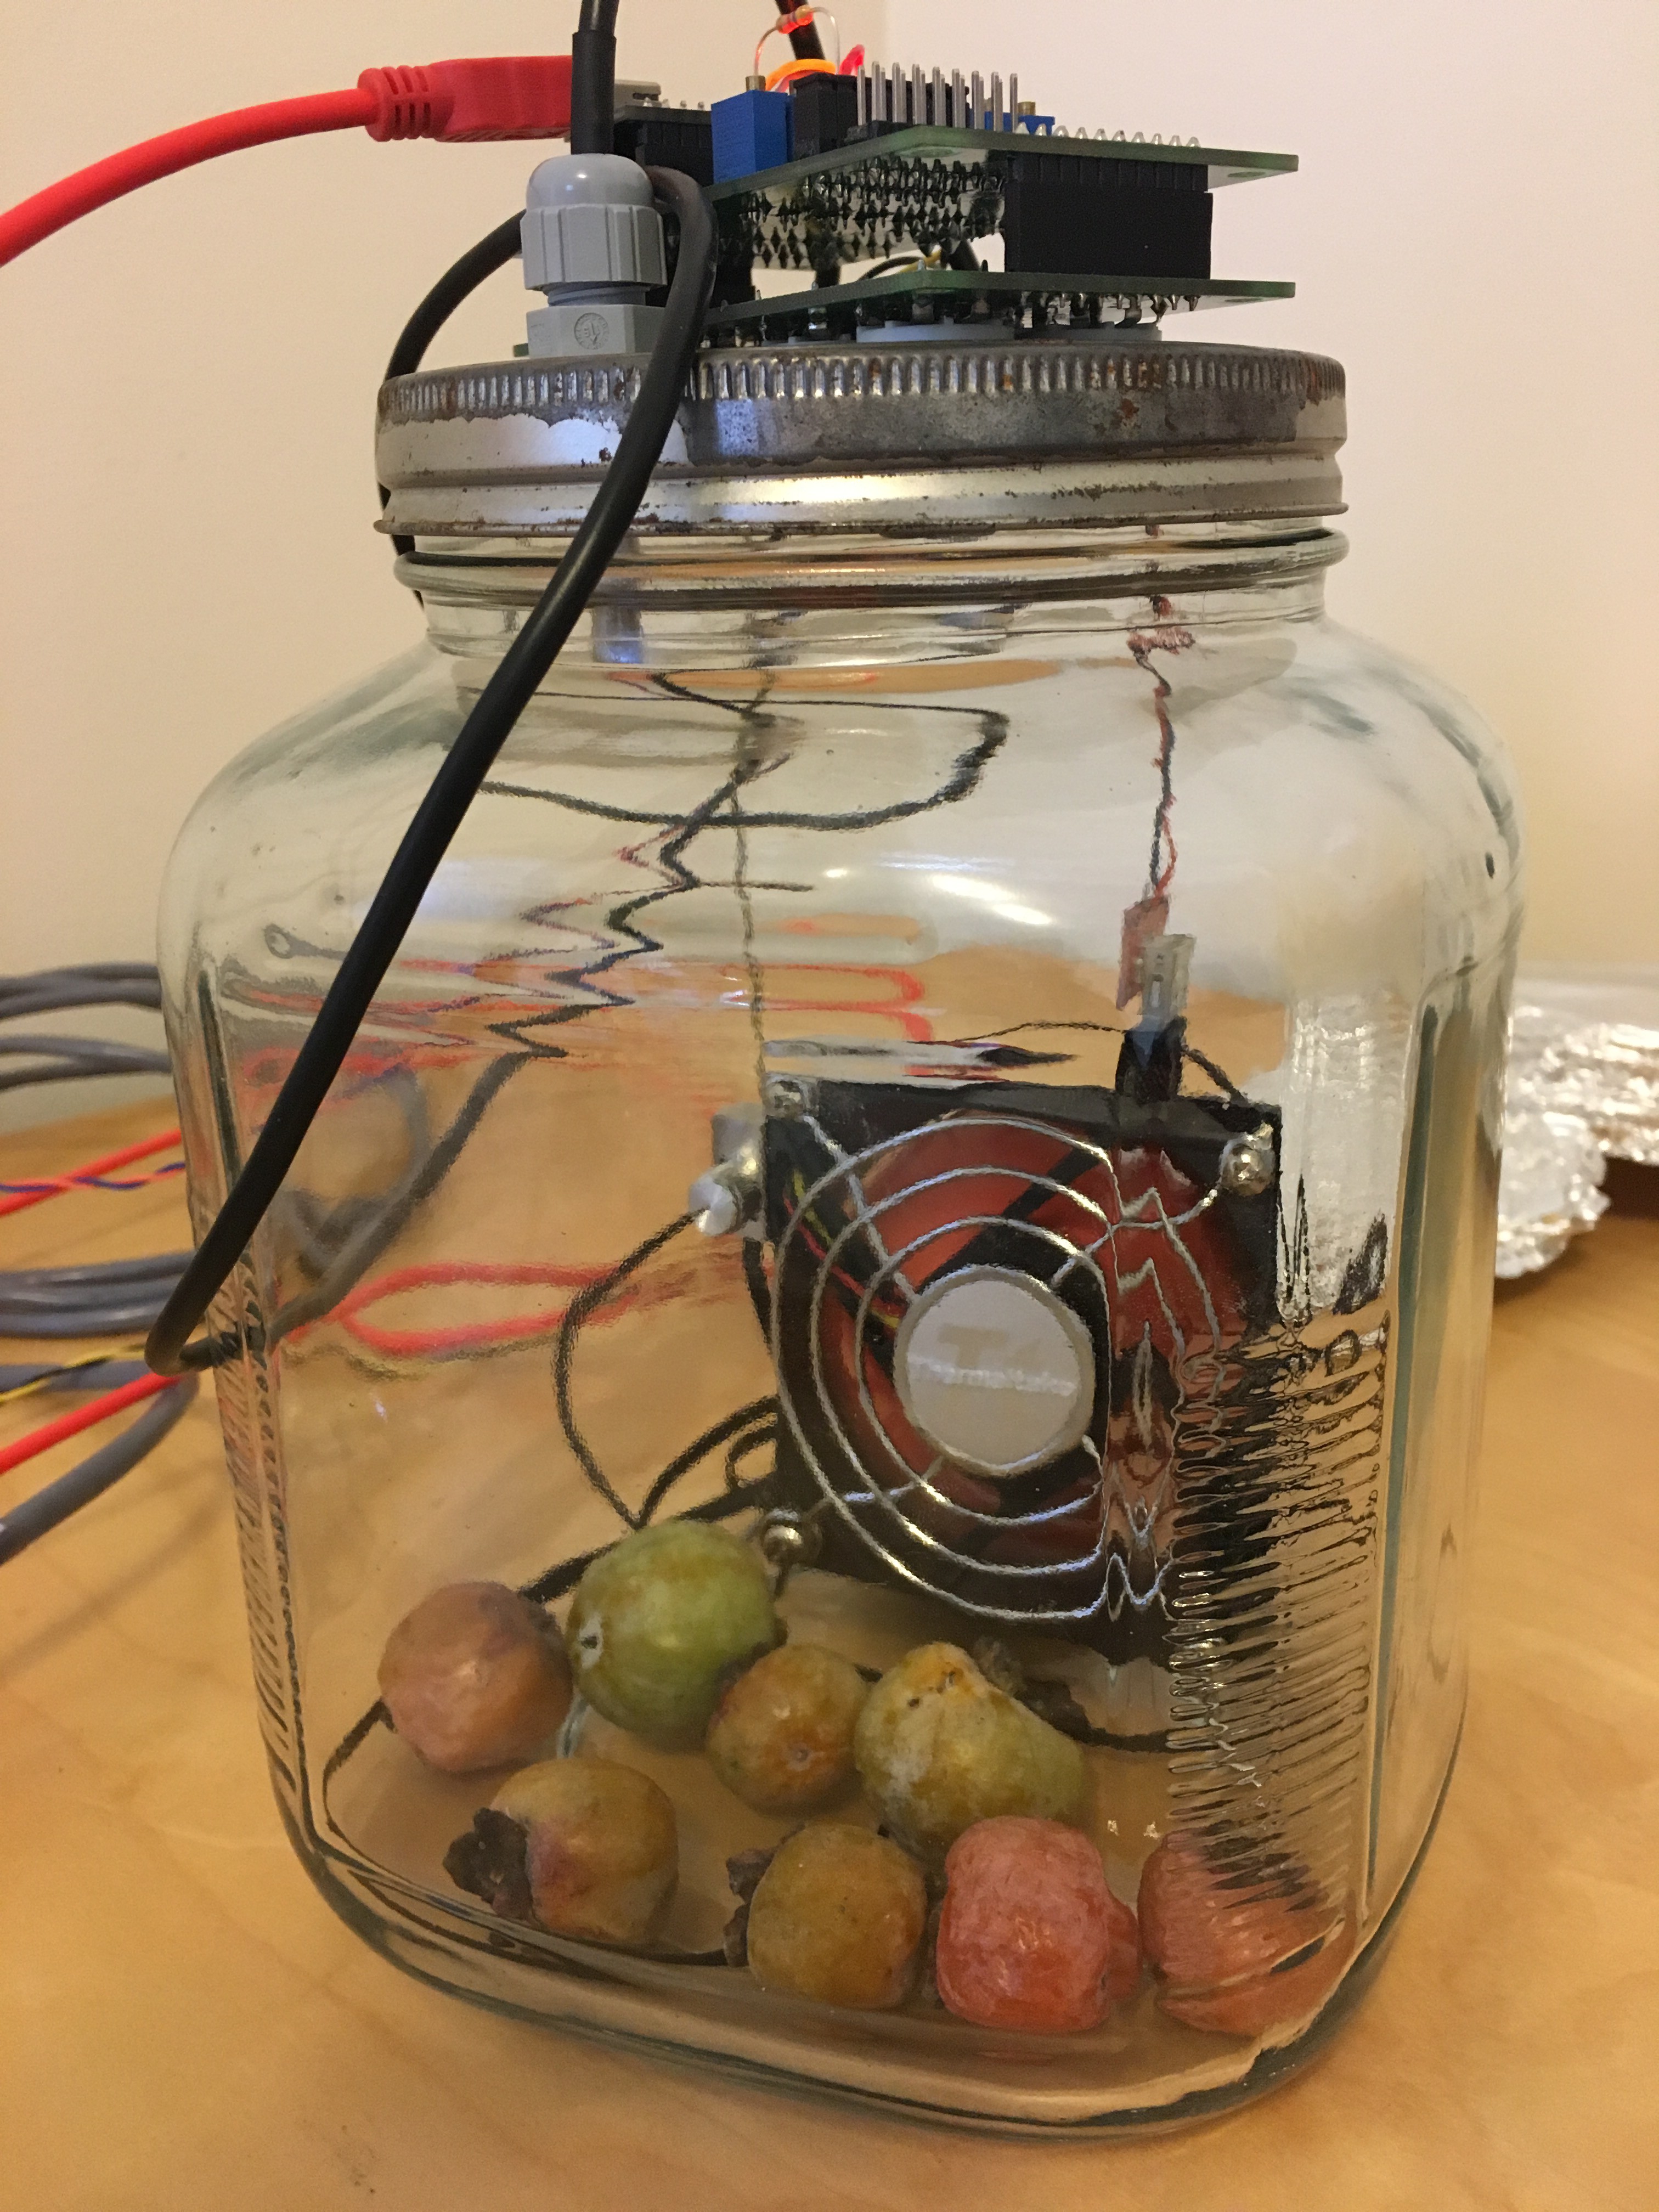
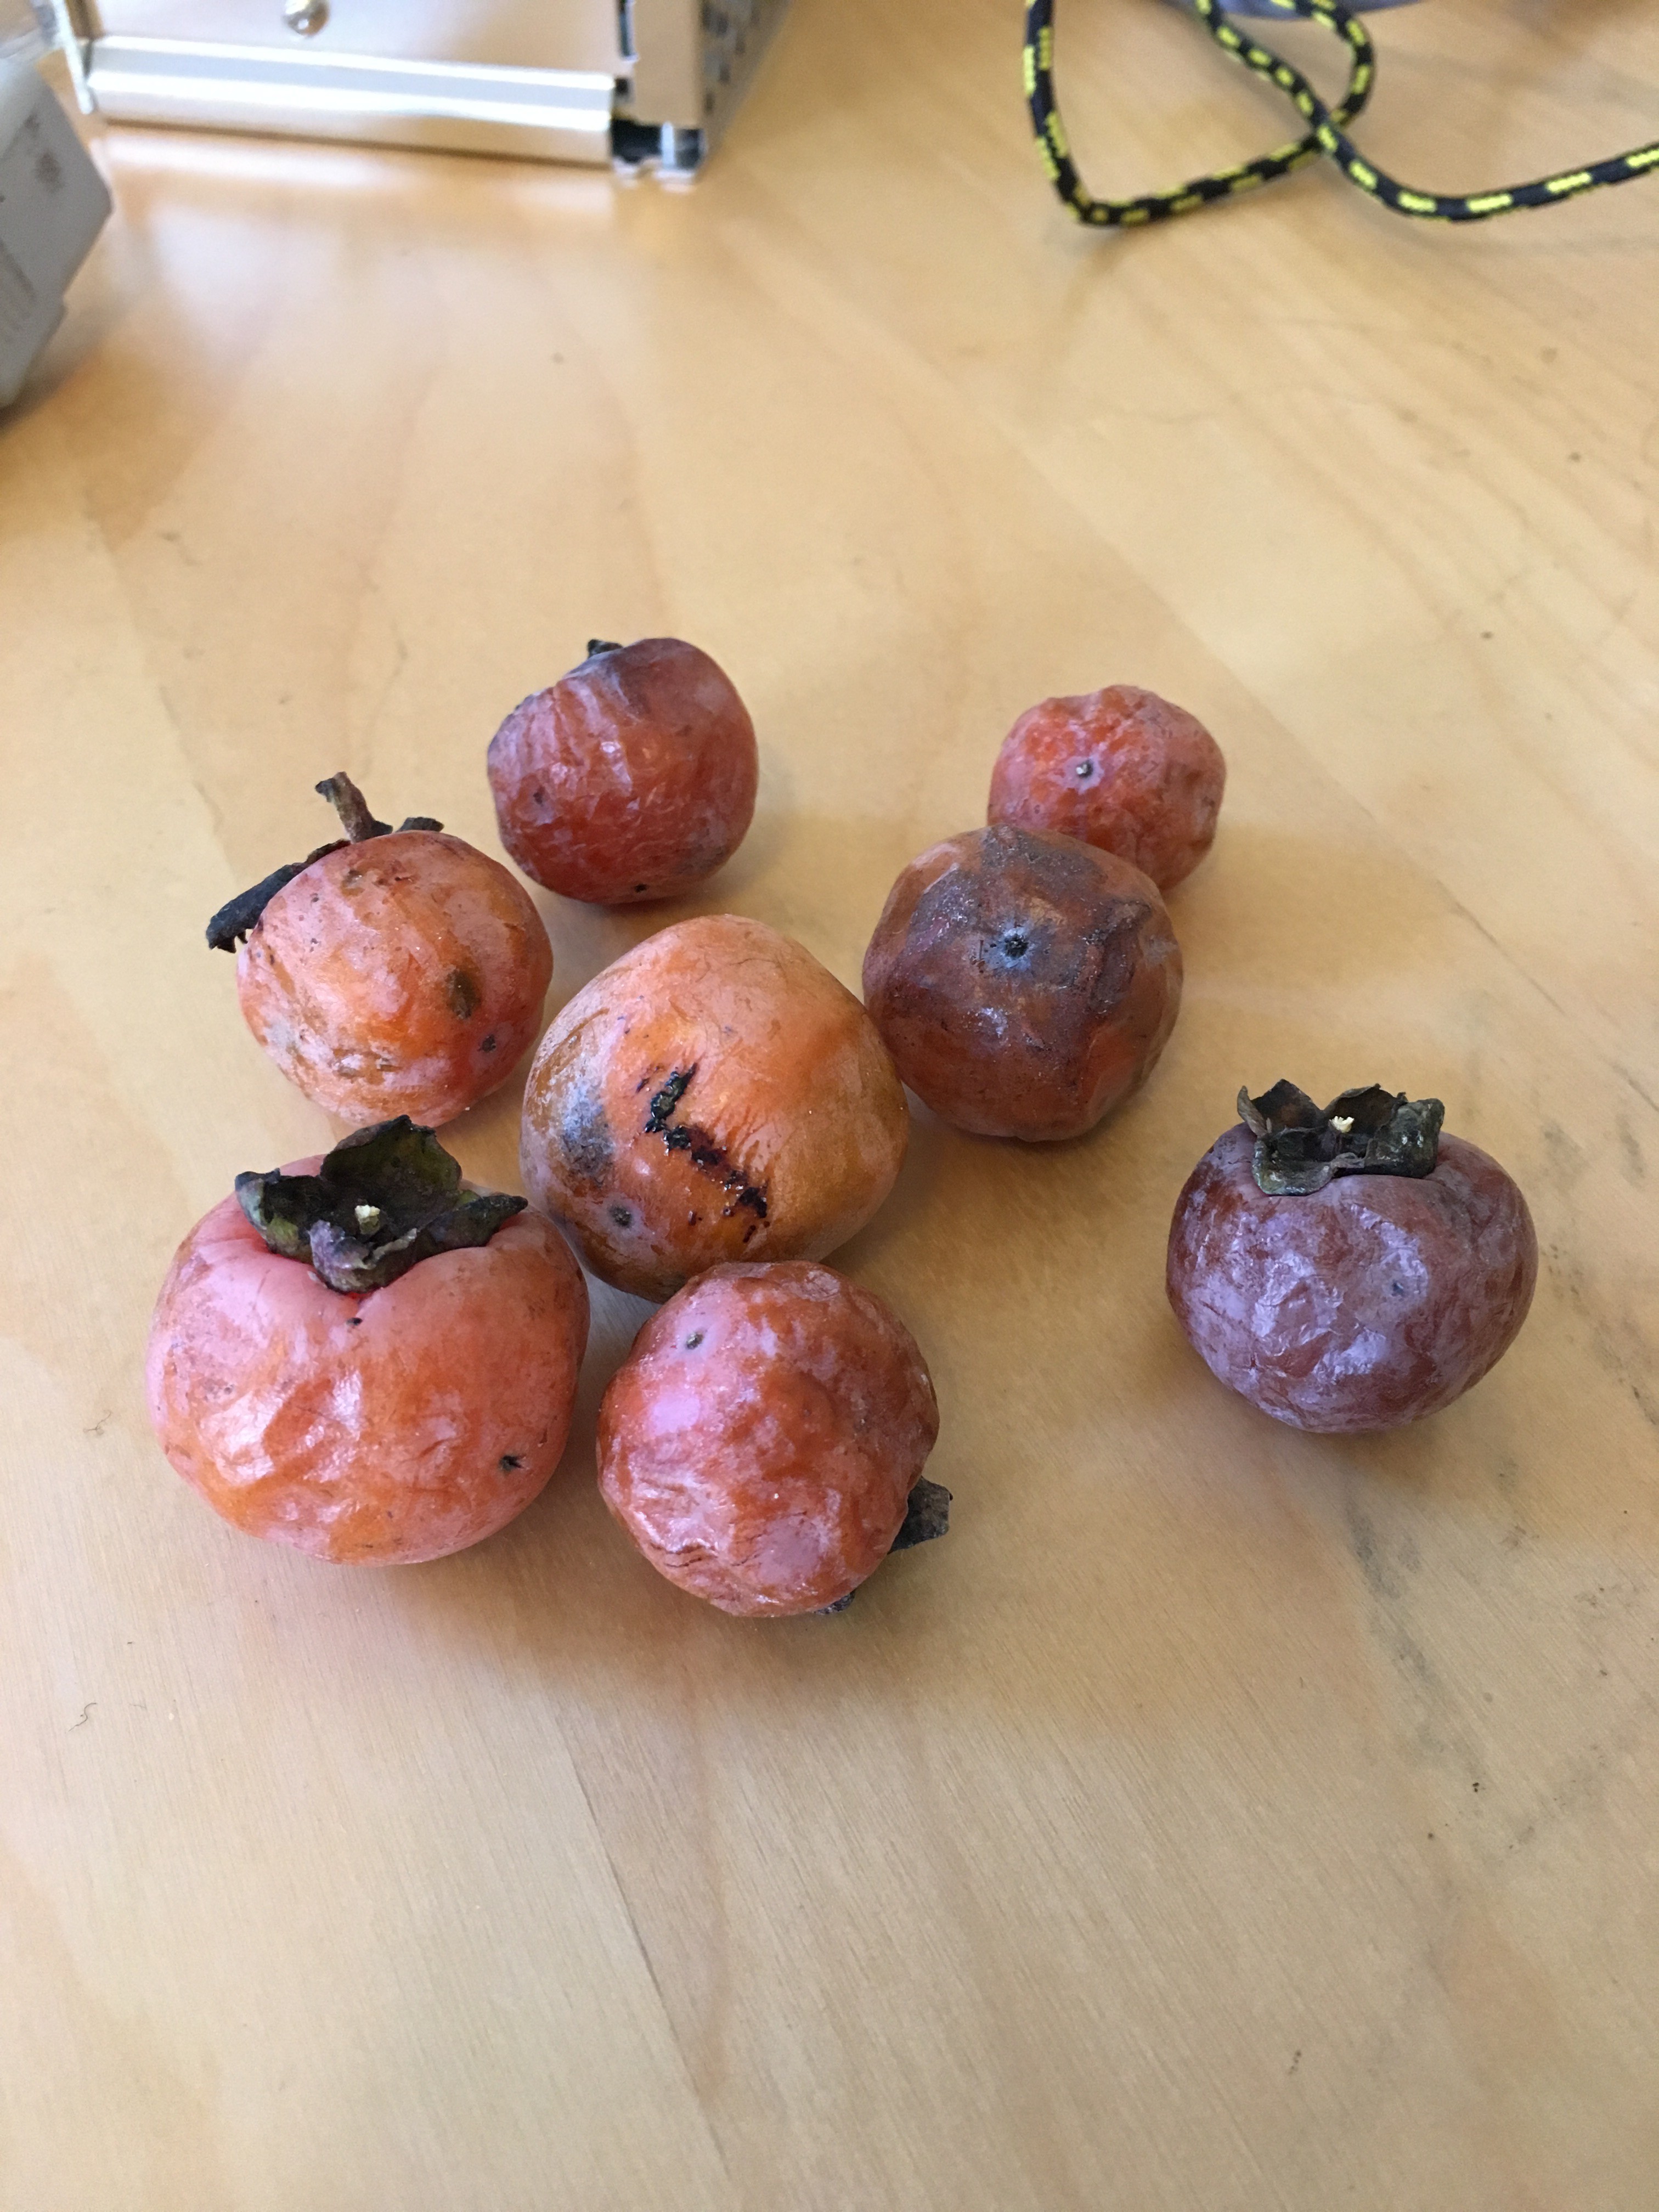
Persimmons
![]()
These are persimmons picked from this tree on October 26th and aside from the 2 small orange ones, it is a group of solidly unripe persimmons. We should hopefully get a good transition out of these.
Fun facts about persimmons: they taste like orange jello when ripe and they can form a bezoar in your belly if you eat too many unripe ones. PLUS double fun fact: you can drink a lot of Coke and its acid will dissolve the bezoar!
New Sensor Setup
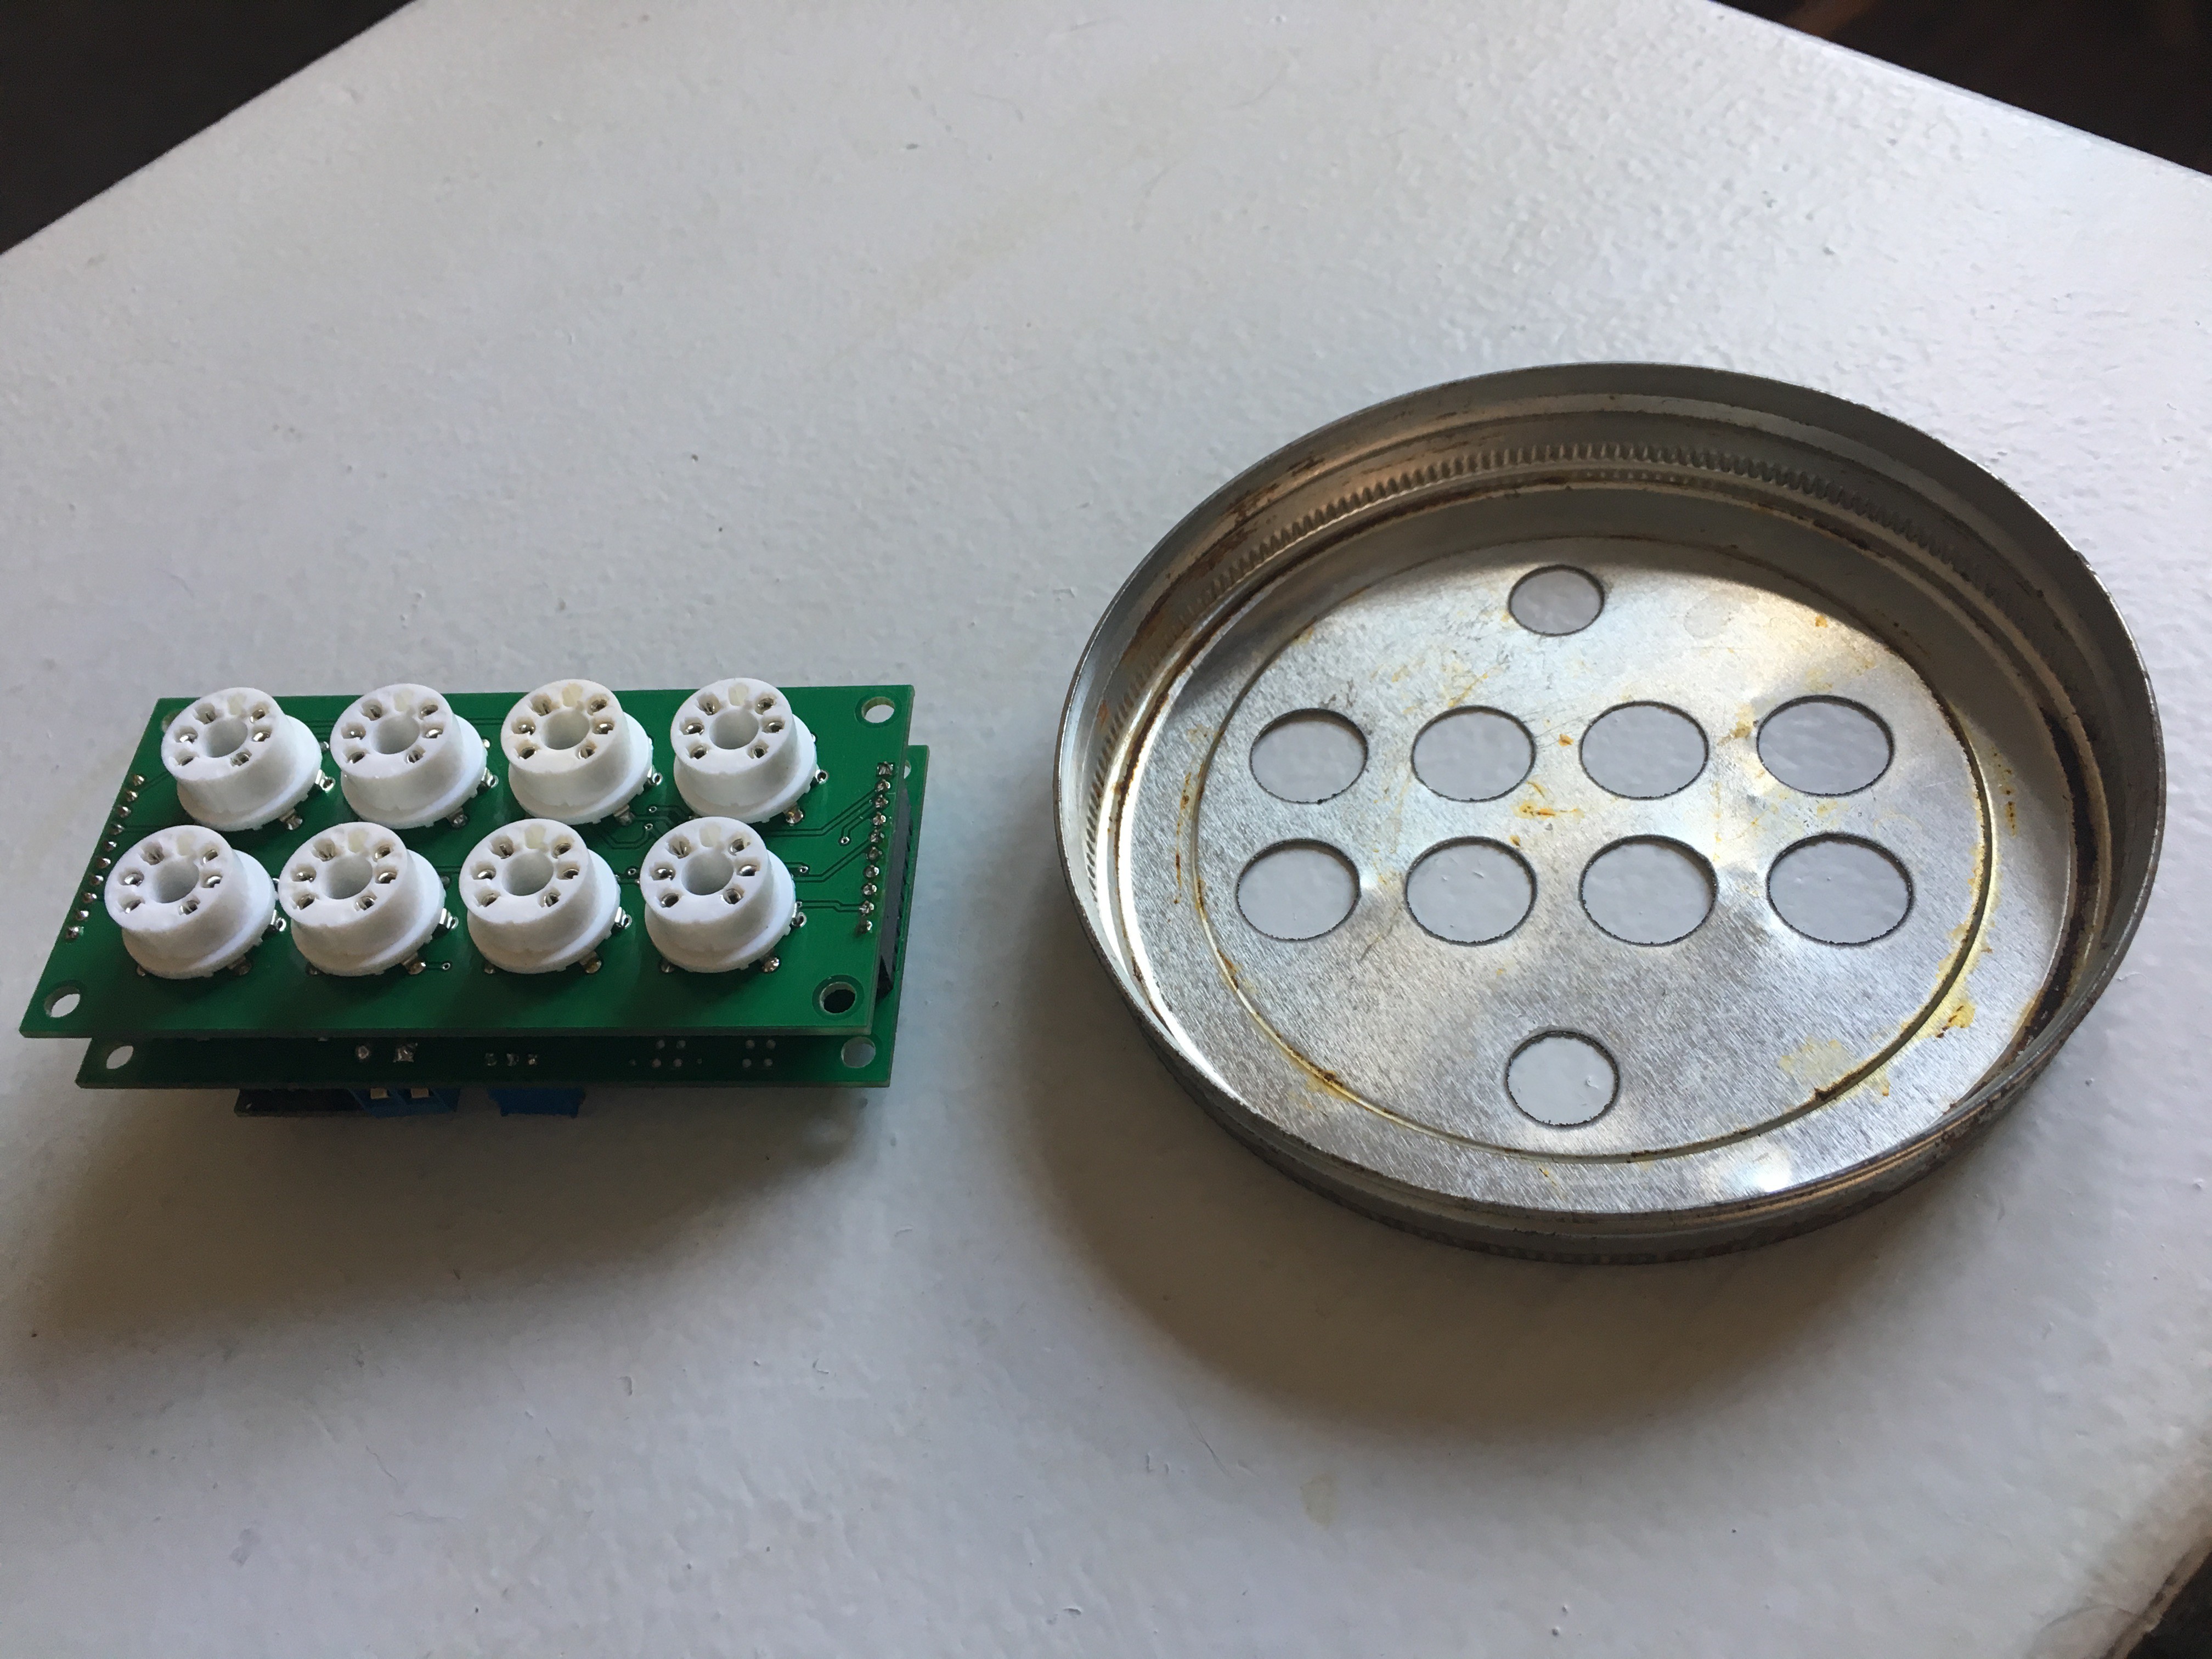
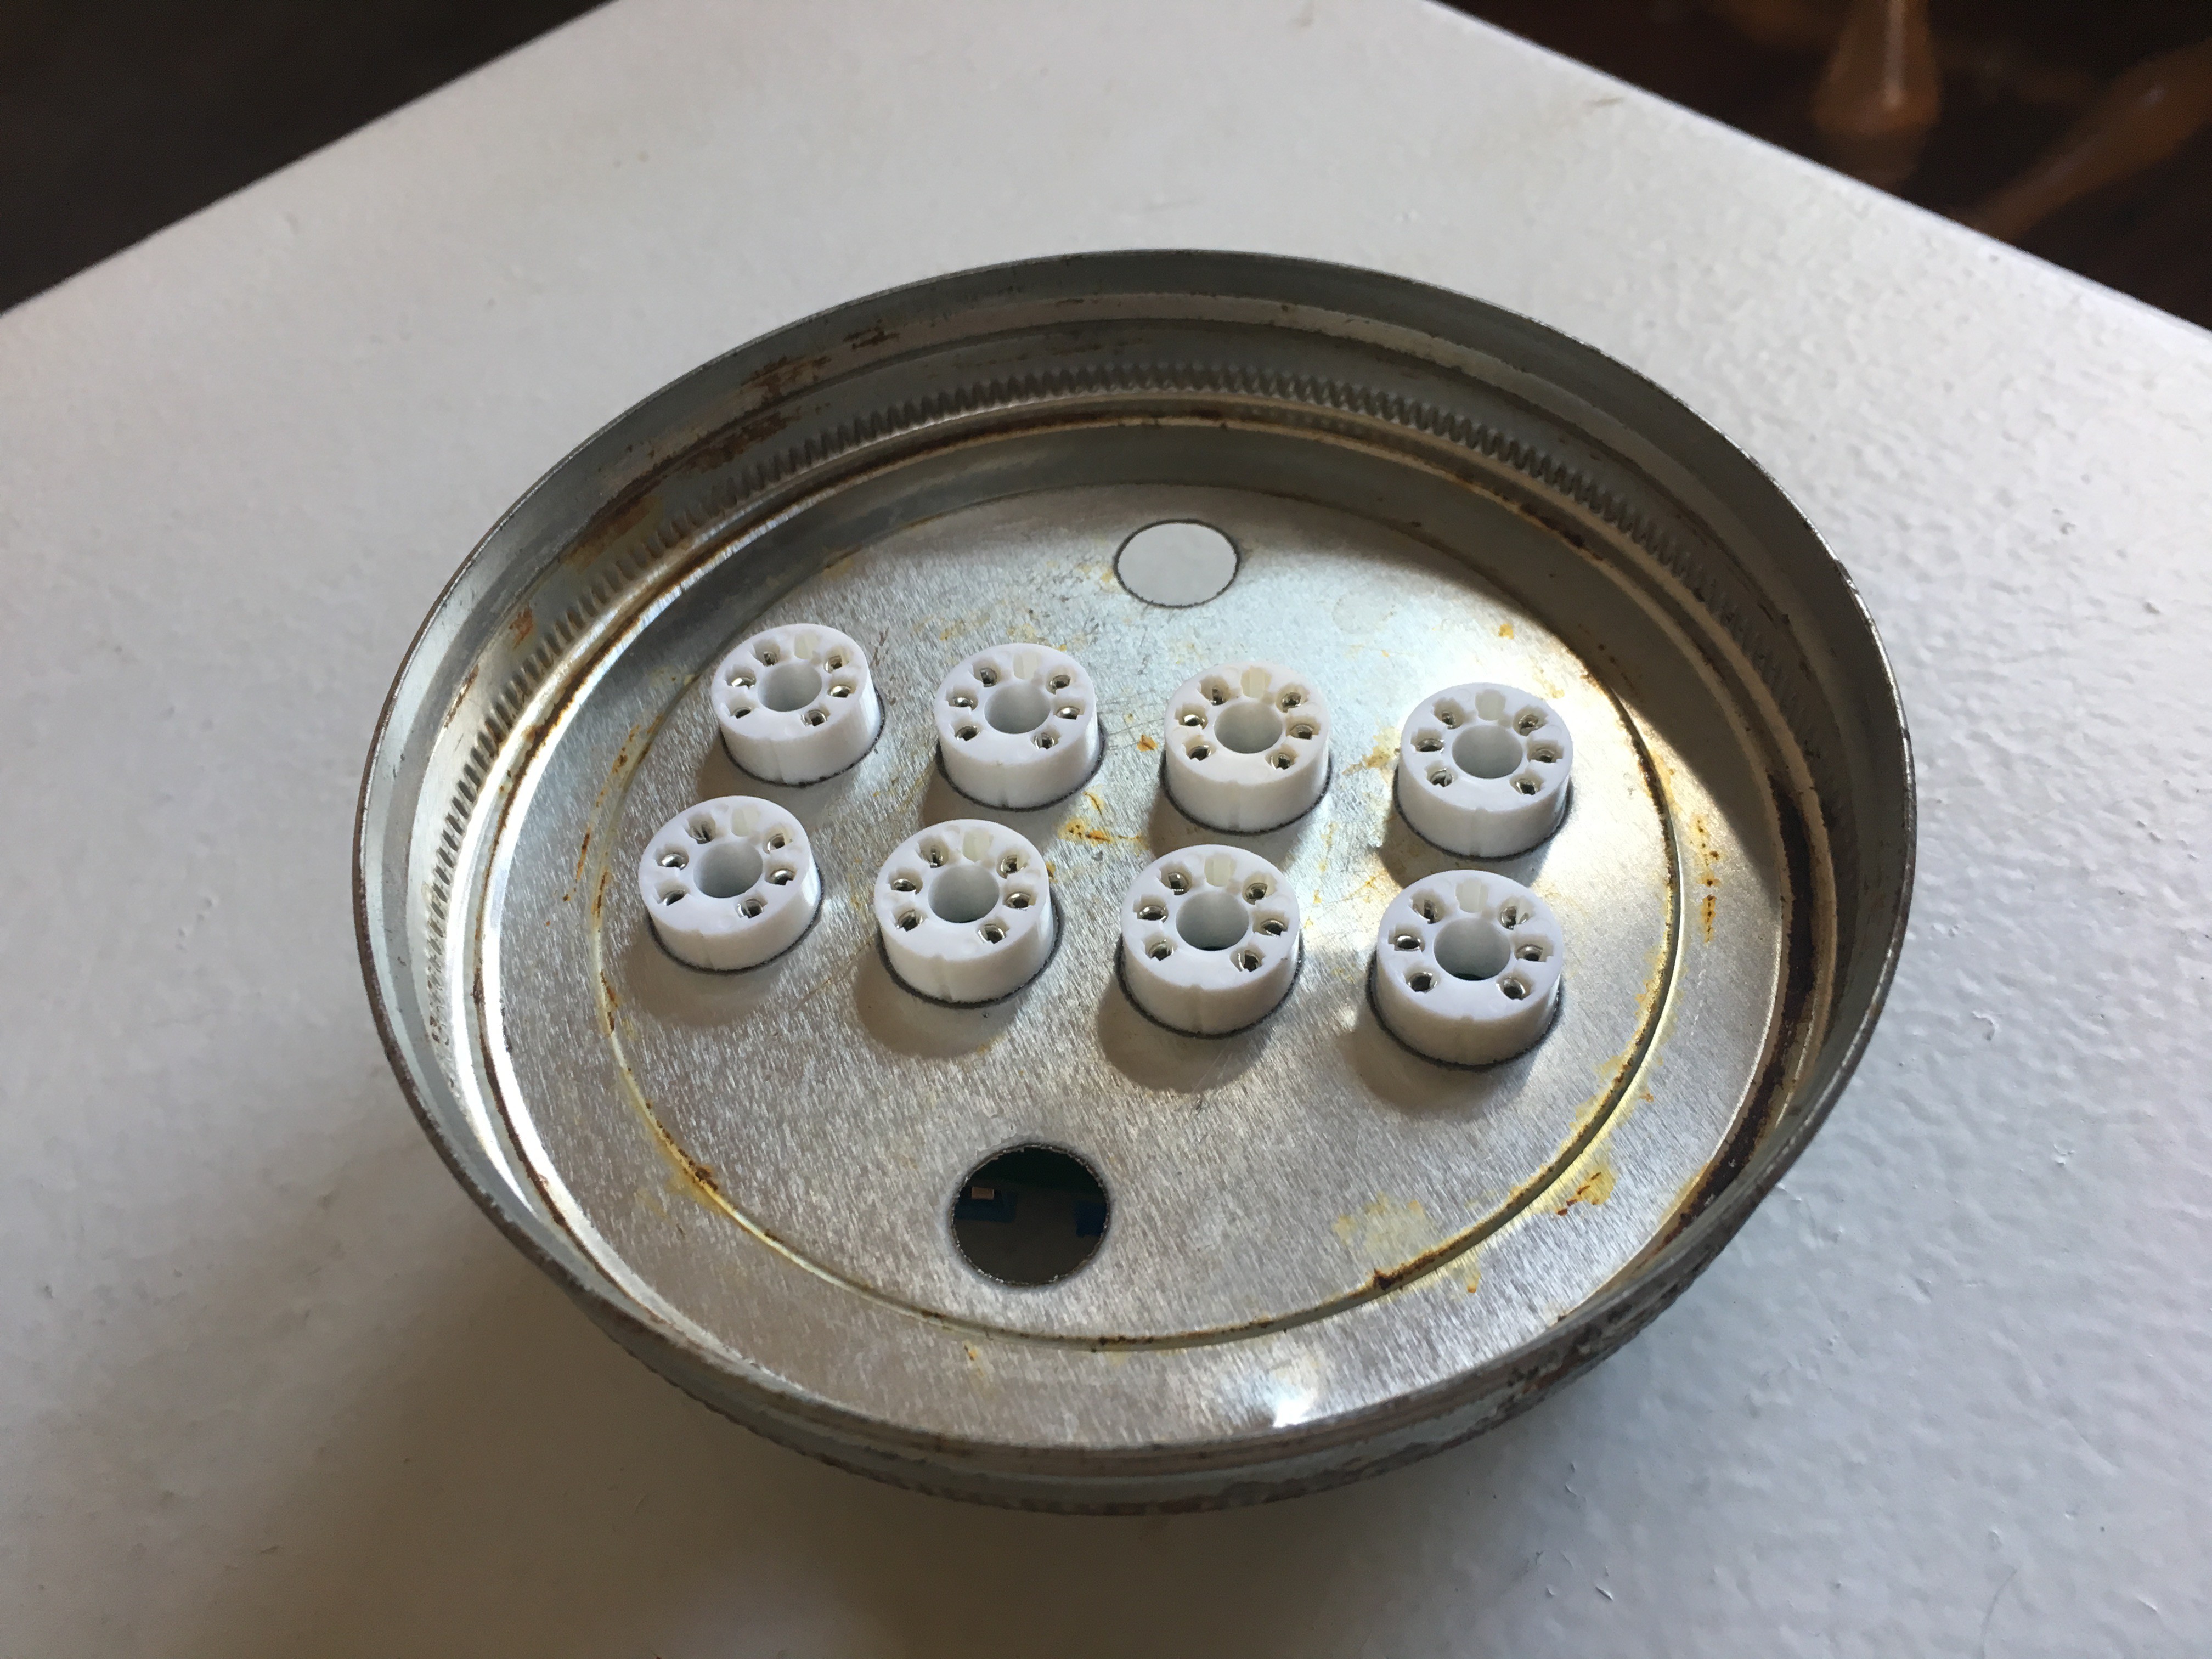
I've got a new sample chamber setup for this iteration too:
![]()
![]()
![]()
I waterjet cut some holes in the lid to mount the sensor electronics outside of the chamber. I also have an extra hole in there for mounting a temperature sensor and a miscellaneous hole for doing power pass-through for a fan or whatever else. I'd love to find a small usb bulkhead fitting but this will do for now.
This new setup is great because:
- It keeps sensor electronics outside of the chamber and away from any condensation
- It mounts the sensors at the highest/hottest point so they should be more temperature stable
- It exposes the sensor trimpots so I can make adjustments without having to open the chamber.
- It's a little more repeatable since I can just screw the lid on and not crimp on a piece of aluminum foil every time I open the chamber.
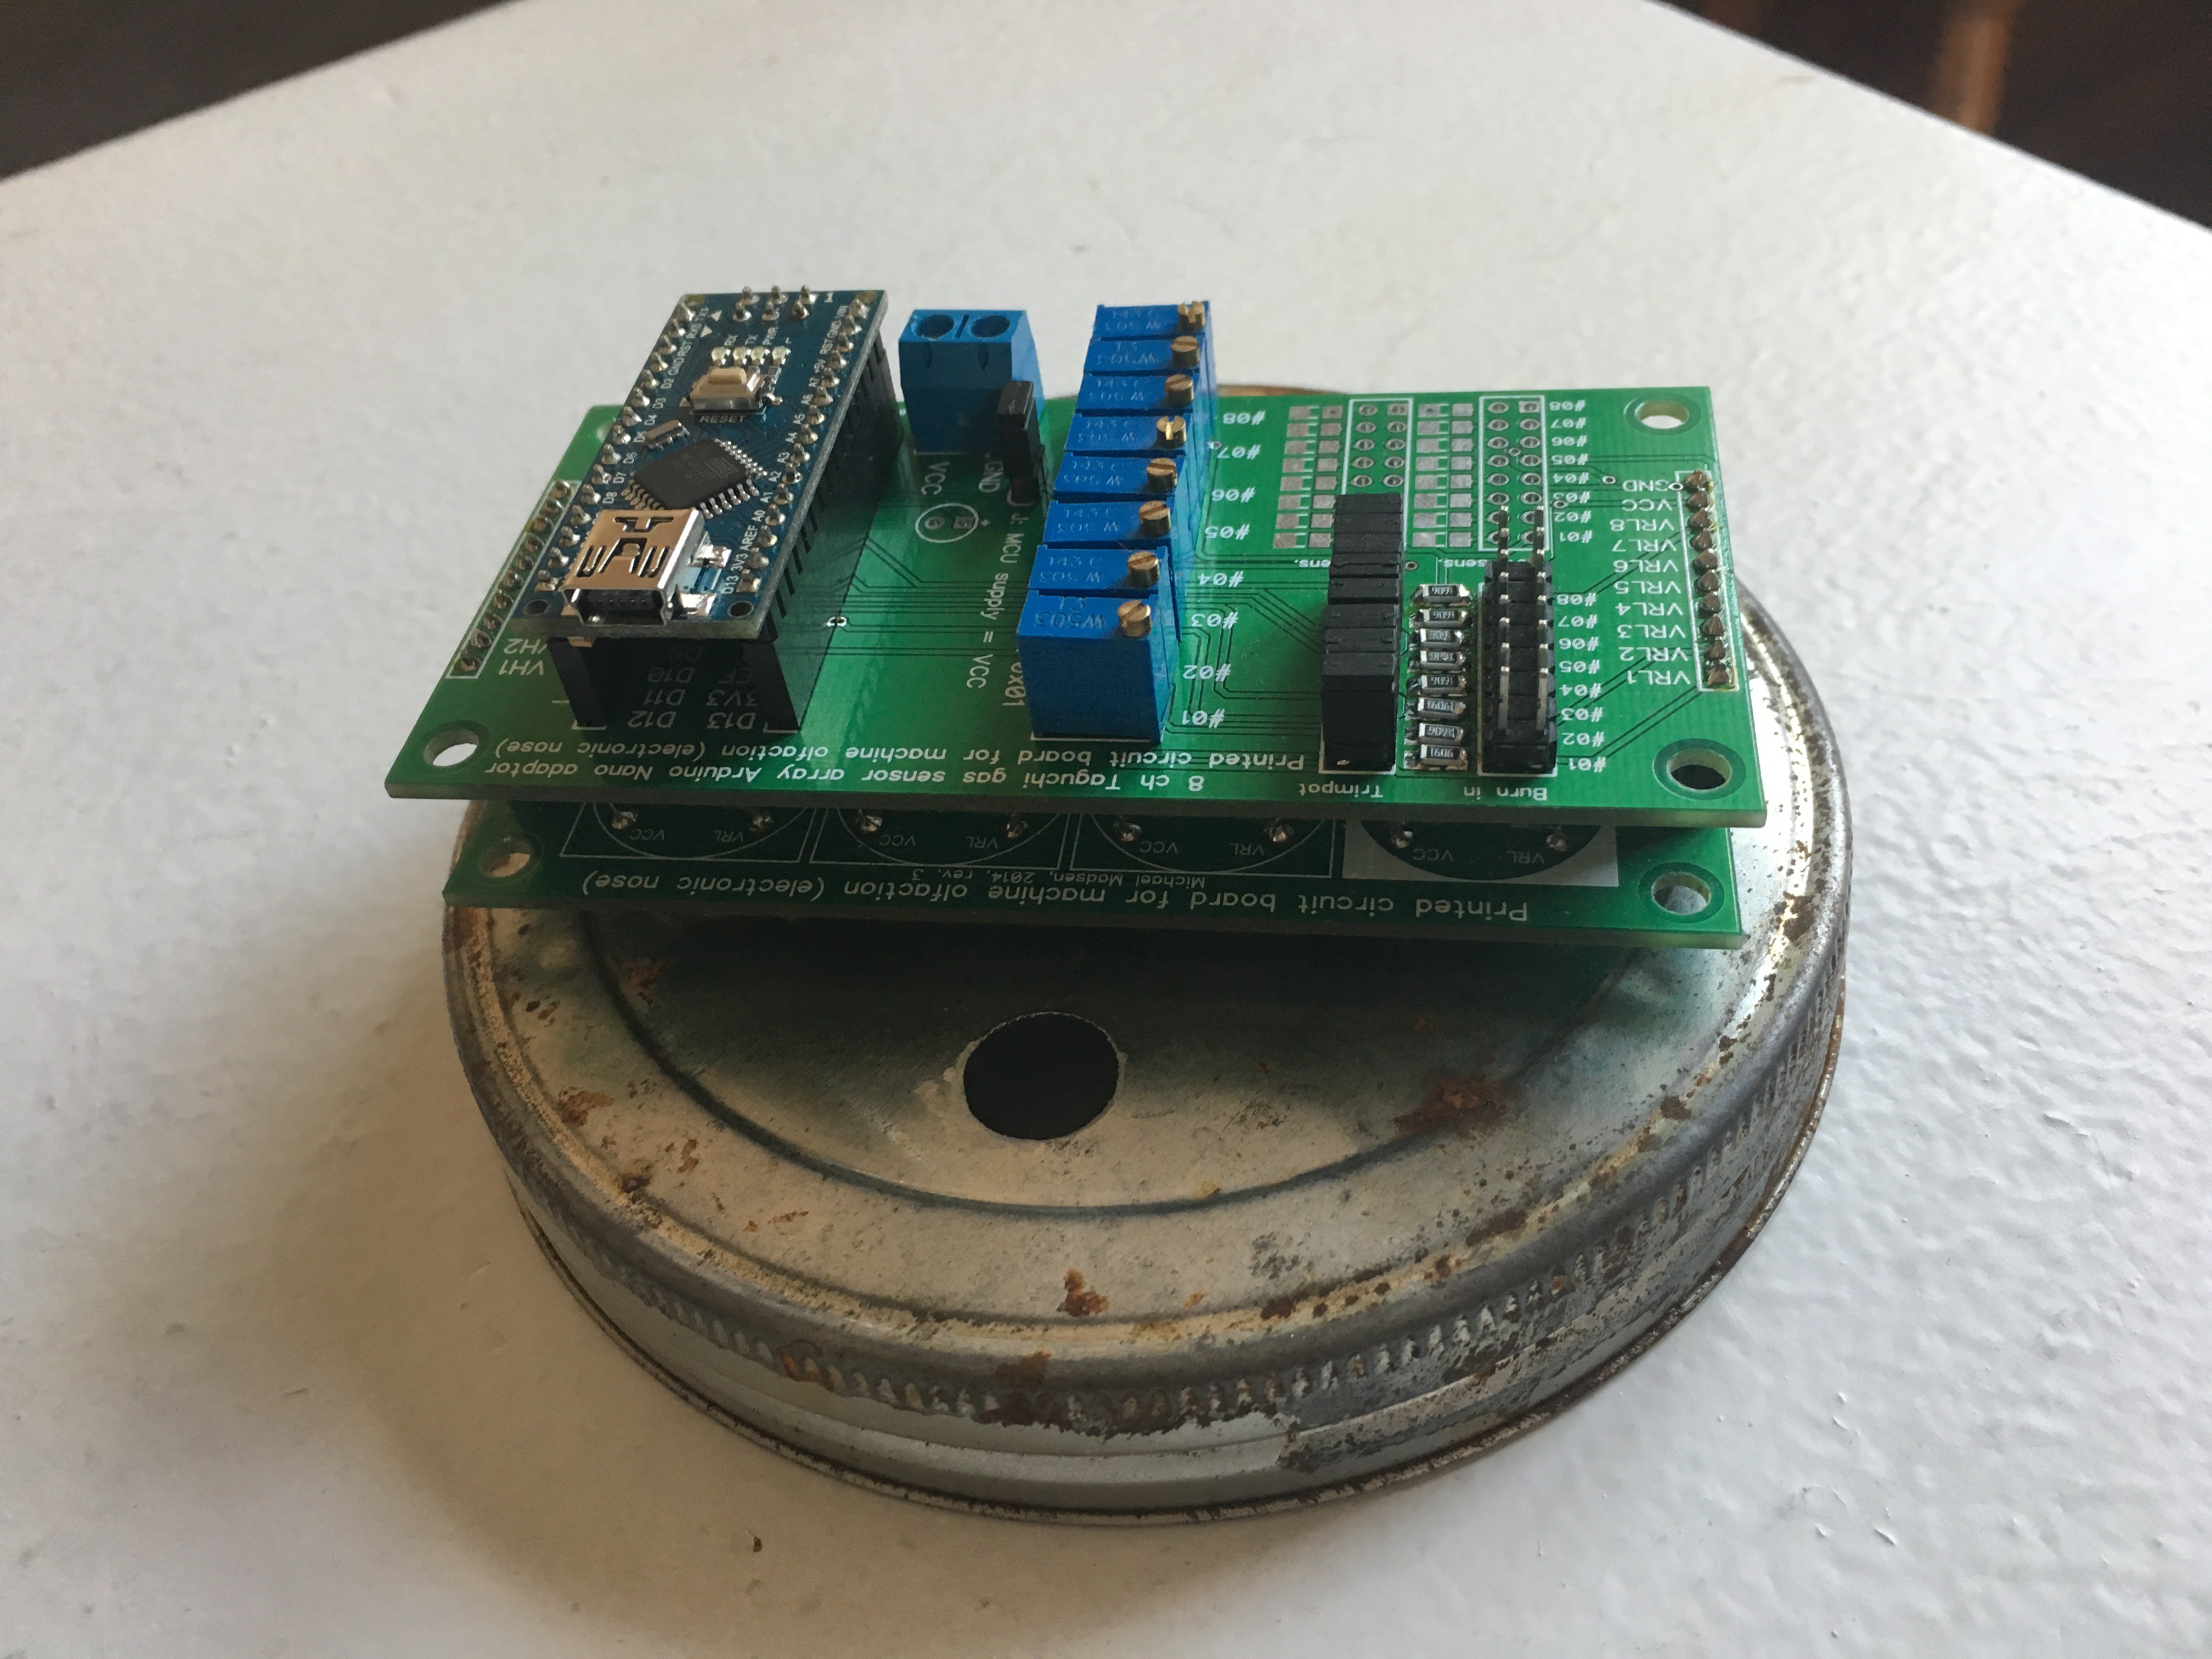
Fully assembled with DS18B20 temperature sensor:
![]()
Sensor Trimpots
Before I get in to the persimmons, a note about the trimpots in parallel with each sensor: I don't really know what I'm doing with these yet. They form a voltage divider with the sensor and act as a way of calibrating the sensor or adjusting its sensitivity. Because I don't know exactly what I'm doing yet, I try to calibrate them to all to roughly same value in a chamber of precision reference air, which is the air in my house.
For reasons that I assume to be related to manufacturing, not all sensors respond the same way to trimpot adjustment, so it's mostly a matter of finding a low-medium shared value that I can reach with each of the sensors. That value is about 145 (out of 1024) with this particular array of sensors.
Ideally the trimpots would be replaced with digital potentiometers so that you could do software-based calibration, as it's pretty tedious to tune each trimpot with your tiny screwdriver. It also seems like the manual trimpots introduce another source of error and having digital potentiometers would allow for more repeatable experiments.
Smelling the Persimmons
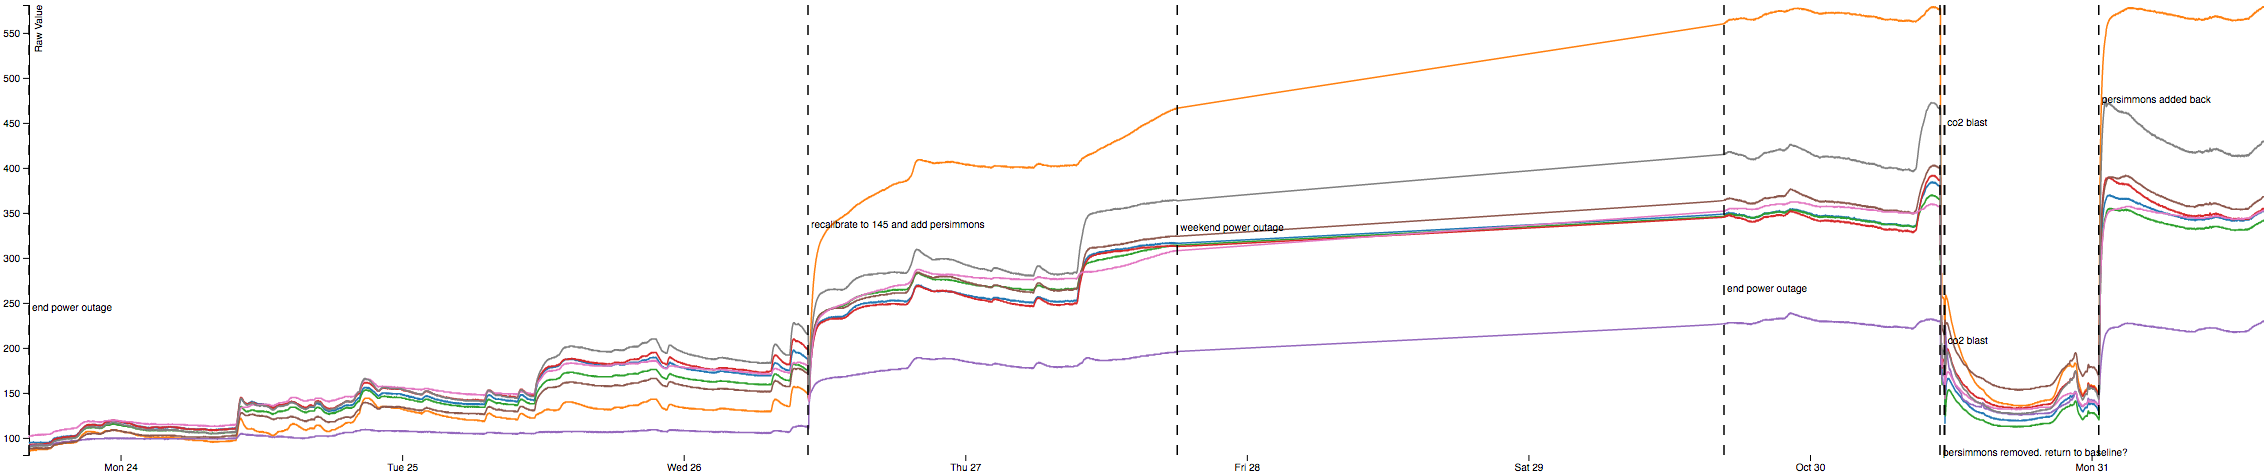
The sensors had been off for a bit and I wanted to give them another burn-out to get readjusted. They began to drift during this time so I after a few days tuned them down to around 145, waited 5 minutes, and threw some persimmons in:
![]()
We have some cool data here! The sensors detected the persimmons instantly and you can see them really start to ripen around halfway through Thursday the 27th. Shortly after, there was a power outage that coincided with my being out of town. It should be noted that the power outage was likely a small blip that was only long enough to knock out the Raspberry Pi. The sensors were warm when I returned home and Atlanta had been in a 3 month drought at that point so it's unlikely it was an extended outage.
Since the container seemed well sealed and since the sensors were warm, I started logging again upon returning home. The sensors had mostly settled in place, with an especially strong response on the A3 sensor, which is an MQ5 LPG sensor. No comment one way or the other on what that means, but still strange and interesting to see. 🤔
![]()
Persimmons after removal (Oct 30).
Testing short-term repeatability
As a small side-experiment, I took all the persimmons out, grabbed my CO2 tank that I use for soda carbonation, and used it to purge the sample chamber gas. I let the sample chamber idle for about 9 hours. The sensors all returned to the 145 ballpark, and I was pleased with how close they got, but it could definitely be better. Low value in the array was in the 110s, high value was in the 160s. Putting the persimmons back in returned the sensors to their previous values. Cool.
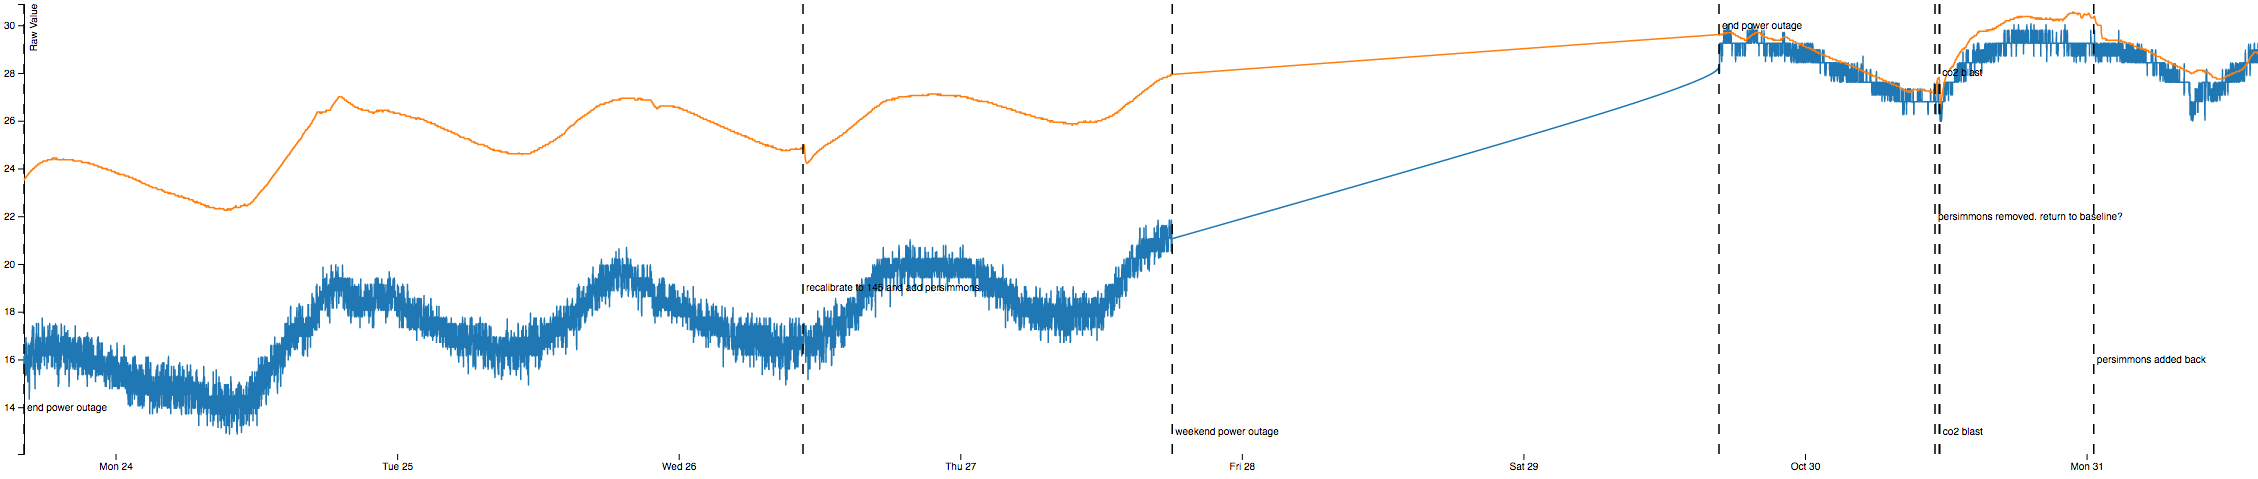
Temperature variance
Temperature changes over this whole period is here:
![]()
It's not that much more stable with the sensors mounted in this new position. What's more, the Atmega internal sensor is actually not too bad! It lags behind the actual temperature sensor for several days, but it's also now on the outside of the sample chamber.
The temperature range recorded over a day isn't really that different from before, even with the sensors in a the higher, hotter position. But even with a similar temperature range, there's much less of an obvious temperature effect on the sensor data. There's a slow decline centered around the "Thu 27" label and there might be a similar thing going on with "Tue 25" and "Wed 26": a small peak just before the day label, and then gradual slope downwards. The sharp upward peak also seems to begin as temperatures have bottomed out and start rising again. This may also happen on the 30th with the sharp peak just before the persimmons were removed.
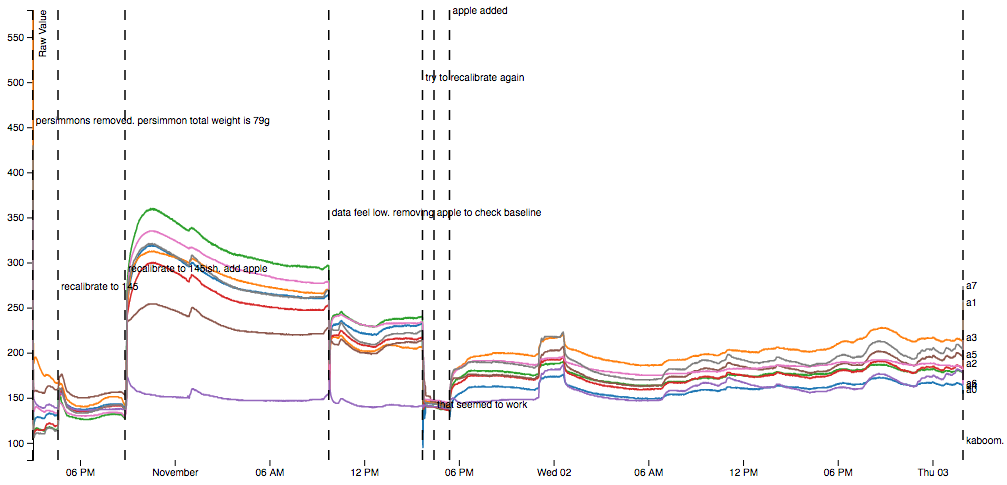
Testing long-term repeatability
Taking persimmons out for 9 hours did fine, but what about trying an apple again, especially now that temperature seemed to be less of an issue? Kind of a horrible mess:
![]()
I removed the persimmons, recalibrated, added an apple, got data that didn't resemble previous apple data, removed apple, recalibrated, over and over.
I was finally saved from this sad loop by a fluke accident: I removed my iphone cable from my phone, dropped it on the desk, and it recoiled in such a way that it pushed my tiny screwdriver in to a small hole in my power supply, where it shorted a large capacitor and fried the supply. No joke.
![]()
Lessons learned / things for next time
- Need some digital potentiometers. Calibrating by hand is super annoying and error-prone.
- Need a calibration standard. A shot of vodka seems like a reasonable first start.
- Hide my power supply.
- Maybe an insulated/double-wall chamber?
-
Finally smelling frui^UFinding more problems (September/October)
12/09/2016 at 06:19 • 0 commentsOkay, enough faffing about with getting our sensors stable. Let's see if we can smell something! And heads-up, since this is my first real experiment, it's full of false starts.
I took a pear picked from this tree over Labor Day weekend and stuck in our sample chamber. It was quite unripe because it lasted in there for over a month. Since the sensors give off a fair amount of heat and the chamber was sealed with aluminum foil, lots of condensation built up on the chamber walls.
![]()
And not a lot smelliness to report:
![]()
To deal with condensation and to promote gas mixing within the chamber, I swapped out the aluminum foil for a Tyvek cover to allow water vapor to pass. I also threw in a USB fan:
![]()
![]()
At this point, I had to go out of town for several weeks and didn't want to leave the sensors running unattended, so I had to end the experiment here. When I came back, I could press my nose up to the Tyvek and smell over-ripe pear through the material, so it seemed like it was about as effective as having nothing on there at all.
XXX figure out way to sense fruit on a tree without having lots of condensation and heat influence
Unfortunately, these experiments were taking place right as fruit season was ending in Atlanta, so we didn't have a lot of options from which to choose. My only option at the time was a store-bought apple. I threw it in and returned to the aluminum foil covering along with the fan:
Well this is weird. The apple hung out in there for almost a week exactly and oscillated (with 24-hour period) around the same average the whole time. It emerged from the sample chamber soft and mealy. Thoughts:![]()
- Bad fruit choice. Store apples are basically ripe already and aren't going to change much unless you let it hang out for quite a while. Presumably whatever ethylene or other ripening gases produced by the apple are consumed by the sensor, so this sample chamber may actually slow the ripening process compared to an apple in any other sealed container.
- There is a big temperature effect on sensing! This experiment was run in mid-October, which is the height of leave-your-windows-open season in Atlanta. Also all the times are reported in UTC, so peak temperature seemed to be around 6 pm and lowest temperature was around 9:30-10 am. Apparently if we're going to sense a fruit on a tree we're going to have to do some real temperature compensation.
Until I could get a temperature sensor in place, I tried experimenting with the Atmega internal temperature sensor. This seemed like it would have a decent chance of working because our sensing setup is at equilibrium, so even though we're measuring die temperature it should track ambient temperature pretty well. And it did end up doing that, but seemed a little too narrow-ranged and coarse to rely upon:
![]()
XXX figure out how we're going to compensate for temperature in an actual tree-based sensor.
-
Version 2: real sensor setup! (August/Sept 2016)
10/31/2016 at 04:36 • 0 commentsVersion 2 is a major upgrade for our project. We connected with Michael at maskau.dk and started to learn some real things about working with these gas sensors. Michael's page on electronic noses is fascinating, and he's able to get some incredibly impressive, clean data from his setup. Data like this:
![]()
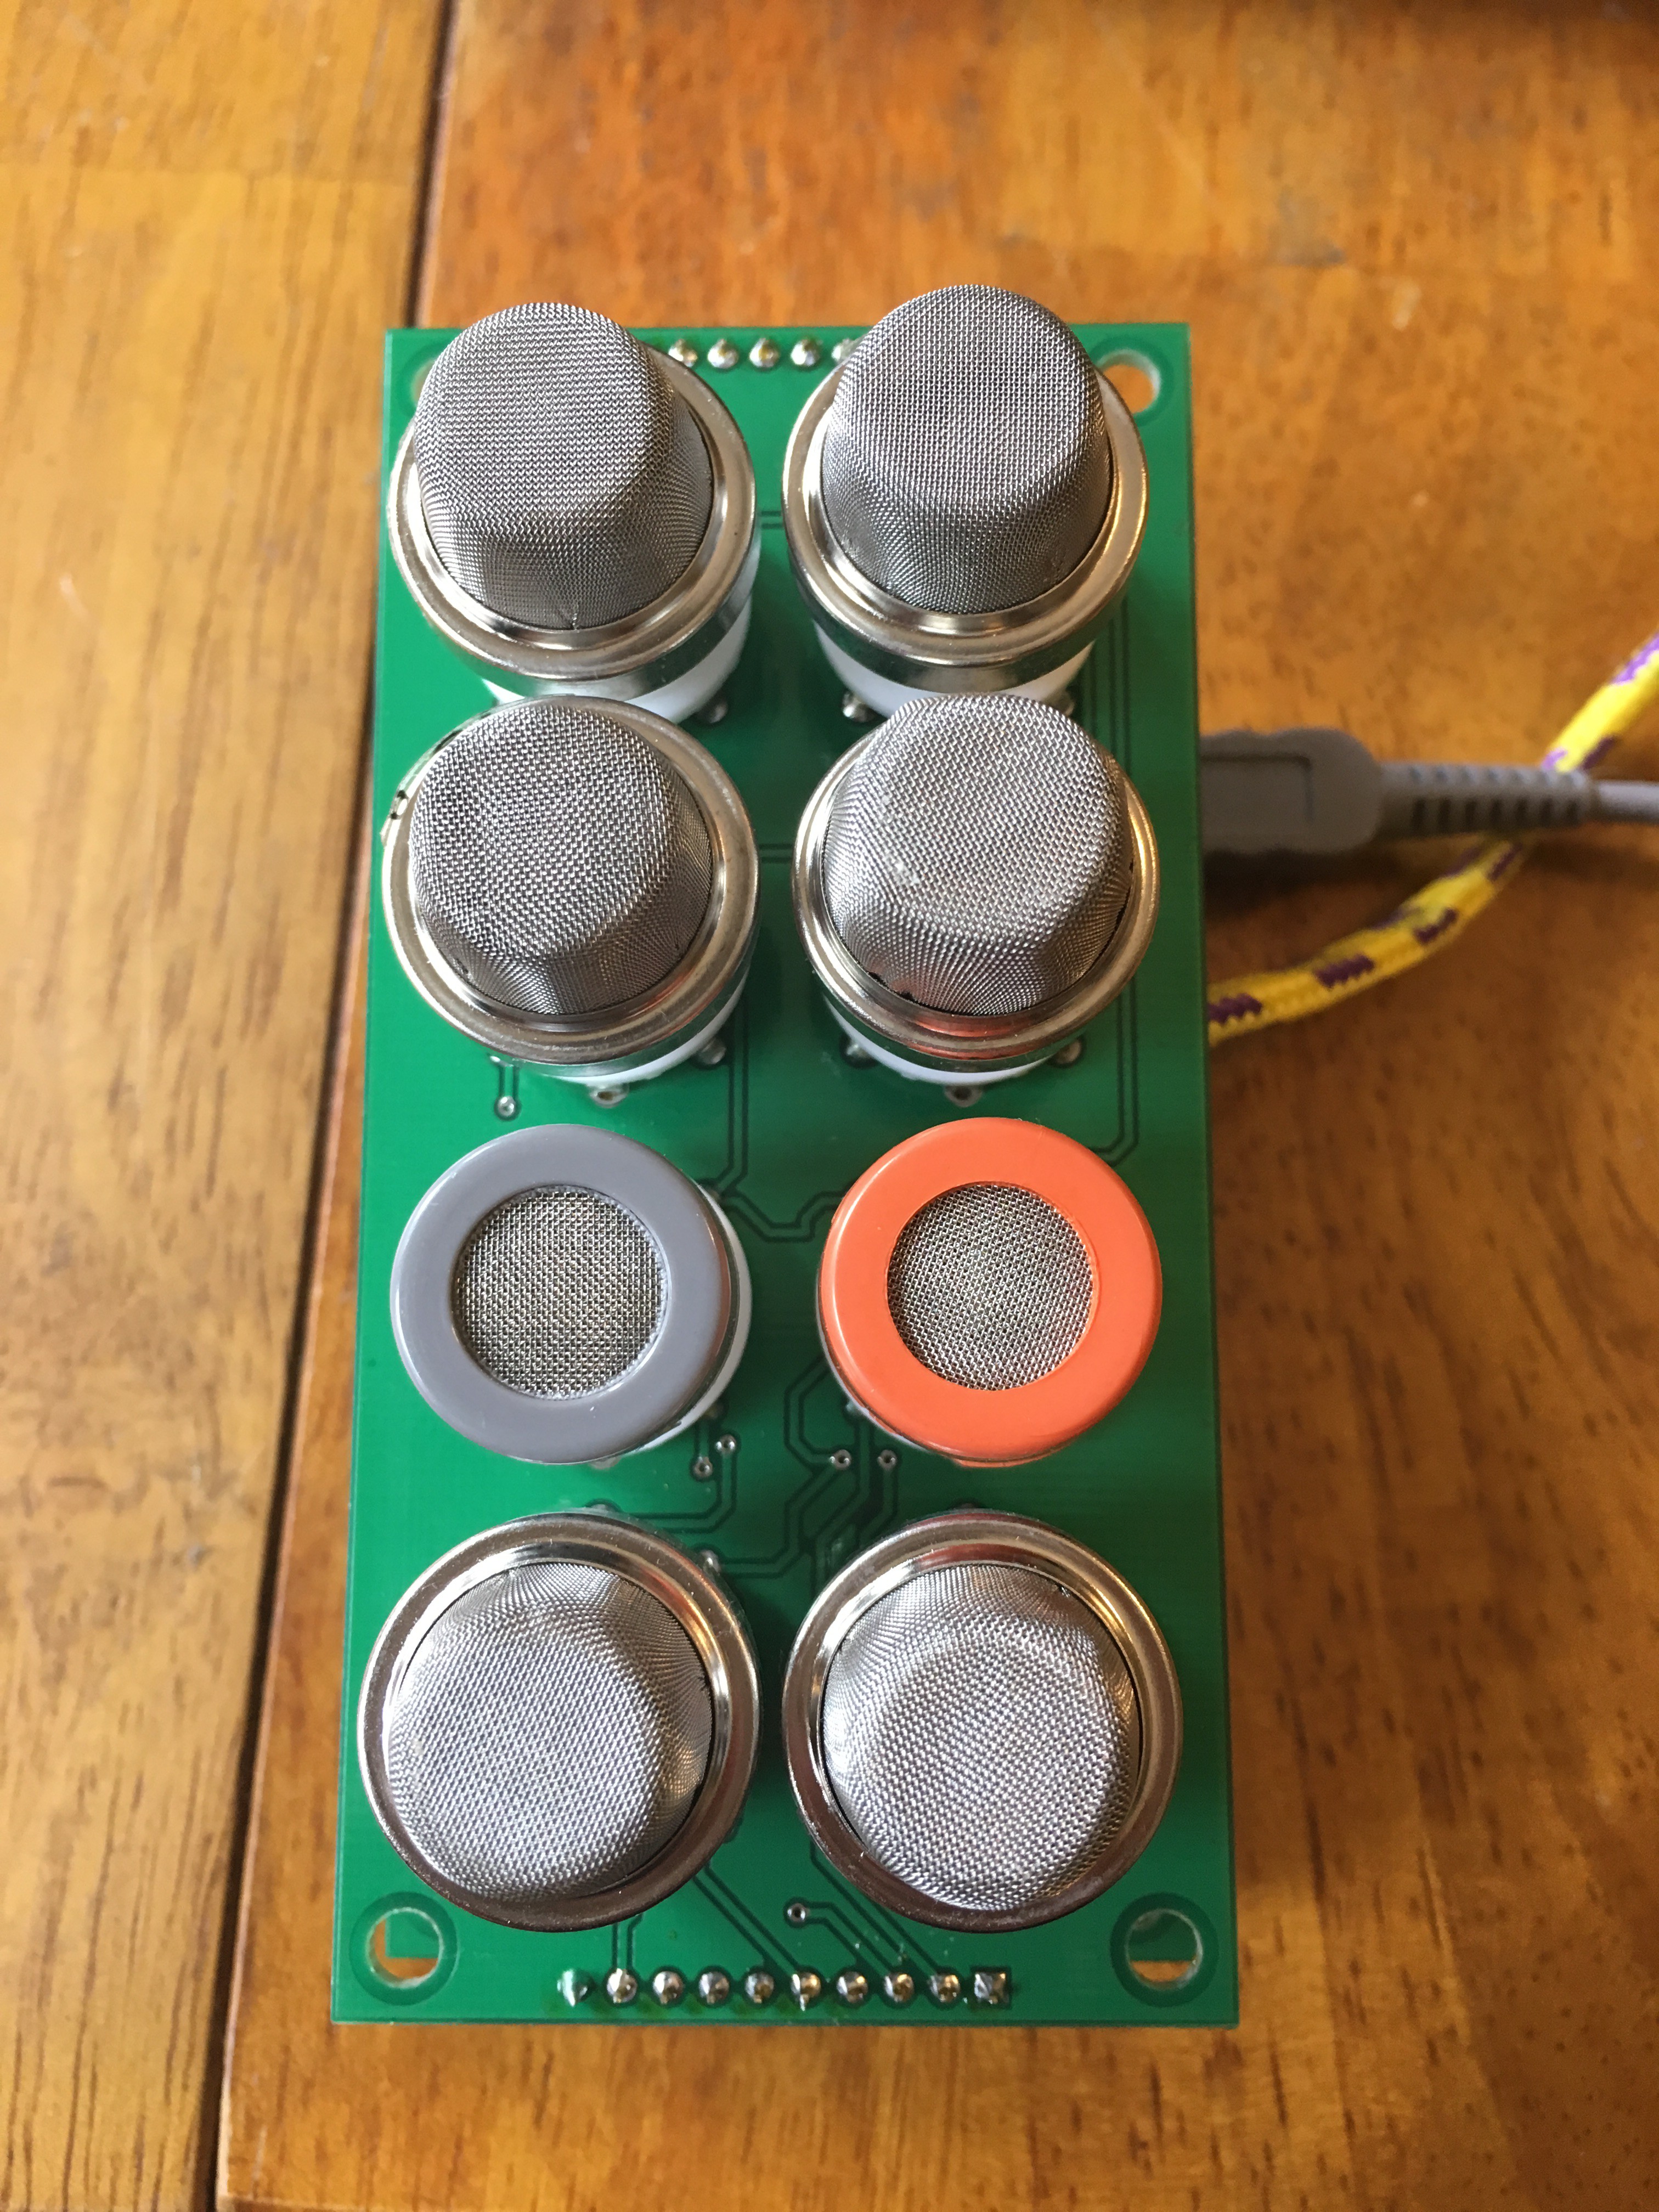
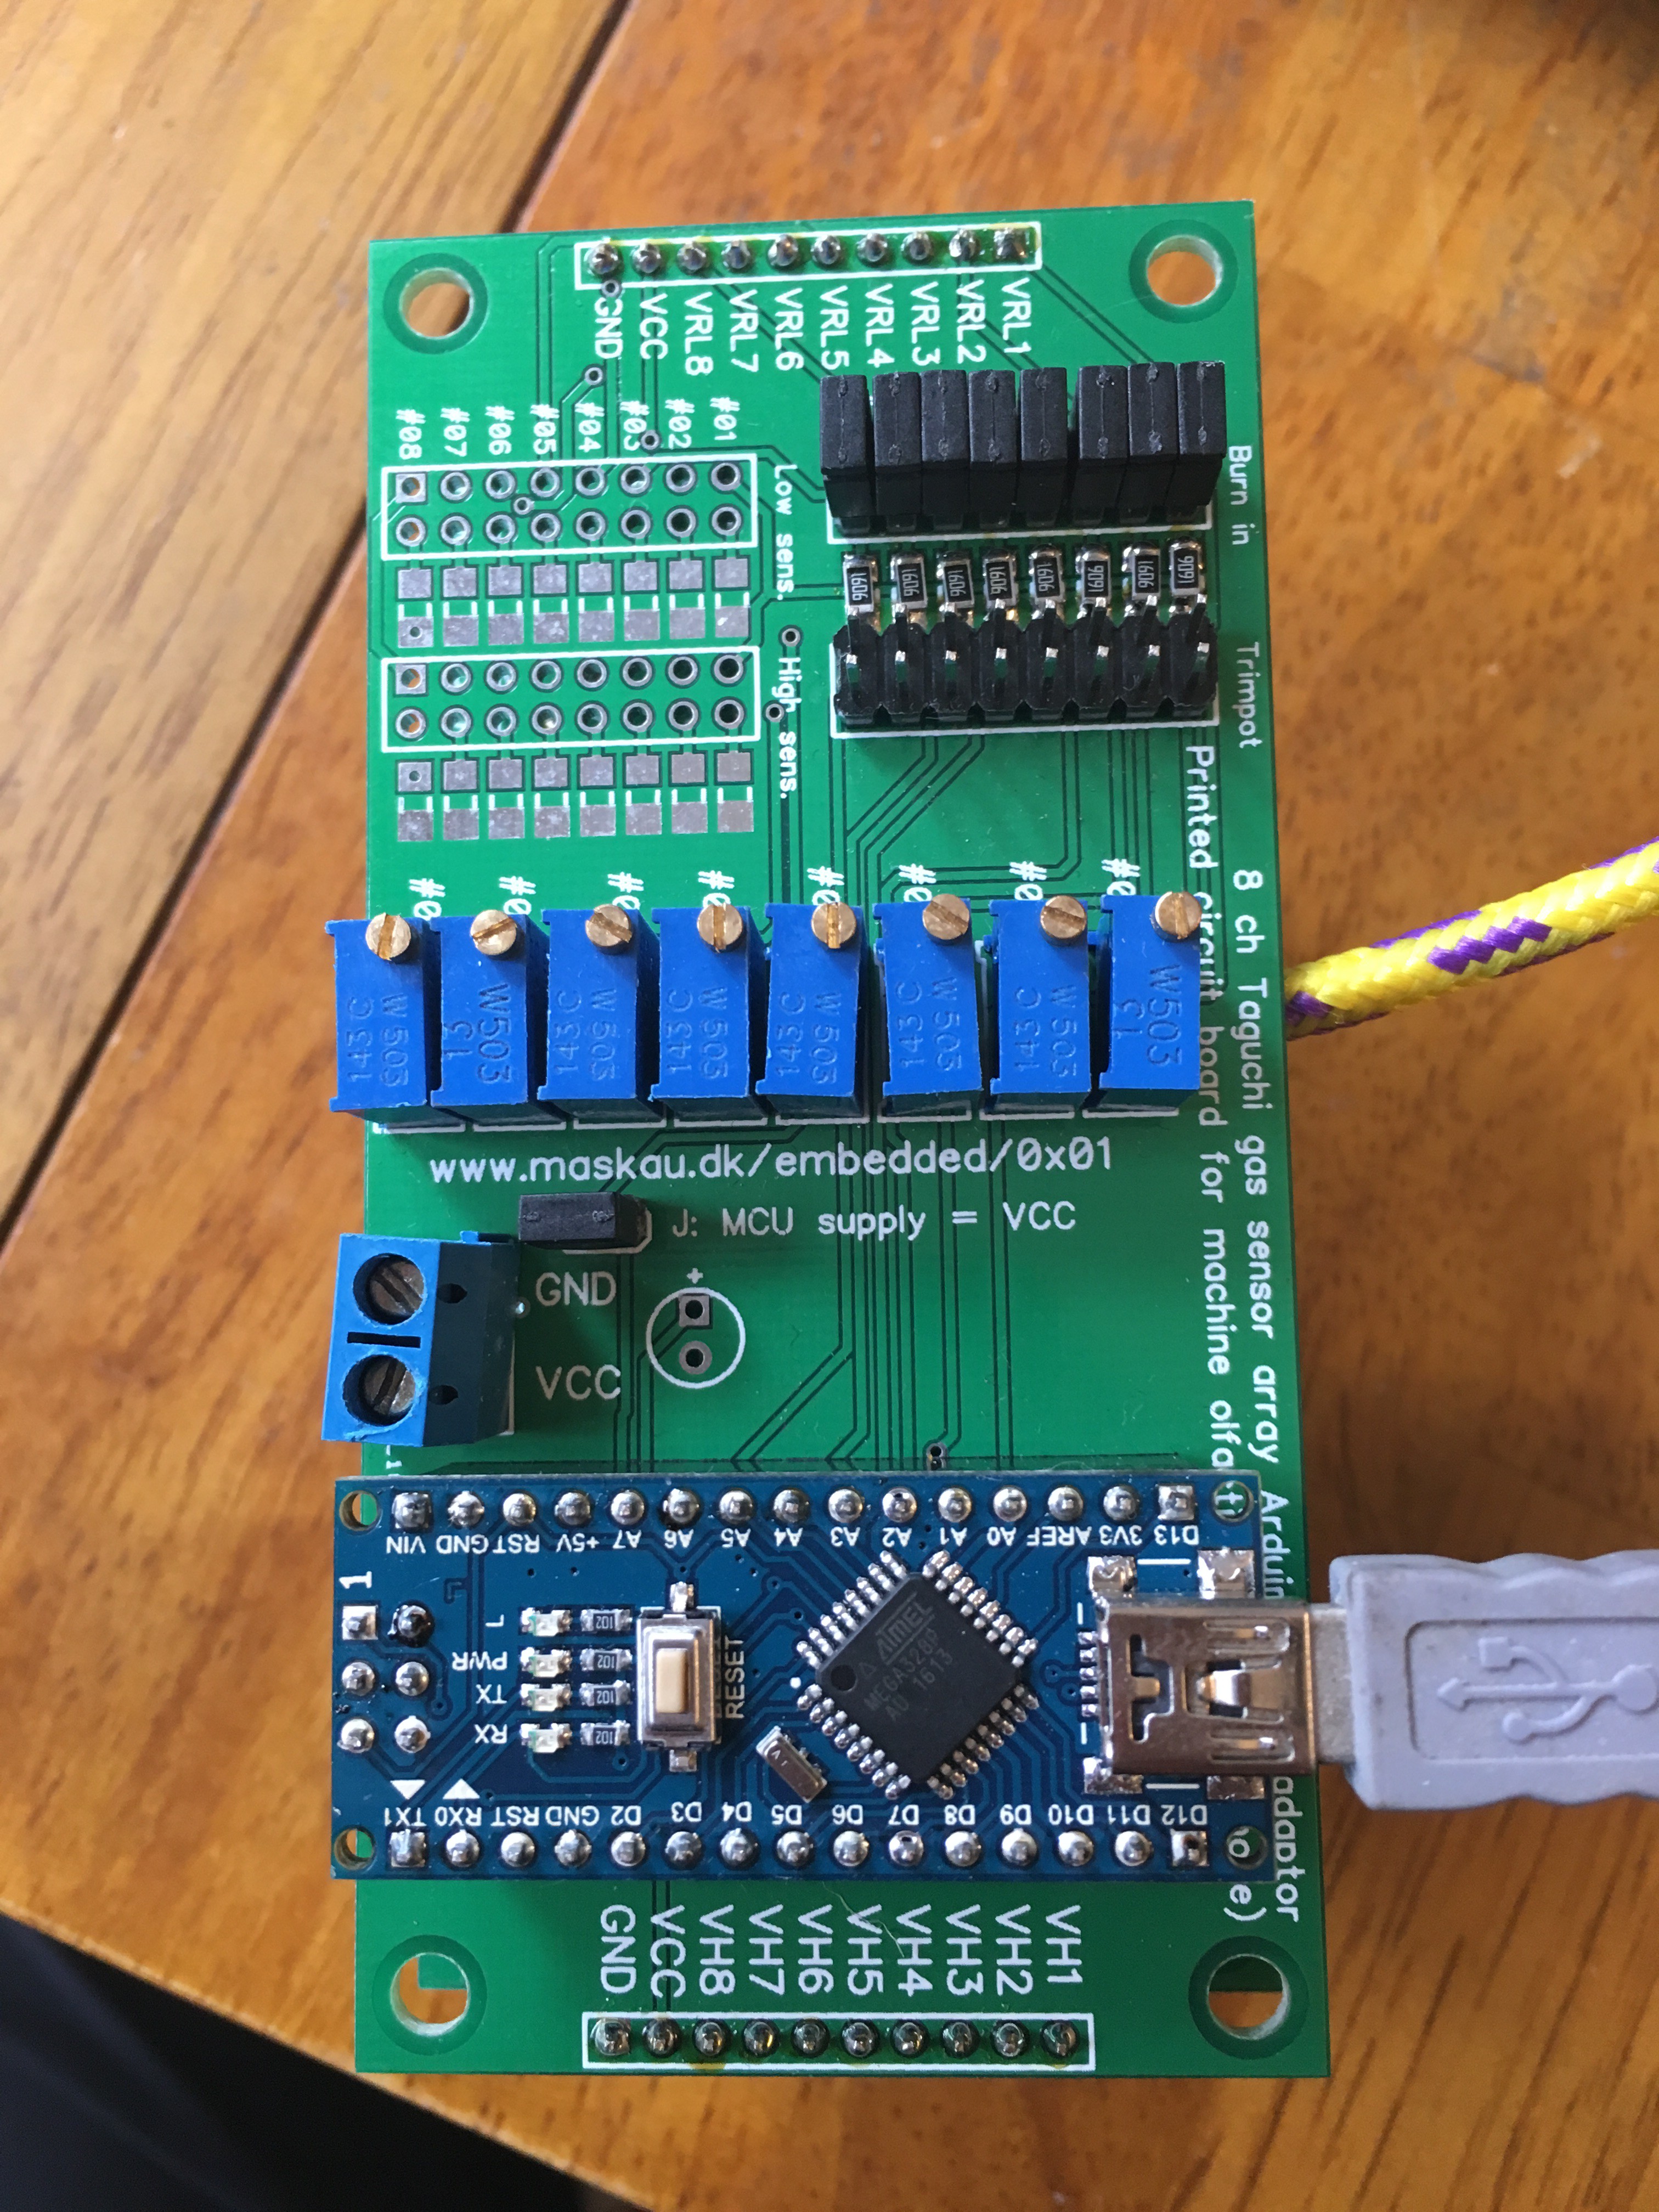
Michael has built some really cool custom PCBs and sensing chambers for his gas sensor setup, and we were able to obtain two 8-sensor arrays for our experimental use:
![]()
![]()
The 8-sensor array consists of two boards: 1 PCB with just 8 gas sensor sockets and a separate board with a dedicated power connection, potentiometers for each sensor and headers for plugging in an Arduino nano. It's pretty perfect. No wiring or soldering to be done, and you just need to write an Arduino sketch to read A0-A7 at your desired interval.
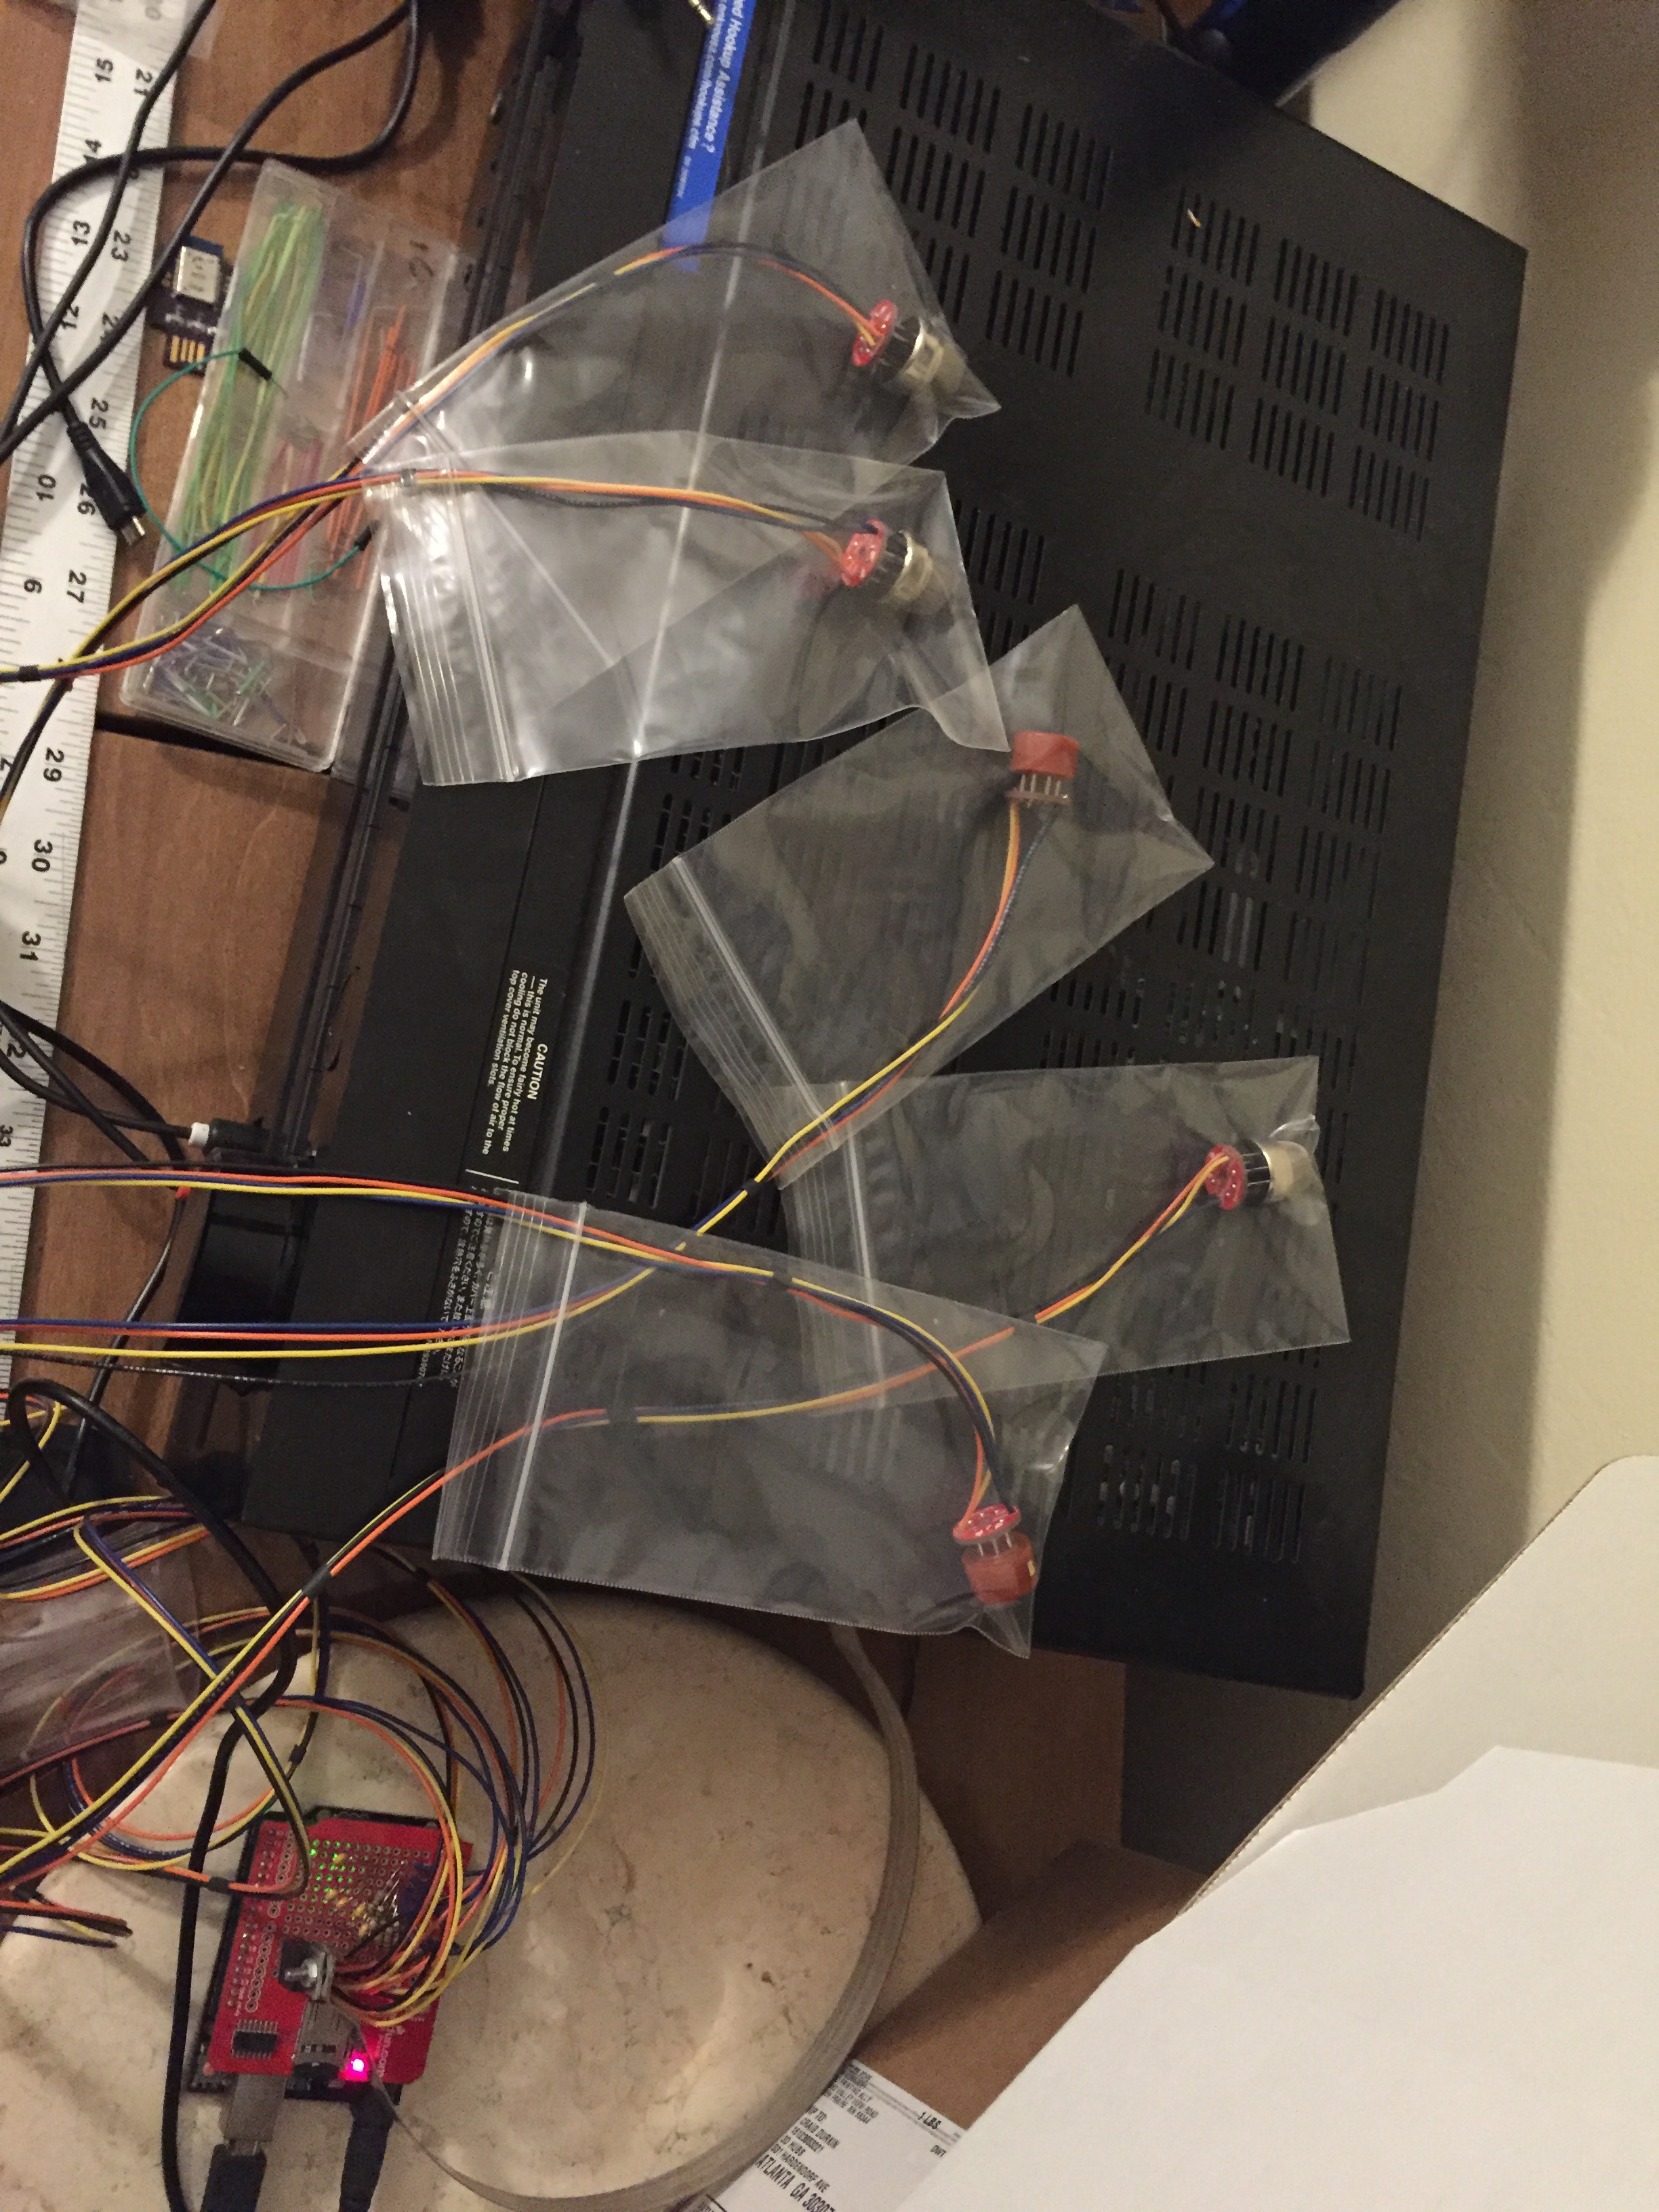
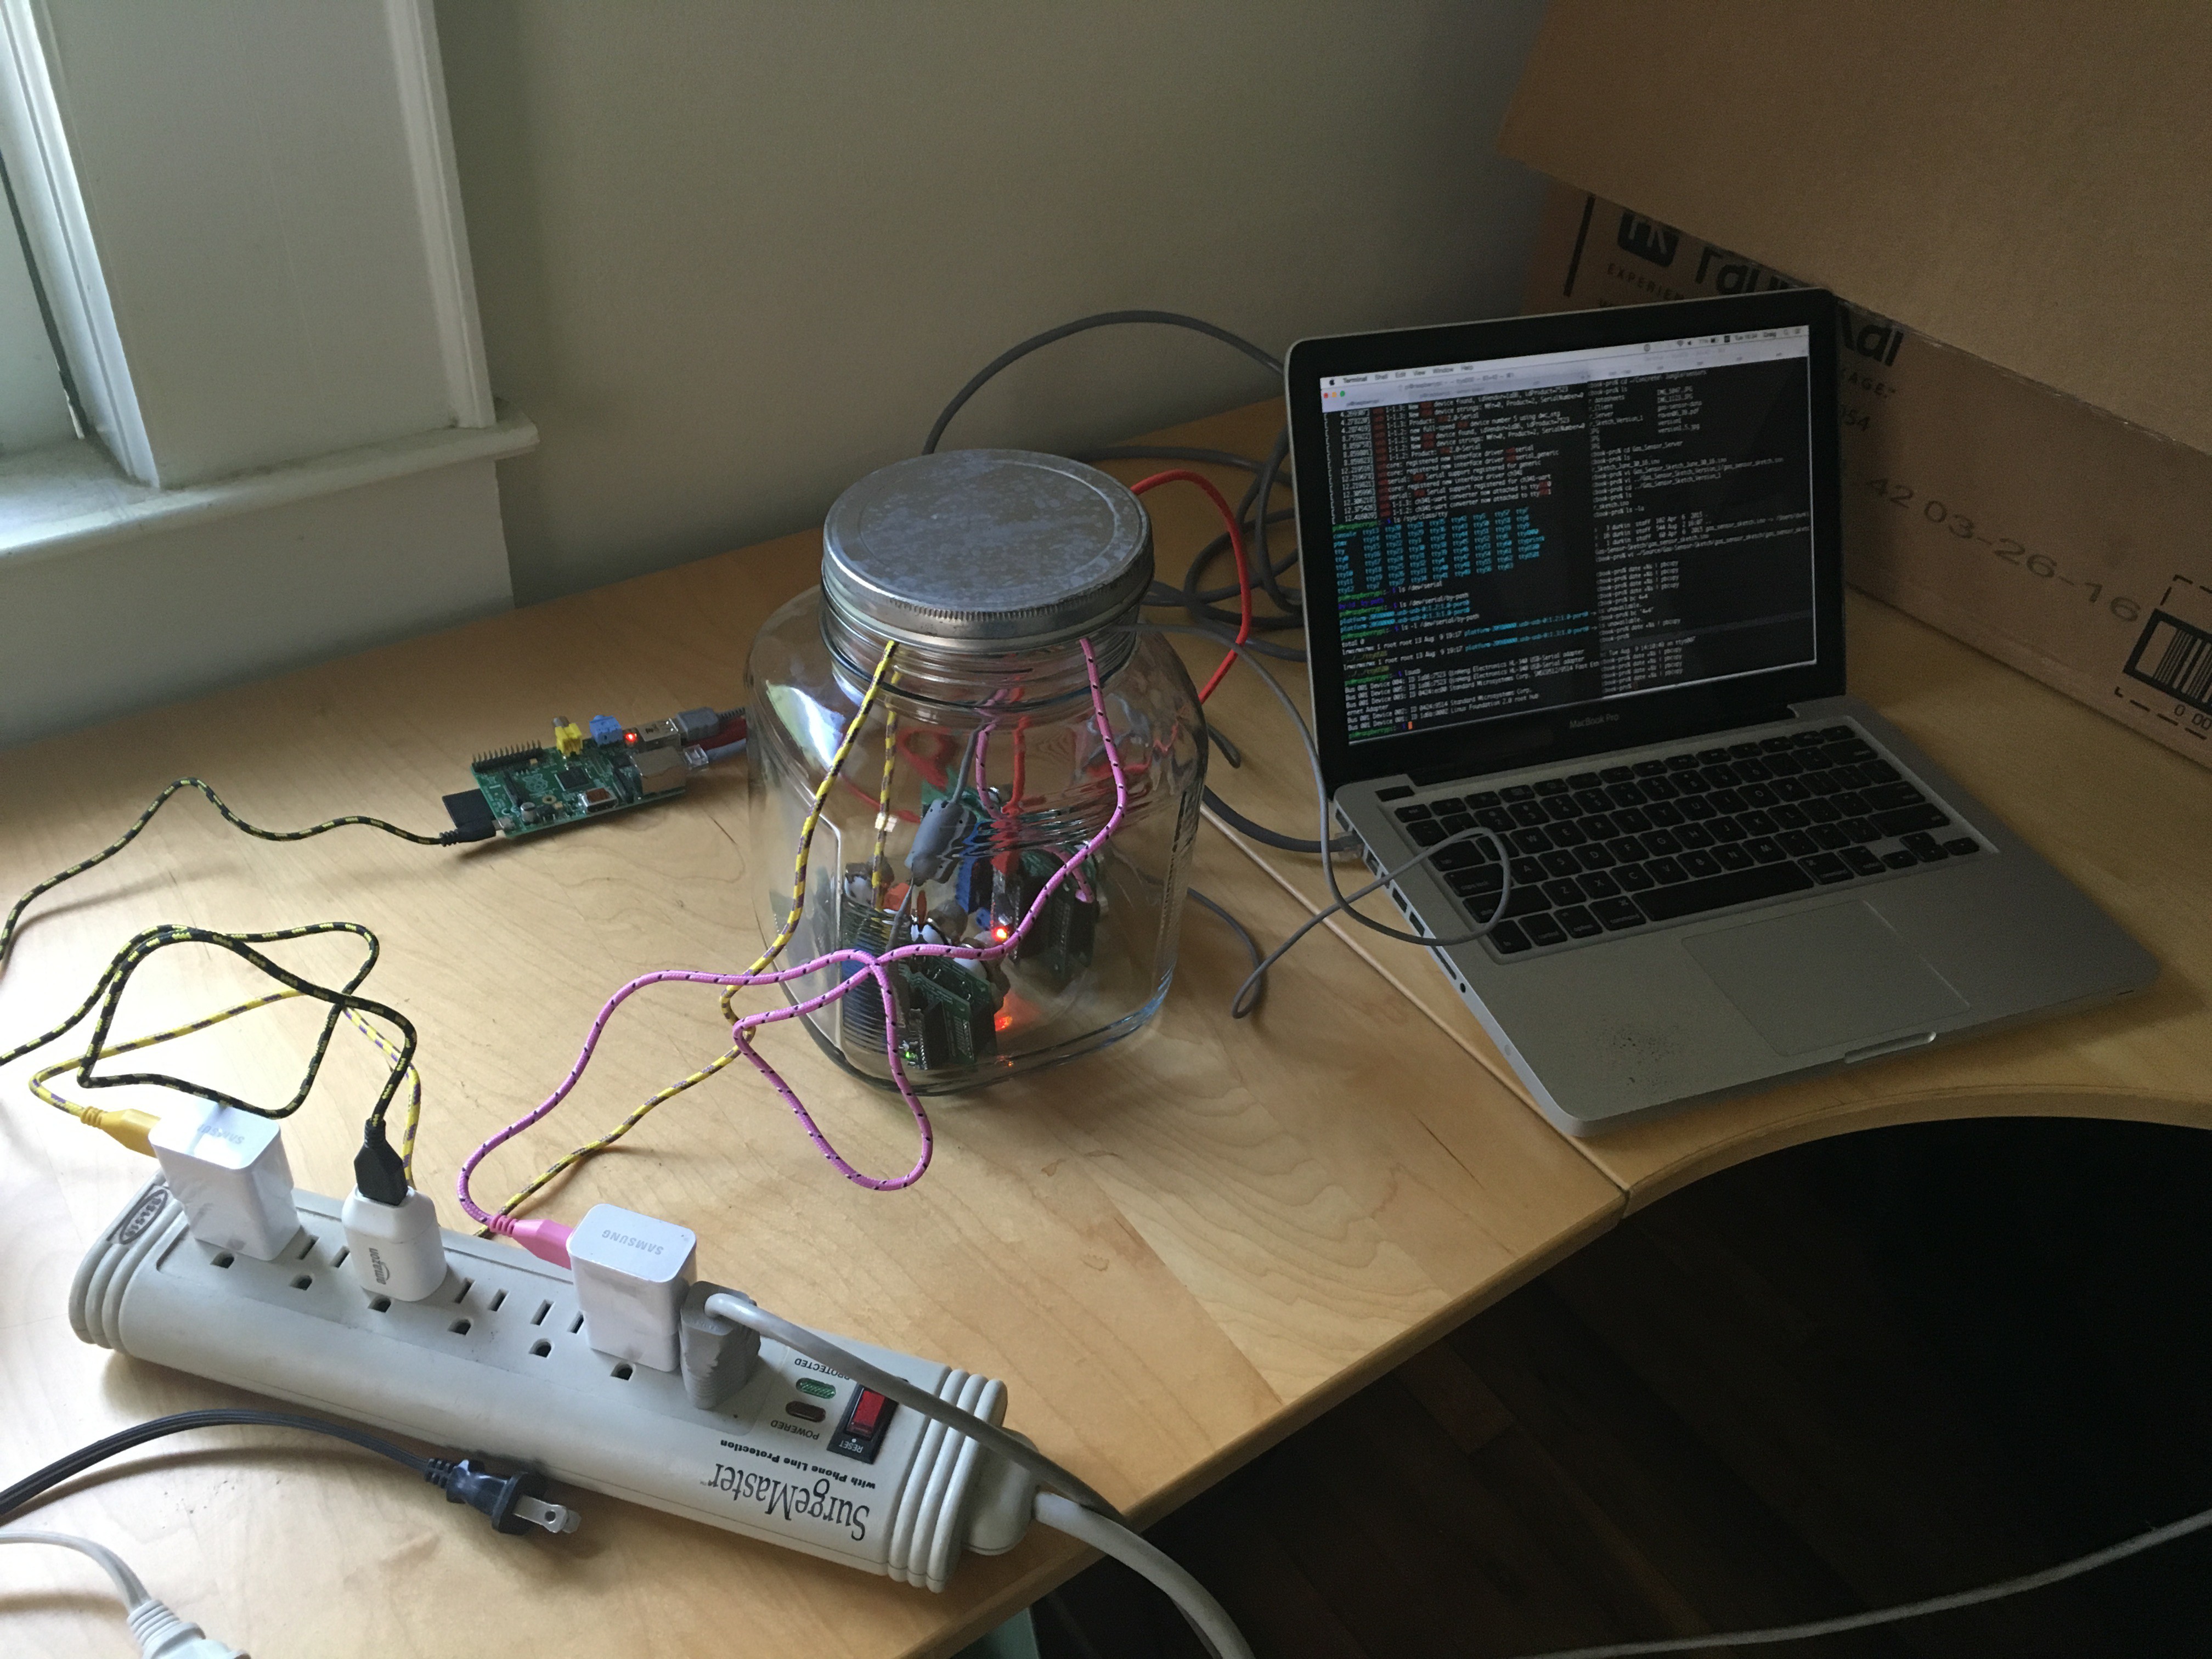
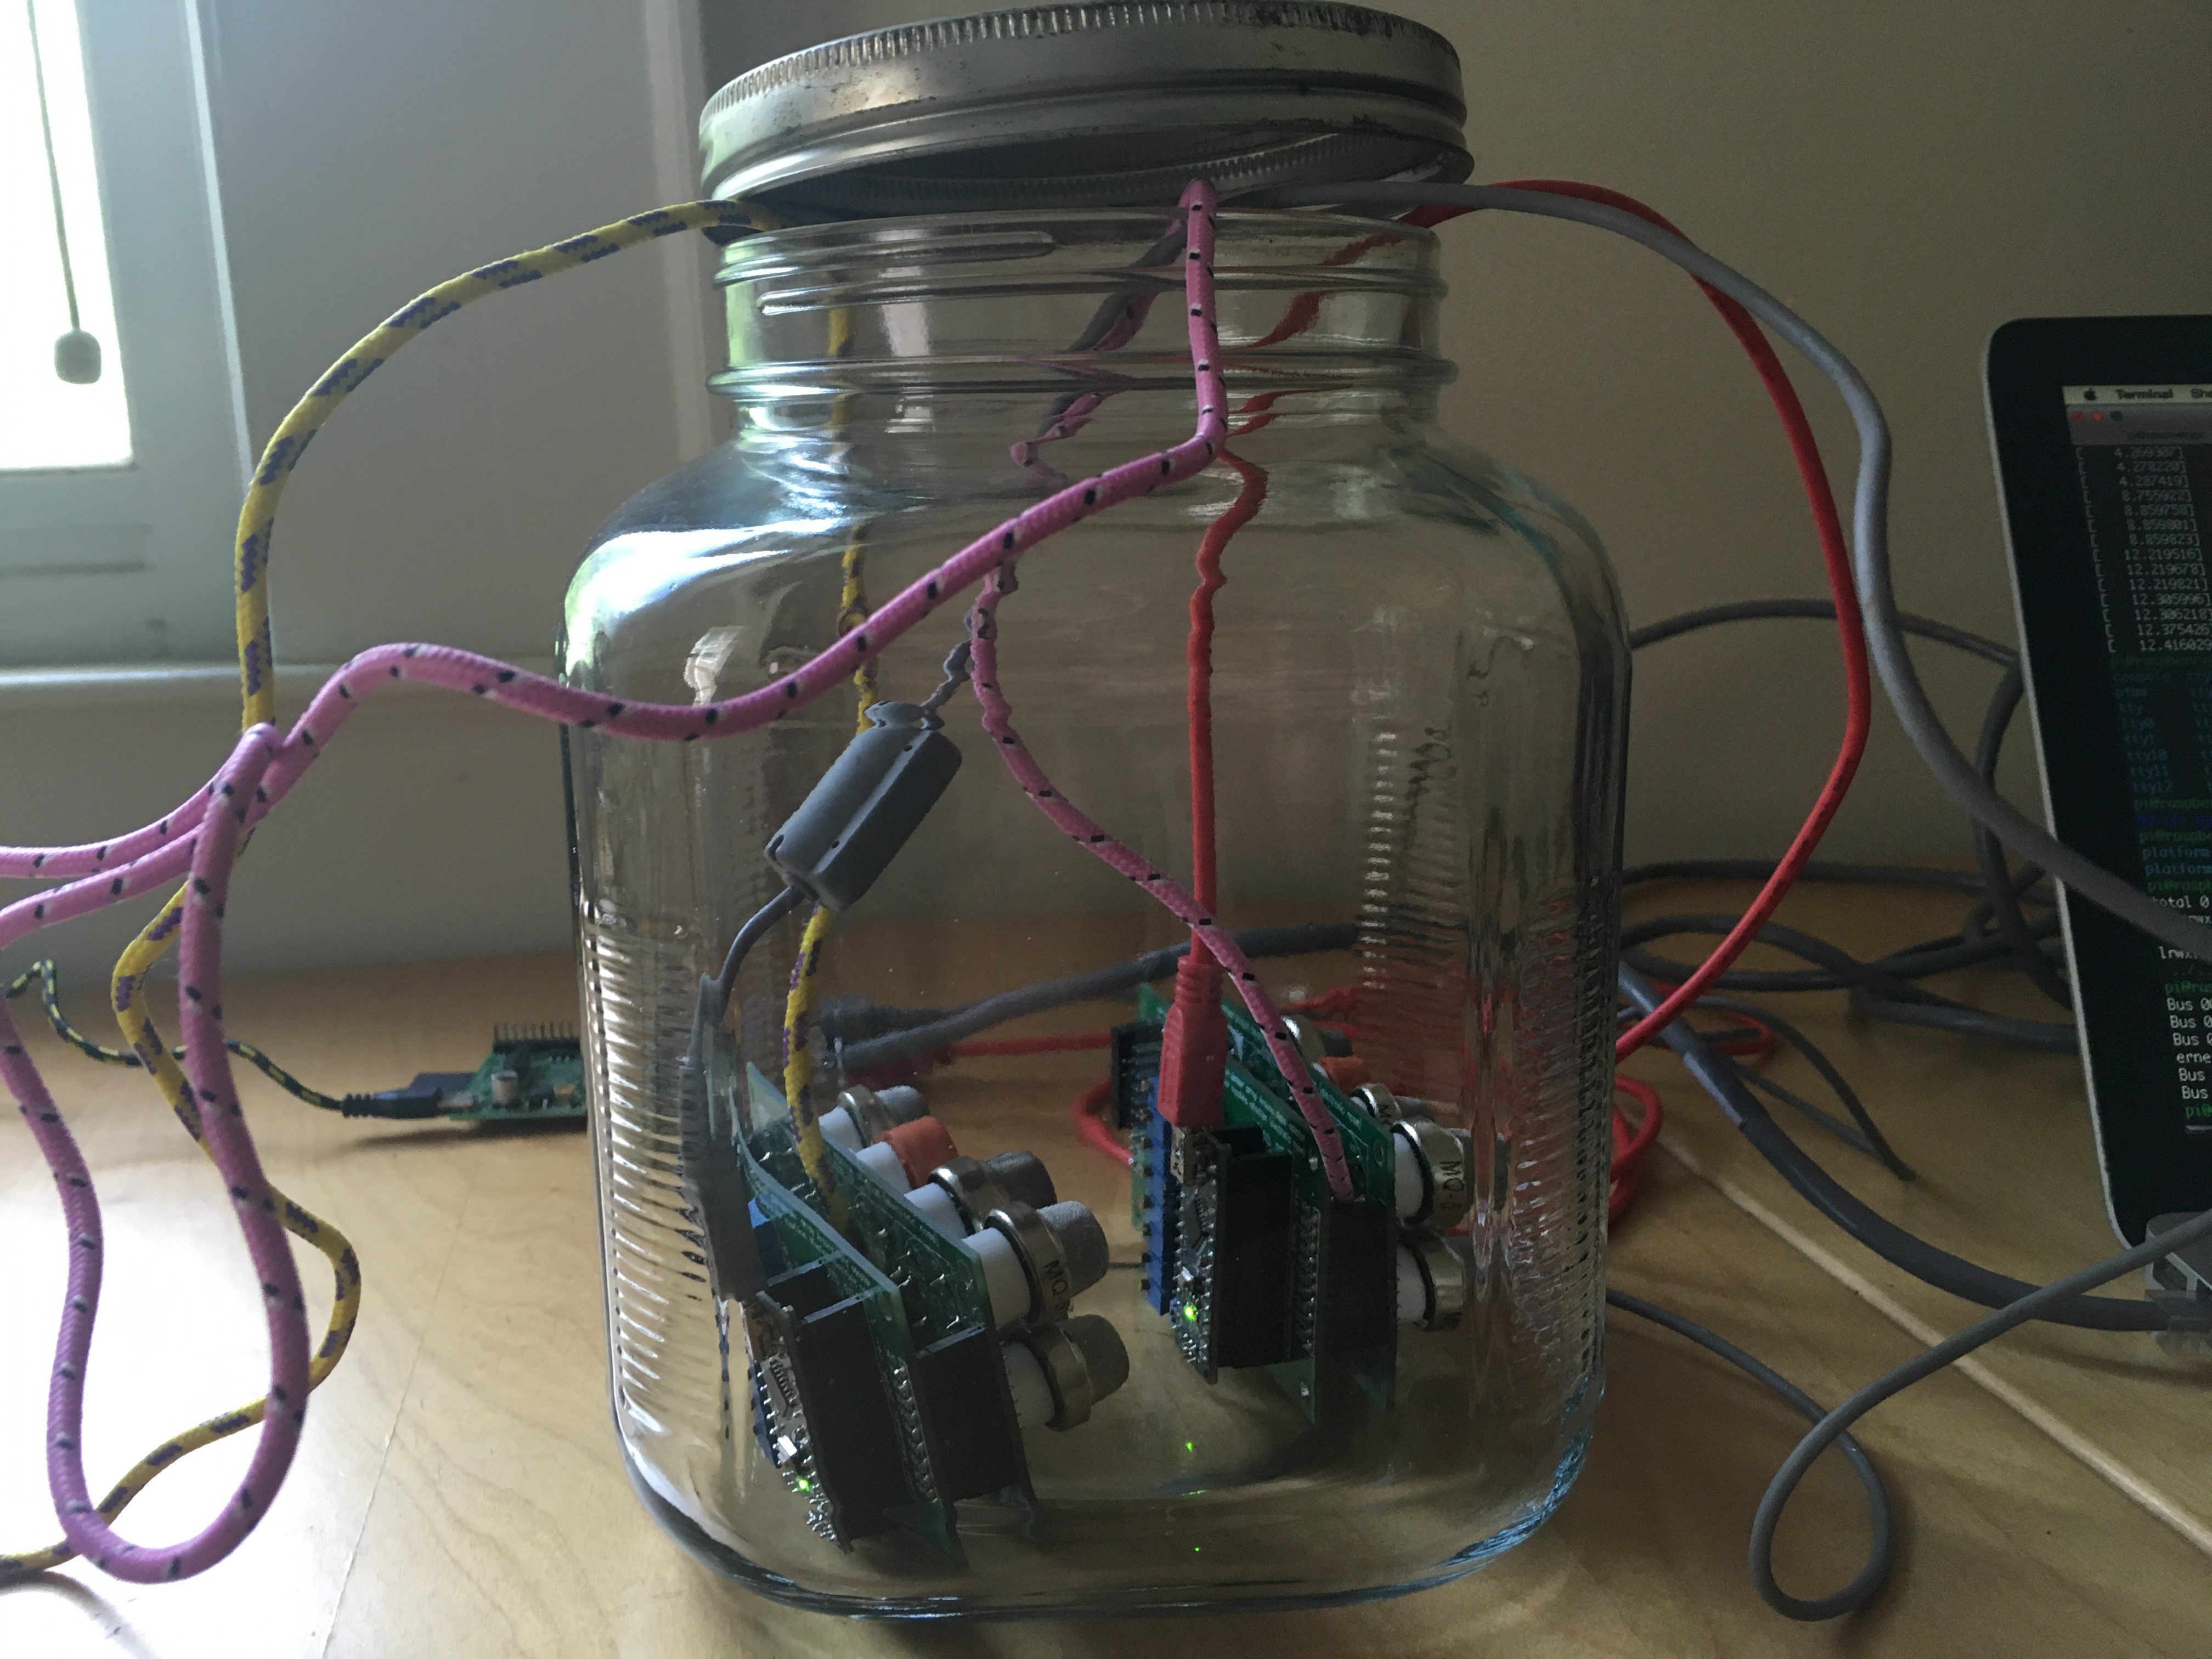
Our goal is to get clean, repeatable data. The first step in doing that is getting the sensors to settle down. There's a 48-hour minimum bake-out period to work out whatever crap is left on the sensors from the factory. You just energize the sensors and let them run for 2 days. Here's our bake-out setup:
![]()
![]()
The setup is two arrays of 8-sensor setups. Pink and yellow cables in the photos are connected to Samsung 2A USB (5V) chargers and those are powering the whole sensor setup. The gray and red cables are connected to a Raspberry Pi that logs the data. The Arduino Nano on each sensor setup is simply printing the sensor outputs to the serial port every 30 seconds:
20:21:36 9 8 2016: A0: 488, A1: 544, A2: 481, A3: 348, A4: 342, A5: 346, A6: 357, A7: 349
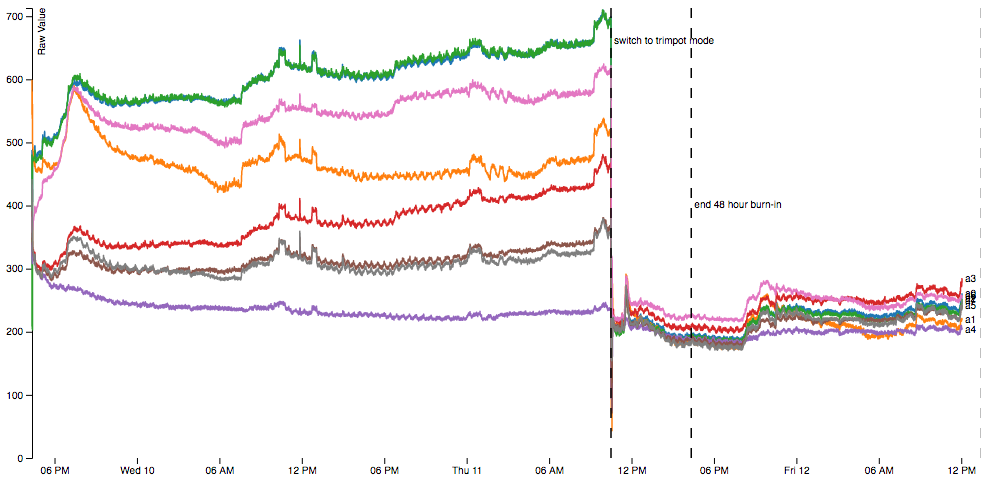
The Raspberry Pi logs this data just by connecting to the serial port and saving the output. Something like:screen -L /dev/ttyS0Results from burn-out of one of the arrays is below:
![]()
Burn-in seemed to progress somewhat as expected. The sensors drift a fair amount at first, settle down, and then I tuned them all to the same baseline using the potentiometers. They then start to creep away from each other, but as I later learned, this was not an ideal setup for doing burn-in, so that's okay.
Additionally, compared to Michael's data, each sensor is quite noisy. To reduce the noise, I tried a bunch of different things:
- Moving the Raspberry Pi to a USB battery to see if its power draw was affecting the circuit (it did not)
- Moving the sensor array to battery power to test a different power supply (different but still bad).
- Moving a sensor array to a benchtop CV/CC supply to test another power supply (not that different).
- Reading 1 sample every second and printing the average of it every 30 seconds rather than reading one sample every 30 seconds (not much different).
- Removing 7 sensors from an array to see if they were causing noise in each other (slightly better).
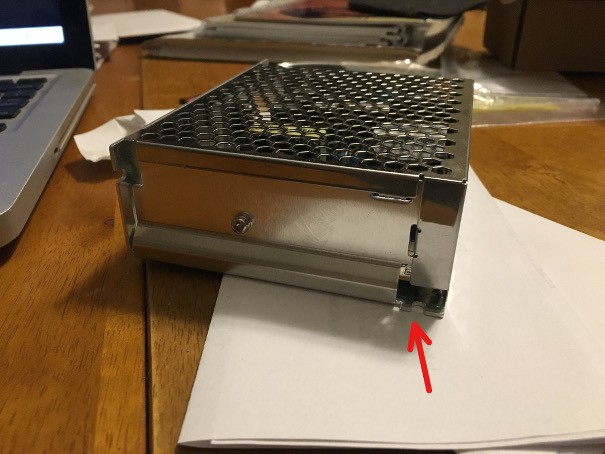
- Switching to a dedicated 5V, 12A supply (LS75-5, $25 from Mouser)
The dedicated LS75-5 had a tremendous effect on sensor noise and cleared things up immediately. That, and capping the jar/sensor chamber with tight-fitting aluminum foil really helped stabilize the sensors:
![]()
![]()
Up next...testing actual fruit!
-
Version 1.5 (July 2016)
10/31/2016 at 03:25 • 0 comments![]()
Version 1.5
Moving on from version 1, I wanted to try to address the noise issue and add sensor sensitivity adjustment. Having all the sensors be in the MicroSD shield prototyping space was not really fun to work with either.
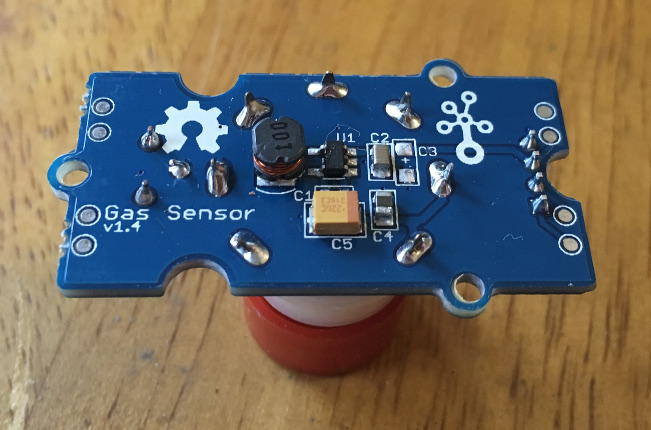
So version 1.5 was trying to move our gas sensors over to the Seeedstudio Grove system for doing environmental monitoring. Everything gets a four-pin connector, and you can buy gas sensors with Grove connectors and potentiometers already on them. It sounds perfect if it works. (Spoiler alert: it doesn't)
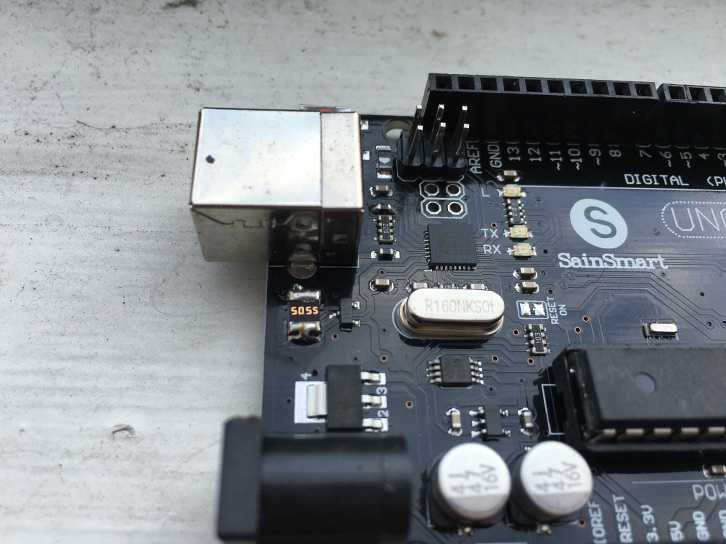
The biggest problem you face with trying to run lots these gas sensors in an Arduino environment is that each sensor draws about 150mA. Trying to run 8 of them means you're drawing about 1.2A at 5V, or using 6W of power. Arduinos are just not built for that. If you're powering the Arduino with something greater than 5V, its onboard regulator (NCP1117ST50T3G) is rated for 1A max, and will likely run very hot for currents that are a significant fraction of that.
But we also live in an age of ubiquitous, cheap, high-power 5V USB power supplies, so you could potentially power the sensors over USB and bypass the regulator. This is the route I chose, but it has its own wrinkle: the Arduino UNO has a PTC resettable fuse that can sustain 500mA and will definitely trip at 1A, but has kind of undefined behavior between 500mA and 1A.
My solution here was to split the sensors up between two Arduinos so that each would need only 600mA per Arduino. I then soldered an additional PTC atop the existing PTC so that we'd have 2 500mA fuses in parallel, which seems like it'd give 1A of current flow.
![]()
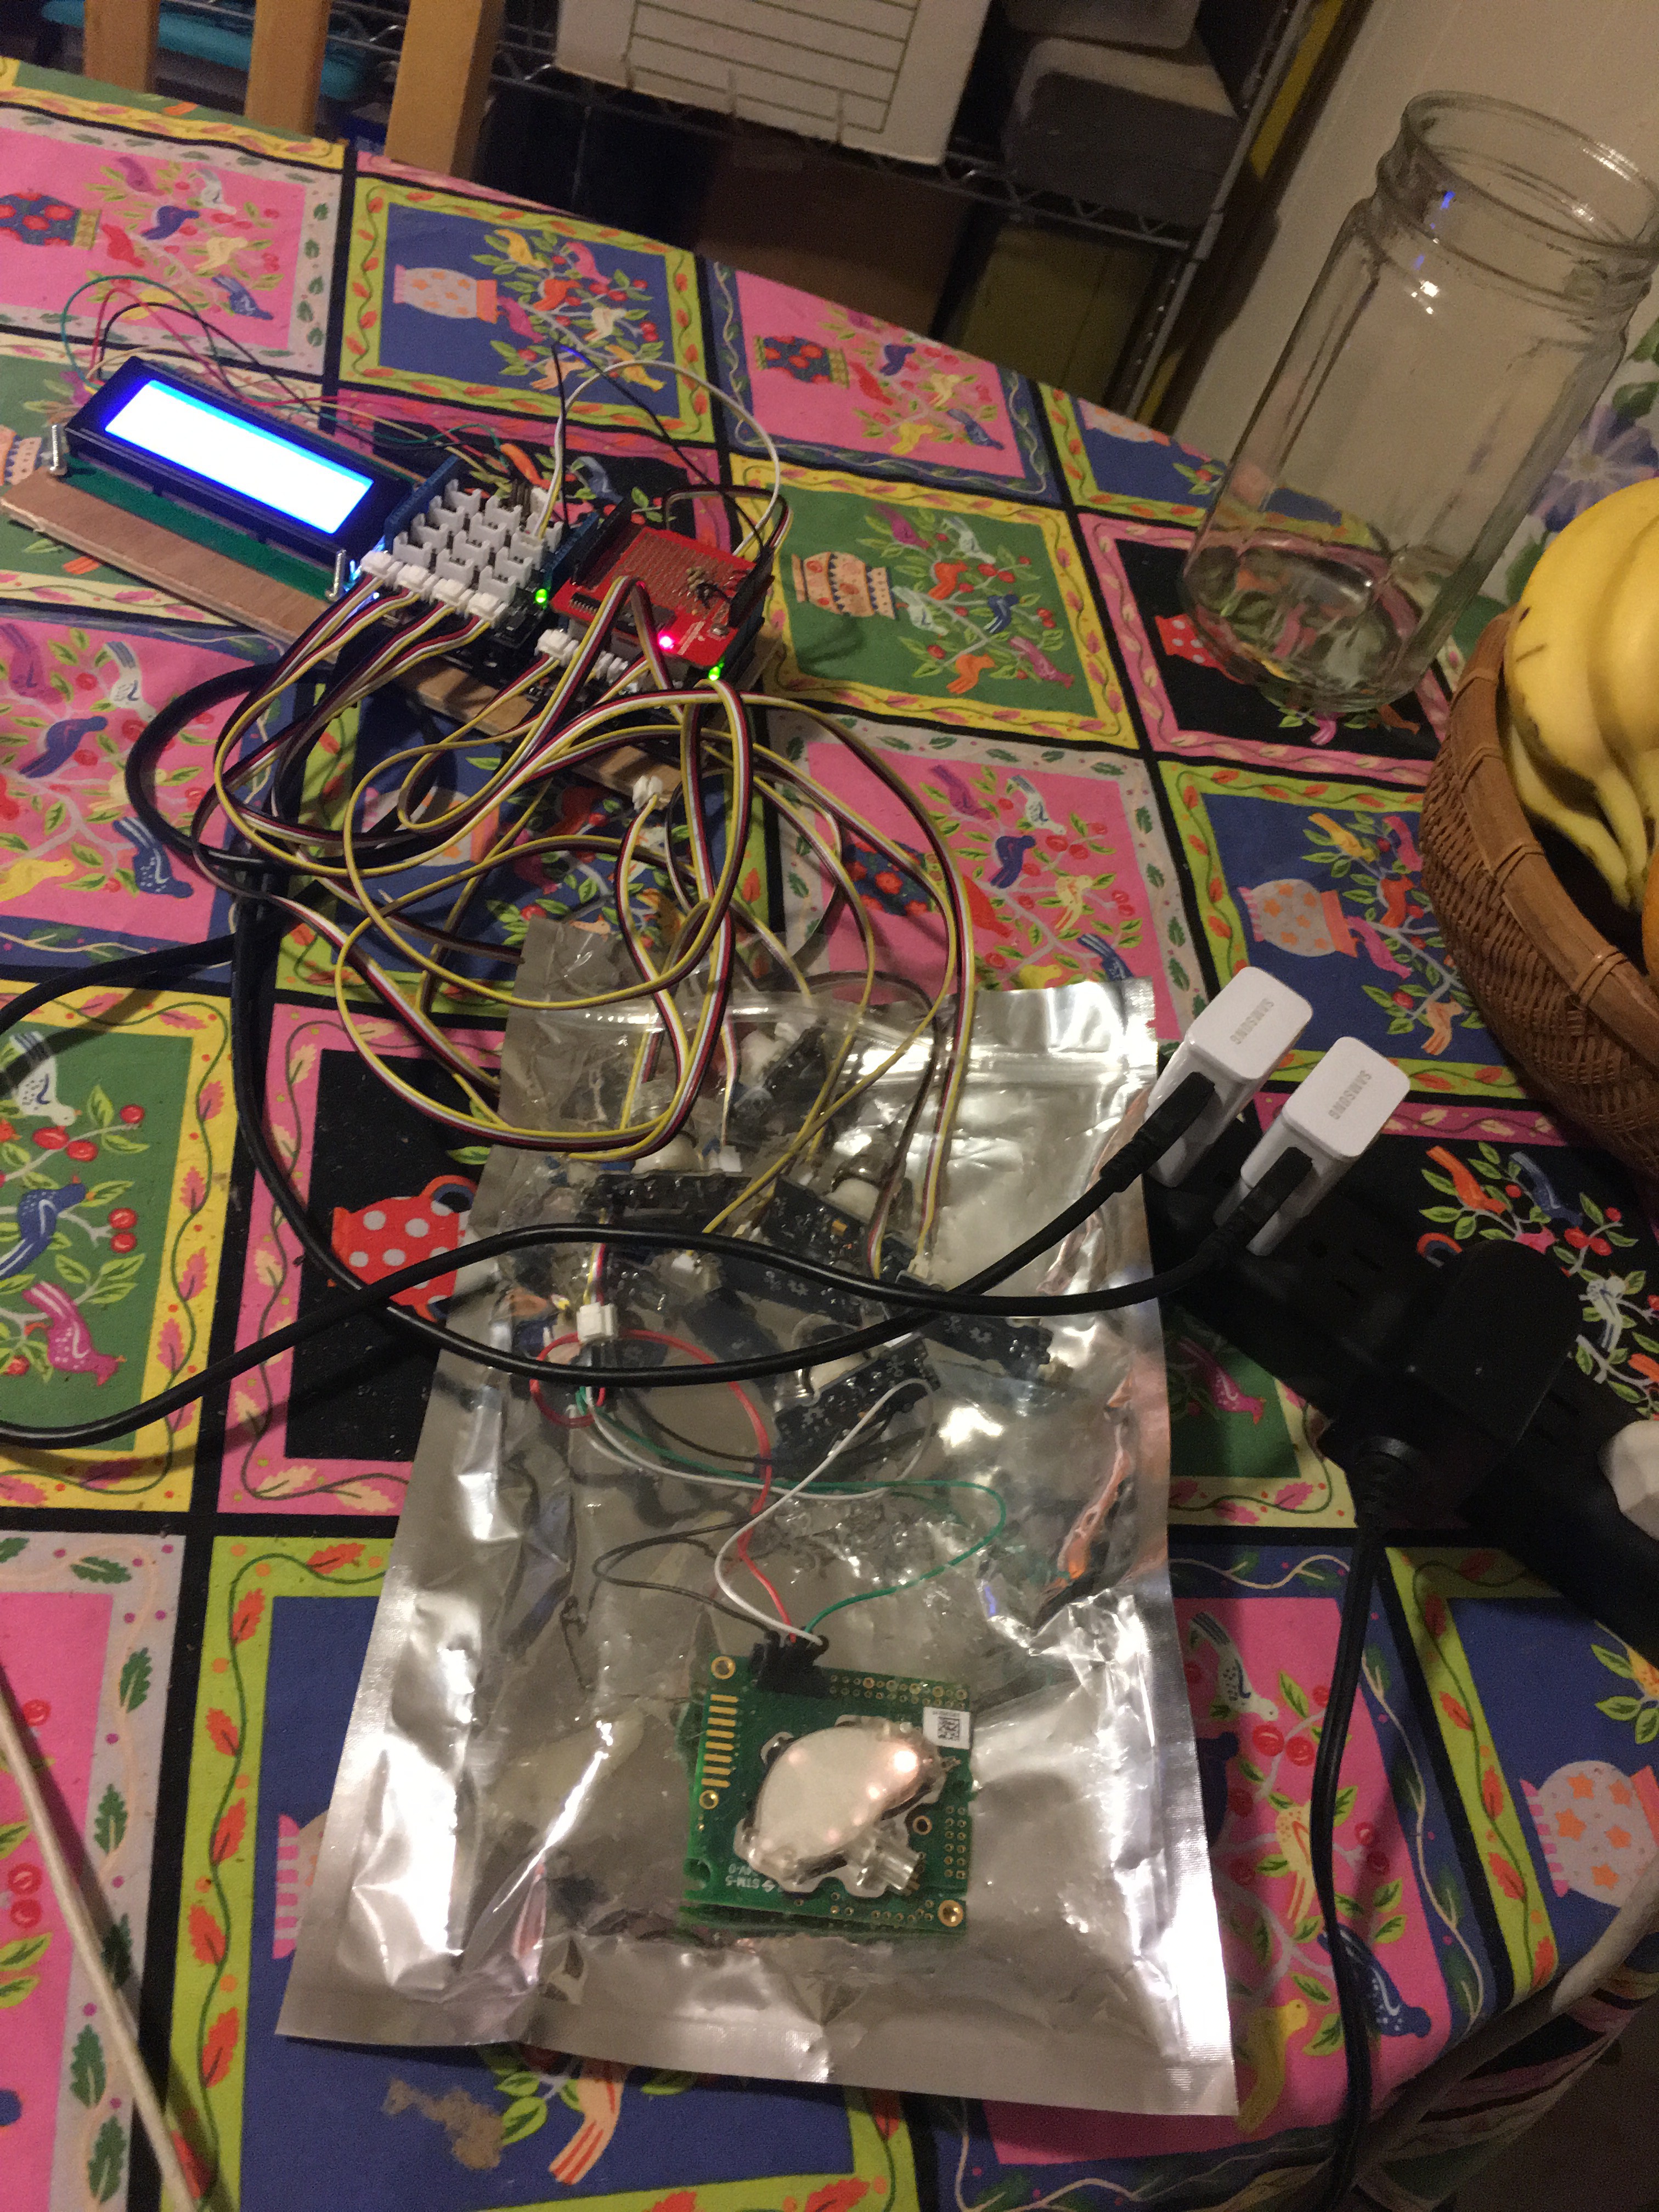
With this in place, I wrote some code to let the Arduinos establish a client-host relationship over I2C so that the client sensor values could be saved on the host's SD card. I also added an I2C display so I could monitor the sensor values, and then threw all the sensors in a sealed bag to see what they'd do.
![]()
![]()
Not bad. Seeedstudio also had some extra sensors that Sparkfun didn't, so I was able to add in a formaldehyde sensor, air quality sensor and CO2 sensor. I was having trouble getting much of a reading out of the MQ2 and MQ3 sensors, but things were generally working and I could start trying to calibrate things. Unfortunately, things couldn't even get to the point of testing.
When setting up this system I noticed that a certain sensor would short out the Arduino every time I plugged it in. This would happen even if I removed the actual gas sensor from the socket, so it was a problem in the breakout board circuitry itself. There’s not much to that circuitry except for a few capacitors, an inductor and an IC. That IC (only labeled in the EAGLE part info) is an ETA1036 step-up voltage converter. The datasheet is super short but it makes one thing clear: max input voltage of 4.5V. This means don’t recommend people connect 5V to it on your wiki.![]() During the course of figuring this out I managed to cause another sensor to short out the Arduino, and it seemed like a matter of time before all the sensors would fail.
During the course of figuring this out I managed to cause another sensor to short out the Arduino, and it seemed like a matter of time before all the sensors would fail.Maybe I'm misunderstanding something with these sensors, but this is the point where I gave up on these sensors and moved on to version 2...
-
Version 1: noisy but functional (Dec 2015/Jan 2016)
10/31/2016 at 02:29 • 3 commentsWe at Concrete Jungle and Georgia Tech have been working on this project for a while, but are only now making a Hackaday project around it, so I'll catch you up on what we've done so far.
Version 1
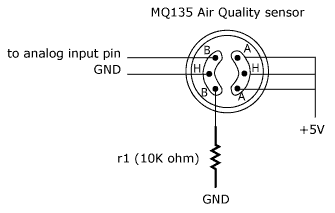
This version was an Arduino Uno, Sparkfun SD shield, and 5 gas sensors (methane, LPG, carbon monoxide, alcohol, and hydrogen). Each gas sensor was connected to the Arduino using a Sparkfun gas sensor breakout according to the instructions given at Wiring:
![]()
This is not a good way to work with these sensors. Put a potentiometer in place of the 10k resistor and you can adjust its sensitivity.
I unfortunately don't have good close-up photos of the original setup, but it is visible below:
![]()
This setup had a variety of problems and I don't recommend others repeat it except for the most basic sensing projects.
First, I wanted to establish a baseline. If you put each sensor in a separate closed plastic bags, would they settle to a reasonable value? For the most part, yes:
![]()
Things to notice:
- Alcohol sensing is probably broken in some way.
- The lines are generally flat. This is good since we just have air in the bag.
- Calibration could be a lot better. Methane hangs out in the 800’s the whole time and our maximum possible reading is 1023. This is probably a limitation of having just a 10k resistor in place of a tuneable potentiometer.
- There’s noise that gets worse across sensors. The sensors are connected to the Arduino in the order of CO (on analog input 0), H2 (on analog input 1), LPG (etc), alcohol and CH4, and our data get noisy in almost that exact order.
- Our sensors influence each other. There are many peaks and valleys in the data that overlap exactly across sensors. That does not seem likely given that each sensor is in its own separate, mostly-sealed environment.
But overall not terrible! How about on a real piece of fruit?
First Experiment
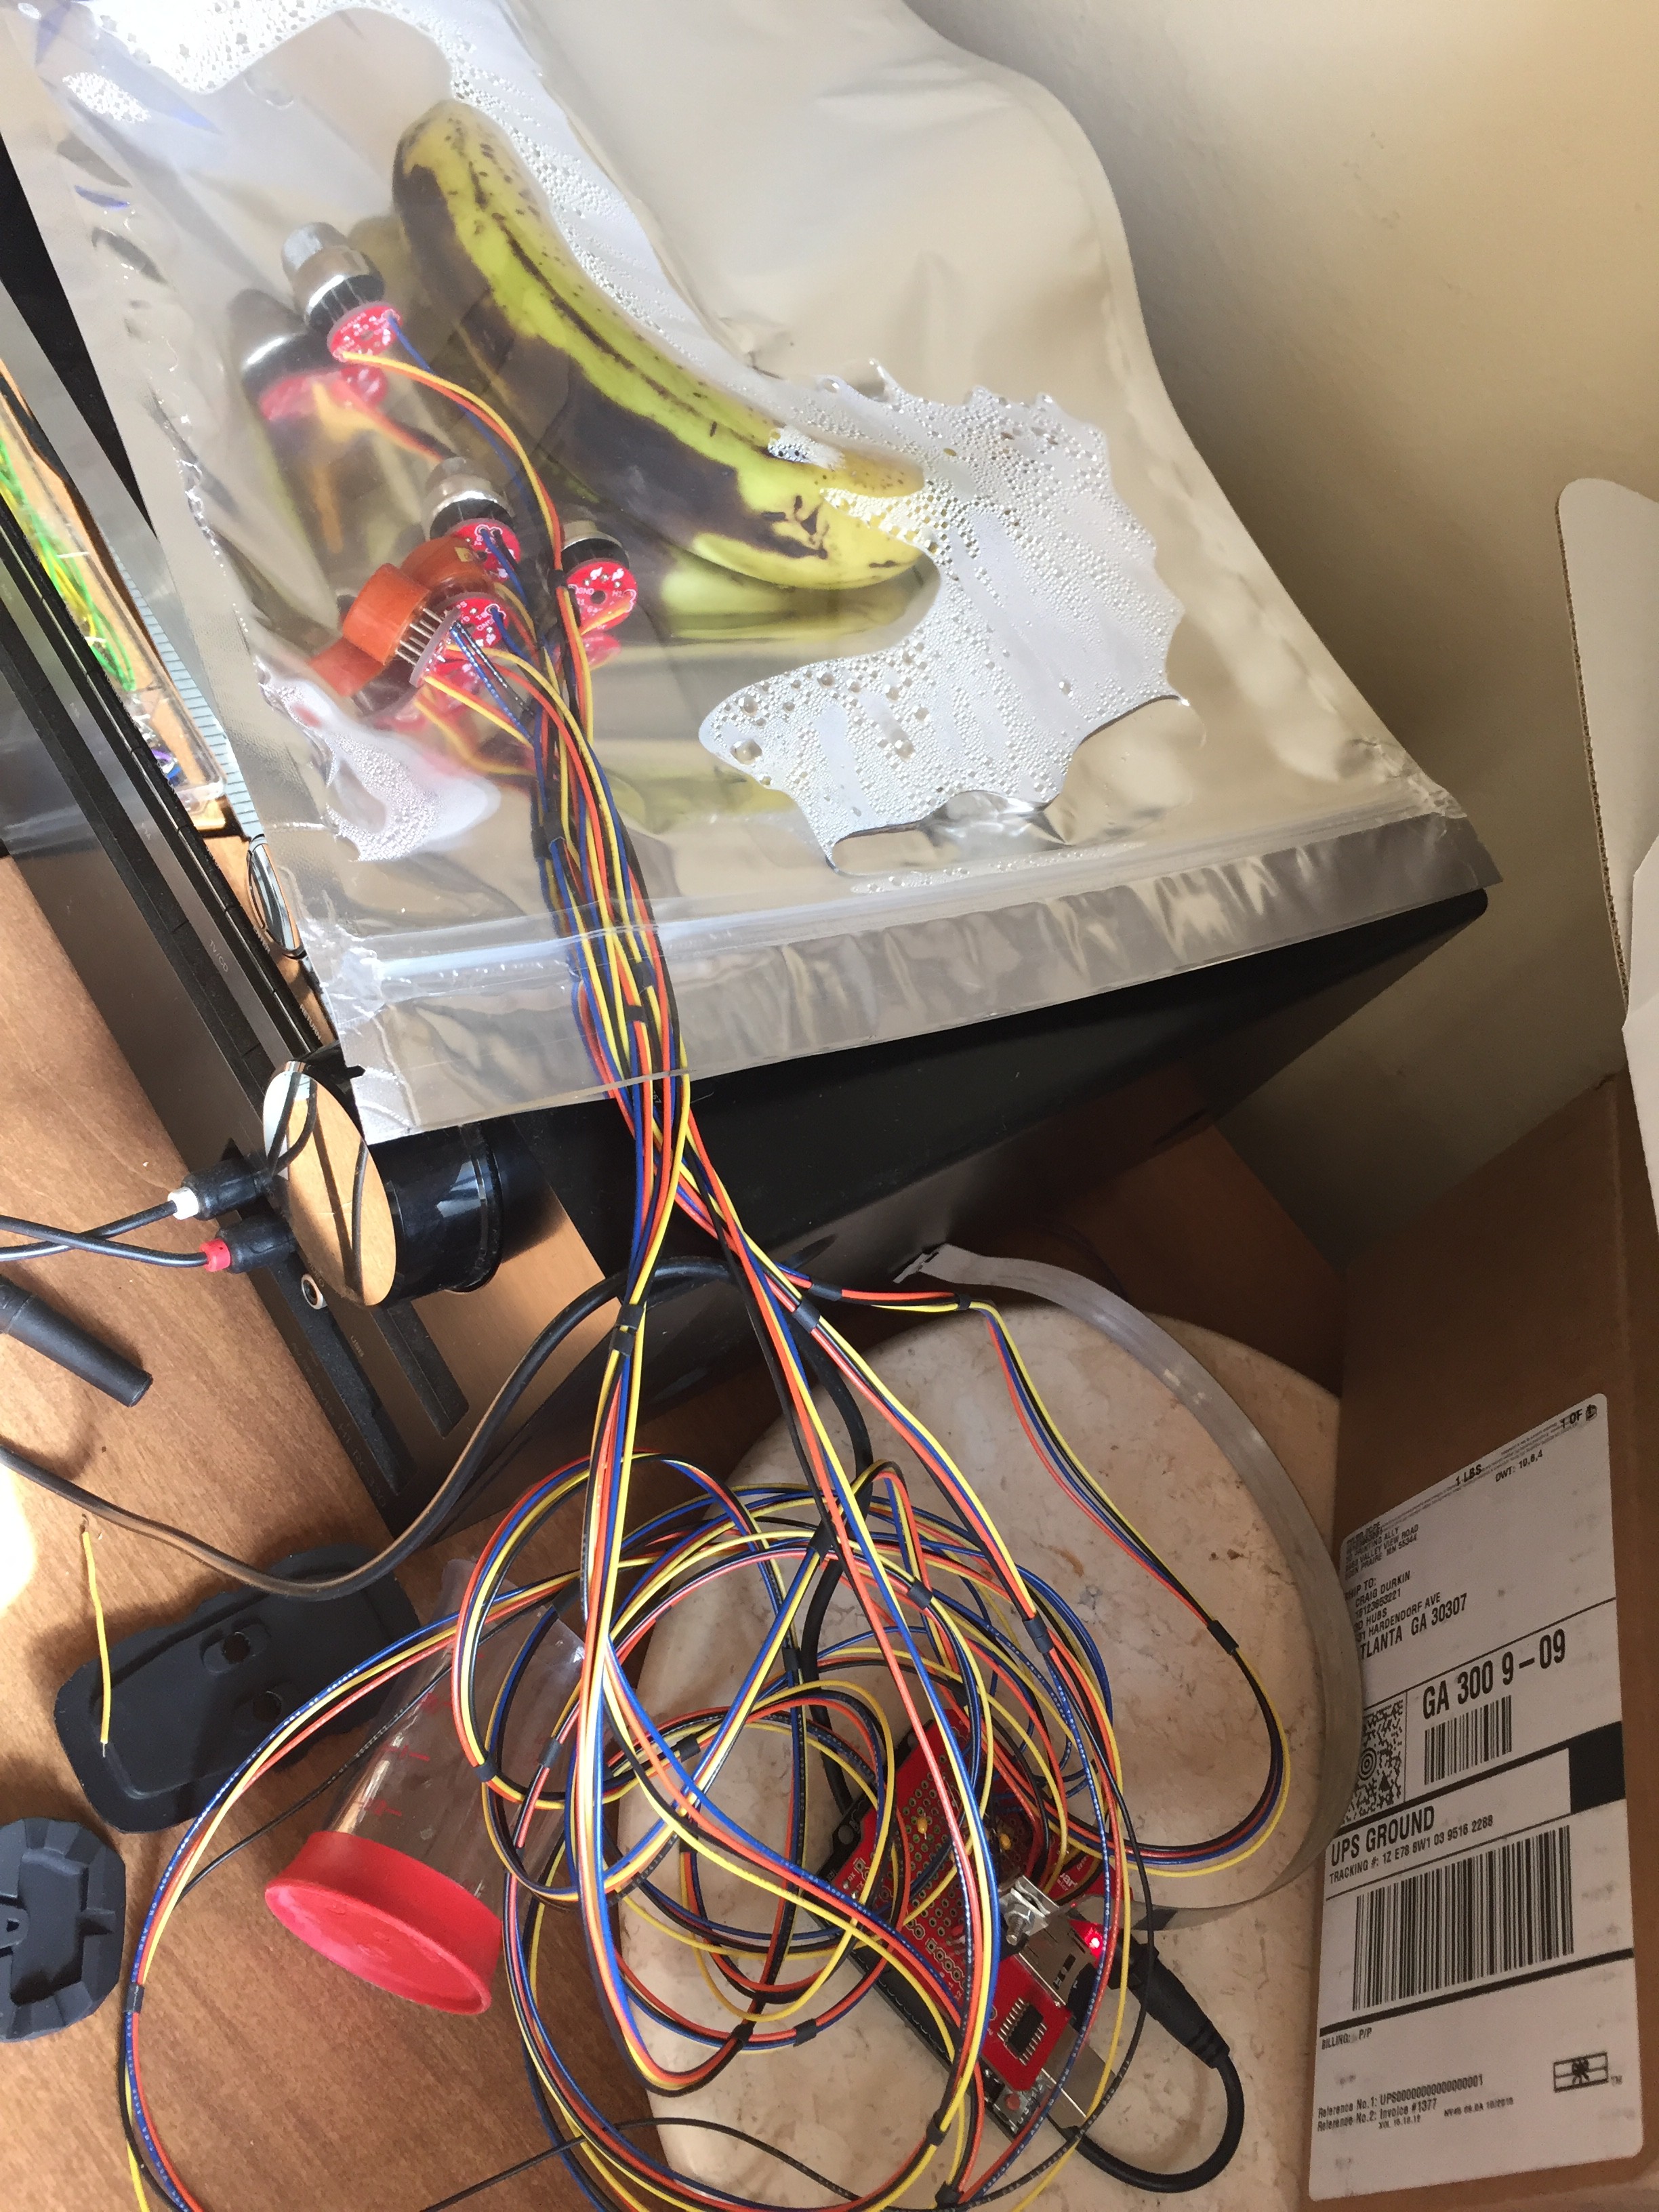
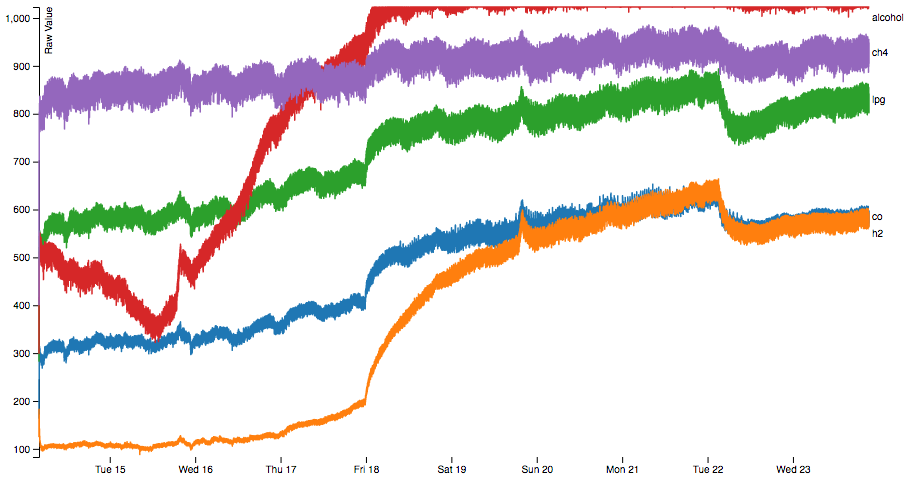
We put all the sensors in a sealed plastic bag with a green banana. Bananas don’t grow in Atlanta but they are really smelly when ripe. If our sensor system can’t detect a banana ripening then it seems like it wouldn’t stand a chance for an apple or pear.
The sensors were all placed in the bag and left running for a day so they could burn-in and be stable. After that, the banana was placed in the bag and the bag was sealed, leaving about 1” unsealed to accommodate the sensor wiring. Our experiment took place over the course of 10 days and we had some reference bananas from the same bunch to compare visually during the experiment and to taste afterwards.
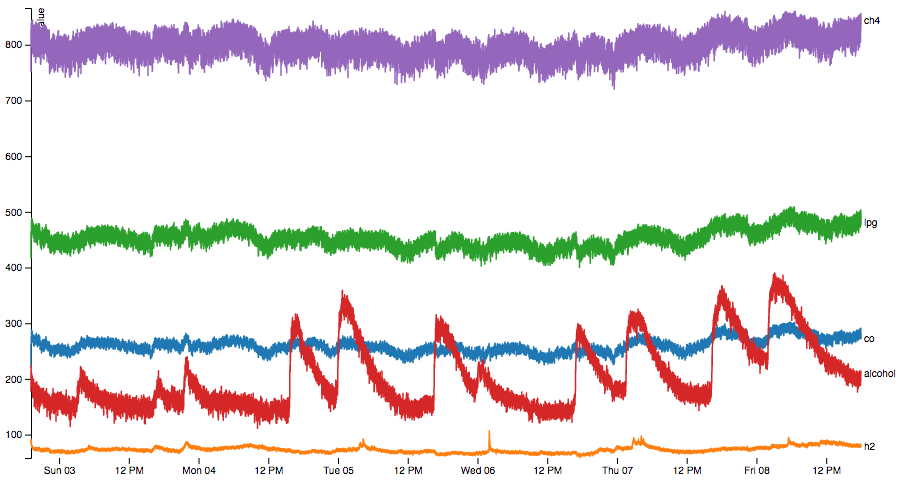
![]()
![]()
The first nice thing to notice about the data is that it points up and to the right. That’s super cool! We’re detecting something in relation to ripeness. But beyond that, we’ve got our usual problems.
Also, the banana ripened really weirdly in the bag and gave off a lot of moisture. It tasted fine in the end, but we probably need to use a water vapor-permeable material like Tyvek in the real world. The last photo in this GIF shows the bag-ripened version on the bottom compared to a banana from the same bunch, but ripened in open air.
![]()
Since Taguchi gas sensors rely on a heated semiconductor to operate, they increase the ambient temperature and could accelerate ripening. We'll have to take this in to account in future designs.
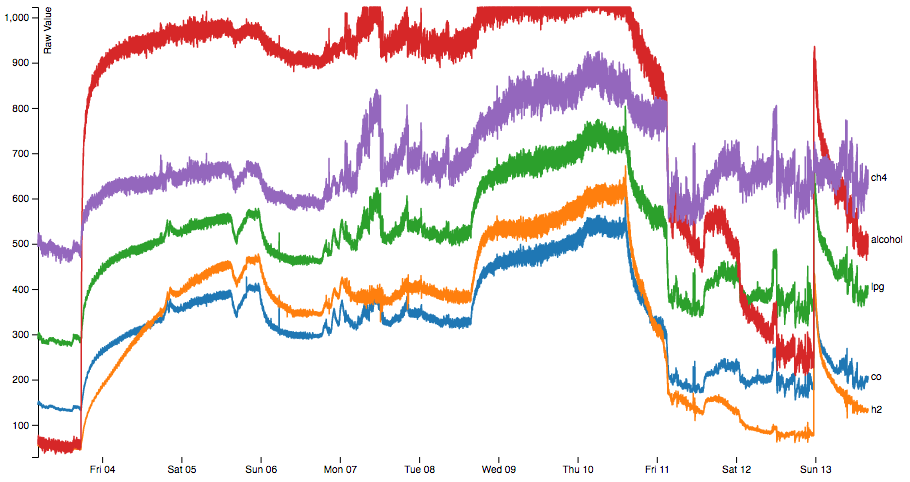
Second Experiment
![]()
Once again we have a trend and once again there’s also a lot of garbage. There is a noisy period there from Sunday the 6th to Wednesday the 9th where I squeezed the bag and tried to distribute the gas around. One can imagine that if I hadn’t done that then there would be a much smoother curve there.
Electronic nose to detect fruit ripening
Can we get fruit trees to report to us when their fruit is ripe?


 During the course of figuring this out I managed to cause another sensor to short out the Arduino, and it seemed like a matter of time before all the sensors would fail.