-
2External Hardware Debugger
There are wide variety of hardware debugging devices available, and in this example we will be using the FT2232H Mini Module, which is pre-configured in Visual Micro.
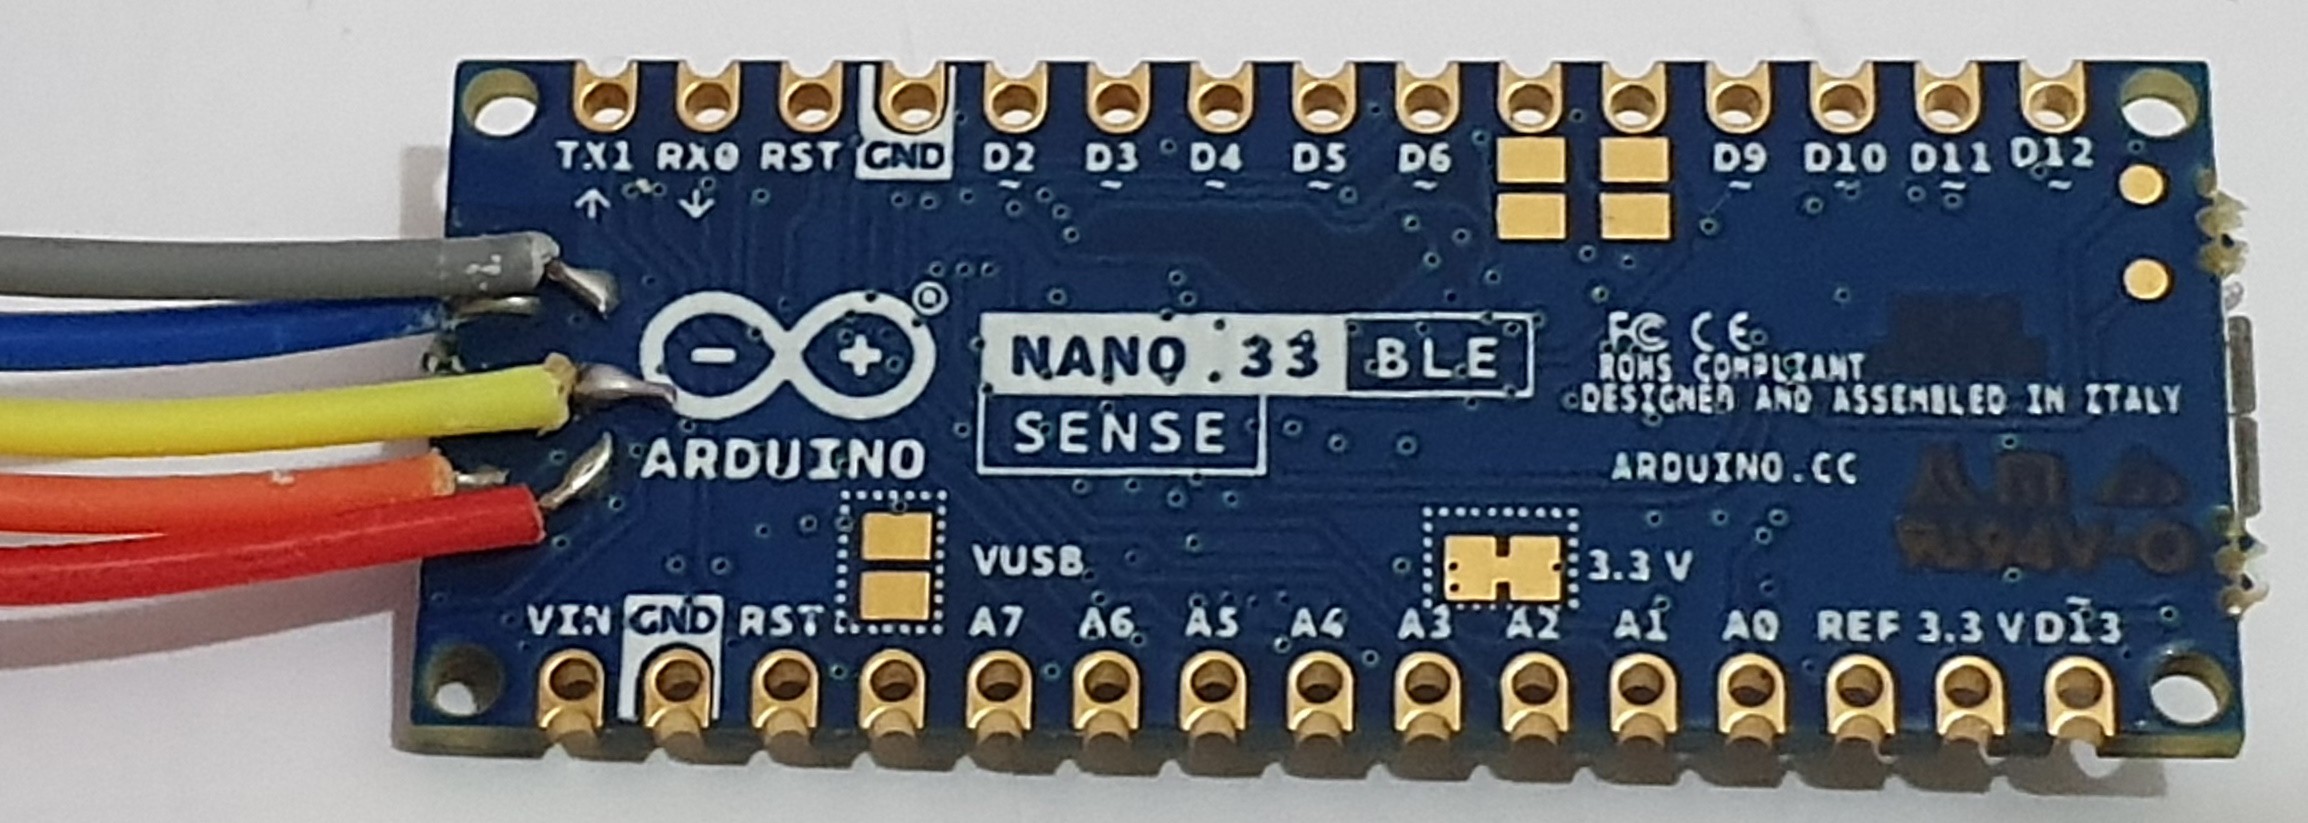
Note - we only connect one interface of this dual interface module in this example, the second is often used for serial output
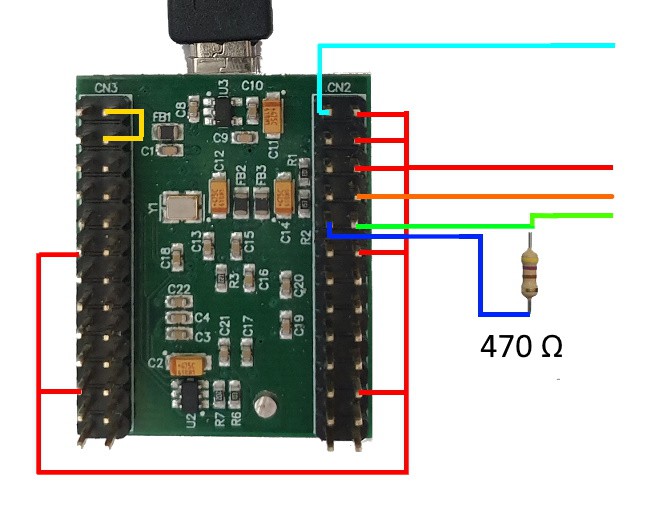
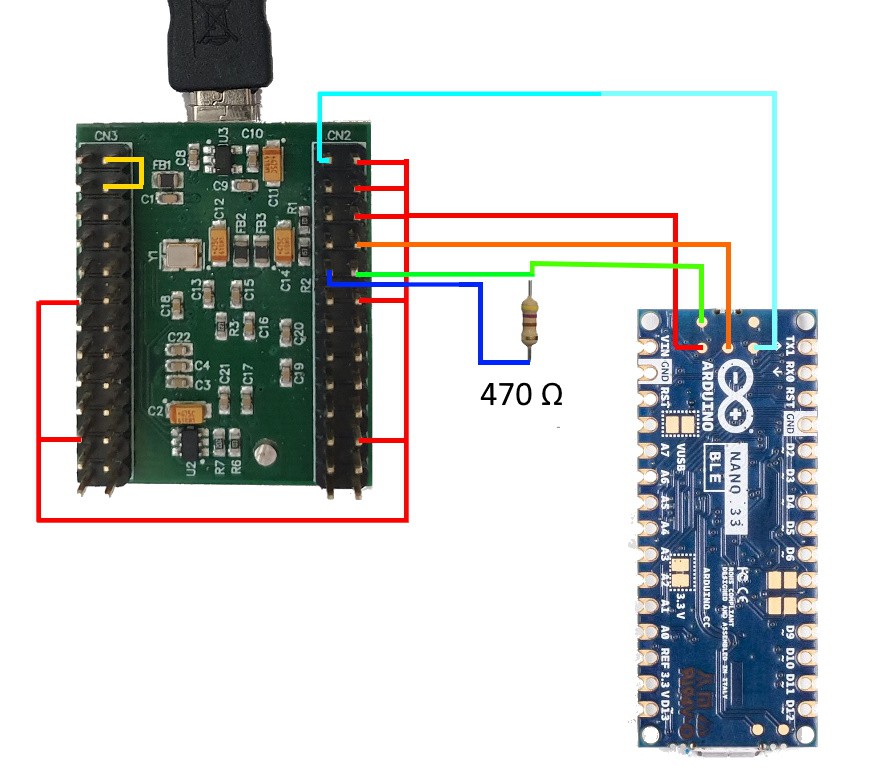
The FT2232H Mini Module requires some wiring of its own to make it function, which can be completed using the jumper wires, breadboard, and the resistor.
![]()
Wiring Diagram for the FT2232H Mini Module with SWD Hack Note: The resistor and wiring configuration here make it compatible with SWD debugging, and is compatible with JTAG debugging already, so you can use it with the ESP32 and STM32 family of boards as well!
All detailed information about the FT2232H wiring can be found in the datasheet here.
-
4Driver Setup
Some debuggers need an additional USB Driver installing on Windows to allow the debugging work correctly.
In our FT2232H Mini Module example you will need the Zadig tool, and to install the driver so they match in the tool.
Open the Zadig tool after downloading
Select Options > List All Devices
Now drop down the device list and select "Interface 0" of the device
If the driver versions do not match, click Install Driver
There is a handy list of debugger / additional driver information on this page.
-
5Debugging Setup
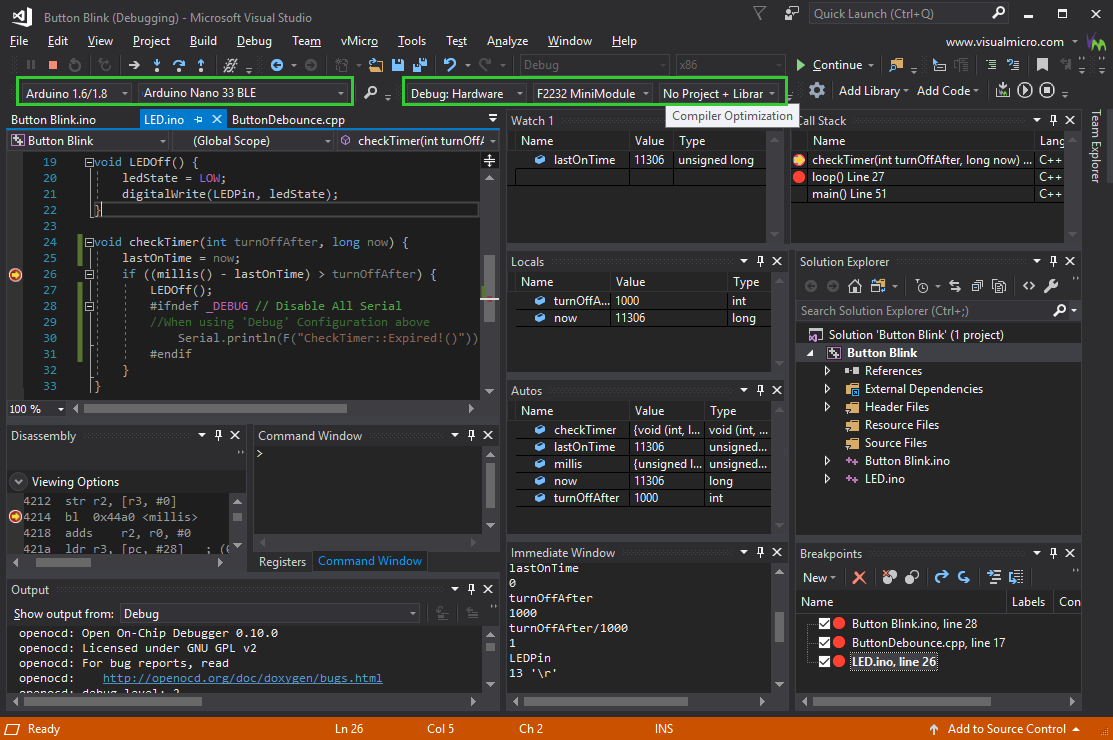
Once you are setup with the Arduino IDE + Visual Studio + Visual Micro, you can start debugging straight away.
Simply open your project and select the correct board and COM port.
Now you can set the debugger to "Hardware" which will expose a new list of pre-configured debuggers.
Select the one you are using, and ensure the vMicro > Debugger > Optimisation is set to "No Project + Libraries".
Add a break point in where you want to stop initially, these can be moved once you have started the debugger, and there is often a limit of 6 concurrent breakpoints.
Now simply build and upload your code, and attach the debugger. You can also do this in one step by simply pressing Debug > Start Debugging.
How to debug an NRF52840 with an Arduino project and GDB
Arduino Nano 33 BLE GDB Debugging
Full GDB Debugging with the Arduino Nano 33 BLE and the FT2232H Module with an SWD hack in Visual Micro
 Tim
Tim


Discussions
Become a Hackaday.io Member
Create an account to leave a comment. Already have an account? Log In.
I don't why you waste your time and everybody else's time by not giving clear instructions regarding the drivers and scant explanation for what you have done. A complete time waster as far as I am concerned.
Are you sure? yes | no