 GOAT INDUSTRIES
The core ingredients of this project are:
- Nvidia Jetson Nano development board / Raspberry Pi 4 + 4 GB RAM.
- Noctula fan nf a4x20 5v pwm (Nano only)
- ADC Pi shield for sensing battery and supply voltages.
- EVM3683-7-QN-01A Evaluation Board for supplying a steady 5v to the Nano.
- 5 Inch EDID Capacitive Touch Screen 800x480 HDMI Monitor TFT LCD Display.
- Dragino LoRa/GPS HAT for transmitting to the 'cloud' (Currently Pi 4 only)
- 12 V rechargeable battery pack.
- WavX bioacoustics R software package for wildlife acoustic feature extraction.
- Random Forest R classification software.
- In house developed deployment software.
- Full spectrum (384 kb per second) audio data.
- UltraMic 384 usb microphone.
- Waterproof case Max 004.
What have been the key challenges so far?
- Choosing the right software. Initially I started off using a package designed for music classification called ' PyAudioAnalysis' which gave options for both Random Forest and then human voice recognition Deep Learning using Tensorflow. Both systems worked ok, but the results were very poor. After some time chatting on this very friendly Facebook group: Bat Call Sound Analysis Workshop , I found a software package written in the R language with a decent tutorial that worked well within a few hours of tweaking. As a rule, if the tutorial is crap, then the software should probably be avoided! The same was true when creating the app with the touchscreen - I found one really good tutorial for GTK 3 + python, with examples, which set me up for a relatively smooth ride.
- After choosing to focus on detecting bats, finding quality bat data for my country. In theory, there should be numerous databases of full spectrum audio recordings in the UK and France, but when actually trying to download audio files, most of them seem to have been closed down or limited to the more obscure 'social calls'. The only option was to make my own recordings which entailed setting up the device overnight in my local nature reserves, by which I managed to find 7 species of bat. Undoubtedly, the data is the most important part of this project and I spent very many pleasant hours out in the wilderness with the detector and the sounds of these wonderful creatures.
- Using GTK 3 to produce the app. Whilst python itself is very well documented on Stack exchange etc, solving more detailed problems with GTK 3 was hard going. One bug was completely undocumented and took me 3 days to remove! The software is also rather clunky and not particularly user friendly or intuitive. Compared to ordinary programming with Python, GTK was NOT an enjoyable experience, although it's very rewarding to see the app in action.
![]()
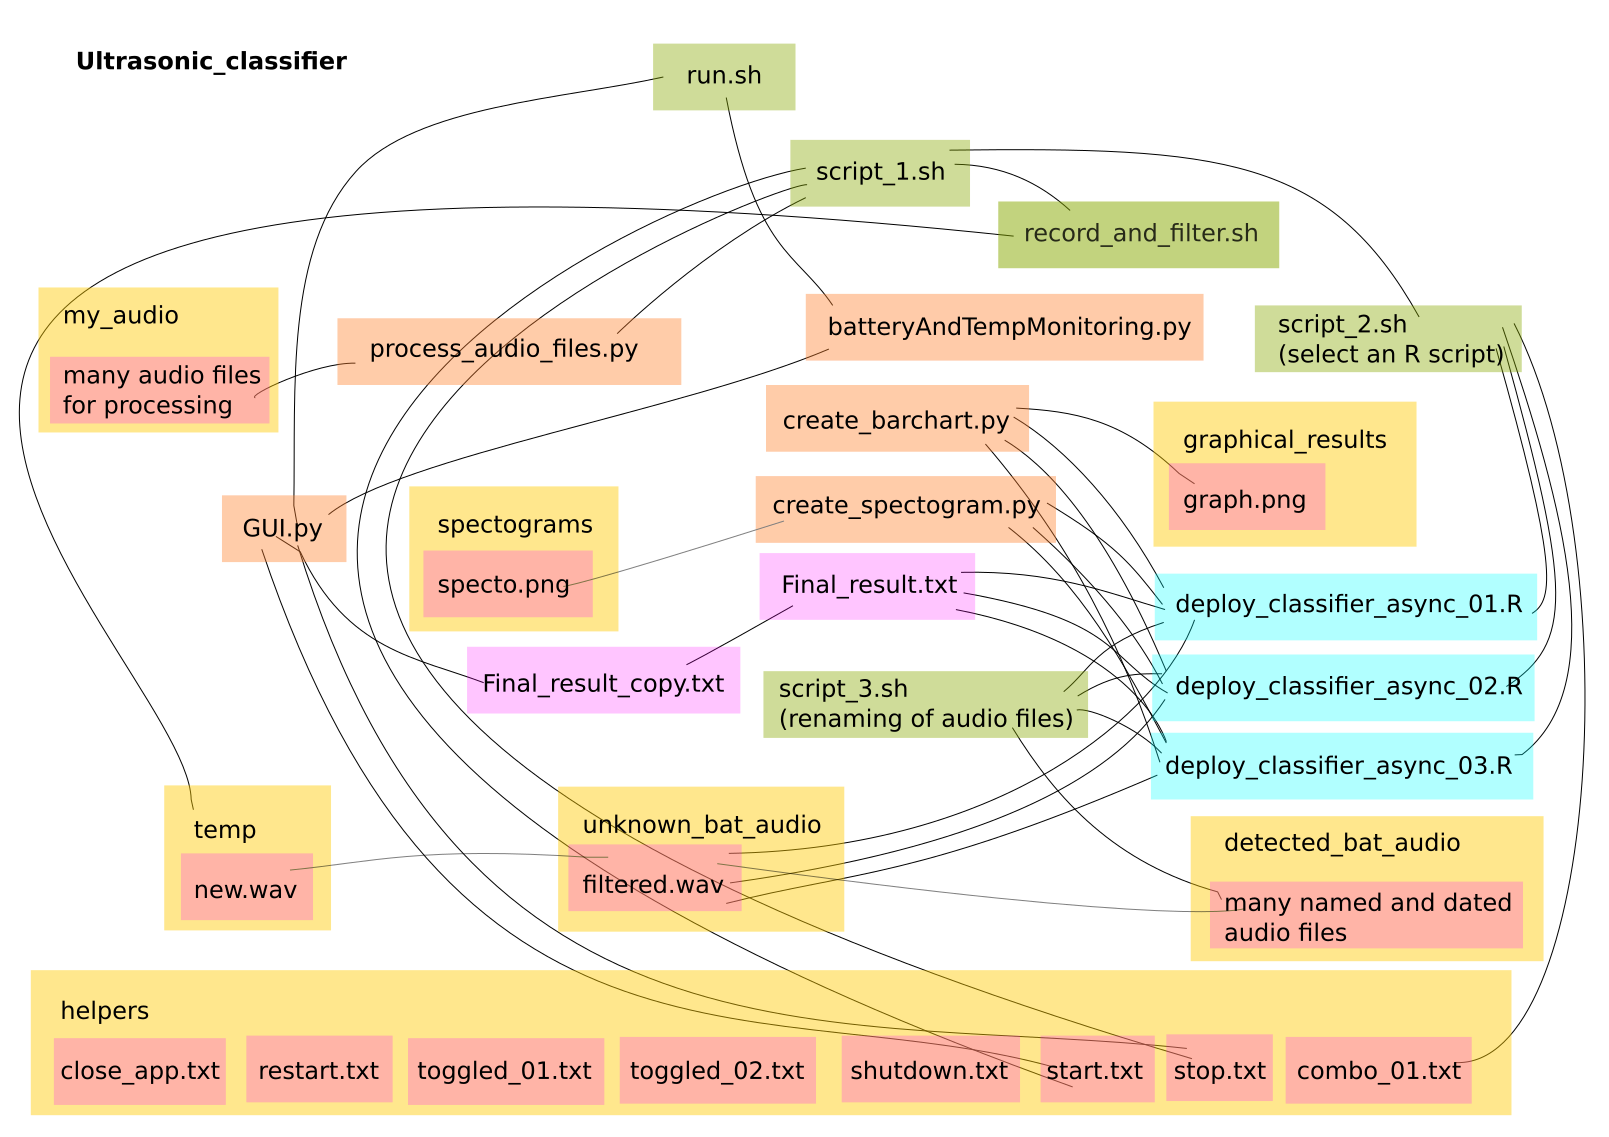
- Designing the overall architecture of the app - GTK only covers a very small part of the app - the touch screen display. The rest of it relies on various Bash and Python scripts to interact with the main deployment script which is written in R. Learning the R language was really not a problem as it's a very generic languages and and only seems to differ in it's idiosyncratic use of syntax, just like any other language really. The 'stack' architecture initially started to evolve organically with a lot of trial and error. As a Hacker, I just put it together in a way that seemed logical and did not involve too much work. I'm far too lazy to learn how to build a stack properly or even learn any language properly, but, after giving a presentation to my local university computer department, everybody seemed to agree that that was perfectly ok for product development. Below is a quick sketch of the stack interactions, which will be pure nonsense to most people but is invaluable to remind myself of how it all works:
![]()
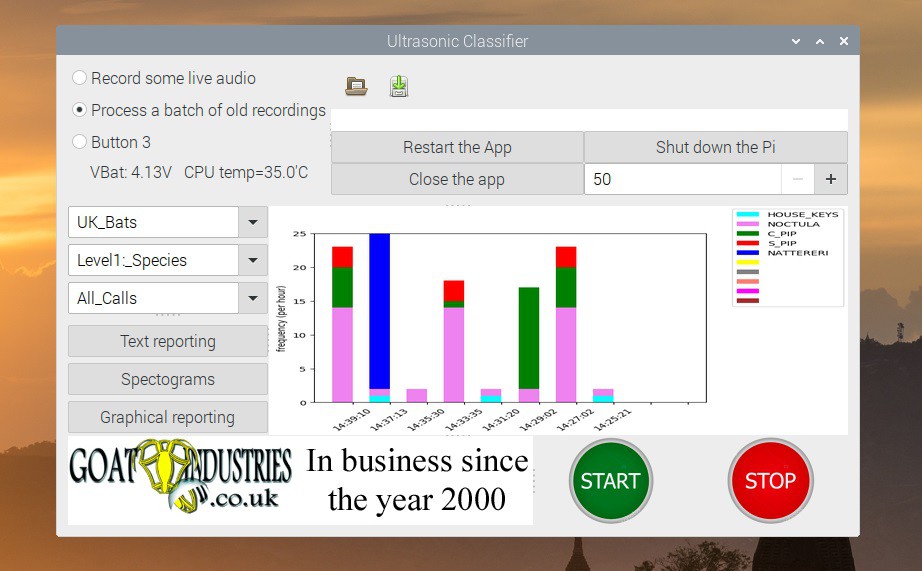
- Creating a dynamic barchart - I really wanted to display the results of the bat detection system in the most easy and comprehensive way and the boring old barchart seemed like the way forwards. However, to make it a bit more exciting, I decided to have it update dynamically so that as soon as a bat was detected, the results would appear on the screen. Using spectograms might have been ok, but they're quite hard to read on a small screen, particularly if the bat call is a bit faint. After ten days of trial and error, I got a block of code working in the R deployment script such that it produced a CSV file with all the correctly formatted labels and table data that were comprehensible to another Python script using the ubiquitous matplotlib library to creating a PNG image for GTK to display. The crux of it was getting the legend to automatically self initialise otherwise it would not work when switching to a new data set. Undoubtedly, this has saved a whole load of trouble in the future.
- Parallelism - some parts of the stack, most particularly the recording of live audio, has to be done seamlessly, one chunk after another. This was achieved in Bash using some incredibly simple syntax - the & character and the command wait. It's all done in two very neat lines of code:
arecord -f S16 -r 384000 -d ${chunk_time} -c 1 --device=plughw:r0,0 /home/tegwyn/ultrasonic_classifier/temp/new.wav &
wait
Choosing to use the Bash environment for recording audio chunks was a bit of a no brainer due to the ease of use of the Alsa library and it's ability to record at 384 ks per second. I did not even consider the possibility of doing this any other way. More recently, I realised that some parts of the stack needed to be linear, in that blocks of code needed to run one after the other, and other blocks needed to run concurrently. This was most obvious with the deployment of the Random Forest models in that they only needed to be loaded into memory once per session rather than loading them into memory every time a classification was required. It was actually quite fun to re-organise the whole stack, but required that I documented what every script did and thought really carefully how to optimise it all. The different parts of the stack, written in different languages, communicate with each other by polling various text files in the 'helpers' directory which very often don't even have any contents!
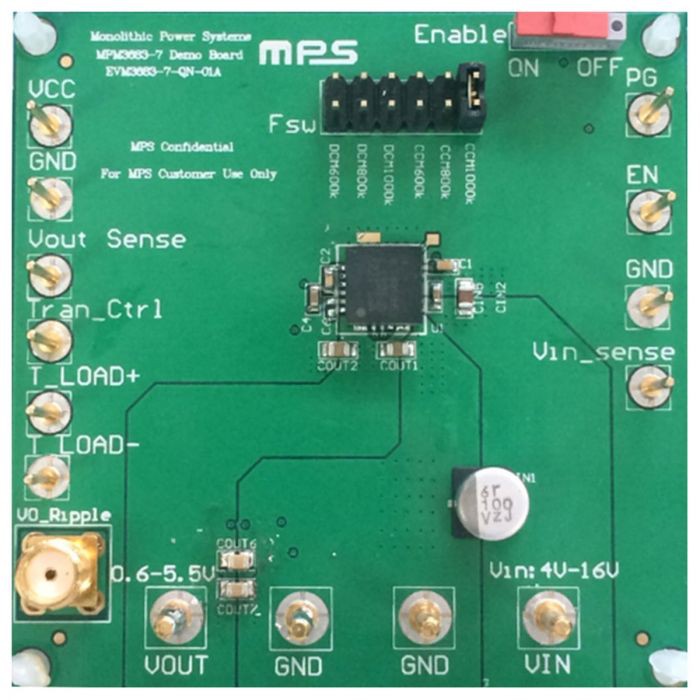
- Finding a decent battery to 5V switching regulator and fuel gauge - It's quite amazing - nobody has yet created a compact 5V power supply that can both monitor the battery state of charge AND deliver a steady 5V from a lead acid battery AND work at a frequency above 384 kHz. Fortunately, after pouring over various datasheets for a day or two, I found one chip made by Monolithic that seemed to meet all the specs. And even more fortuitous was that the company supplied a nice evaluation board at a reasonable price that did not attract customs and handling fees from the couriers. Well done Monolithic - we love you soooooo much! After running a full CPU and GPU stress test for 10 minutes, the chip temperature was only 10 degrees above ambient.
![]()
Optimising the code for minimal power useage and minimal SD card stress - This involved completely redesigning part of the stack such that the classification scripts, written in R, became asynchronous, which means that, on pressing the start button, the script runs in a continuous loop ever waiting for a new .wav chunk to appear in the 'unknown_bat_audio directory'. The advantage in doing this is that the first part of the script can be isolated as a 'set-up' block which loads all the .rds model files into memory in a one off hit, rather than having to constantly do this for every audio chunk created.
Features:
- Full spectrum ultrasonic audio recording in mono at 384 ks per second.
- Results can be displayed in real-time with 30 second delay in either text or spectogram or bar chart format.
- Runs off a 12 V battery or any power supply from 6 to 16 V.
- Software is optimised for power saving and speed.
- Average battery life is about 5 hours using 10 x 1.2 V LiMH AA batteries.
- Automatically classifies the subject in a choice of resolutions eg animal / genus / species.
- Retains data even if it is only 1% confident up to set limit eg 5 GB and then starts deleting the worst of it to prevent data clogging.
- Batch data processing mode can be used for re-evaluating any previous data or new data from other sources.
- Open source software.
- New models for new geographical zones can be trained using the core software.
- Data is transmitted to the cloud via LoRa (Currently Pi 4 only).
Here's a photo of the Raspberry Pi 4 version:
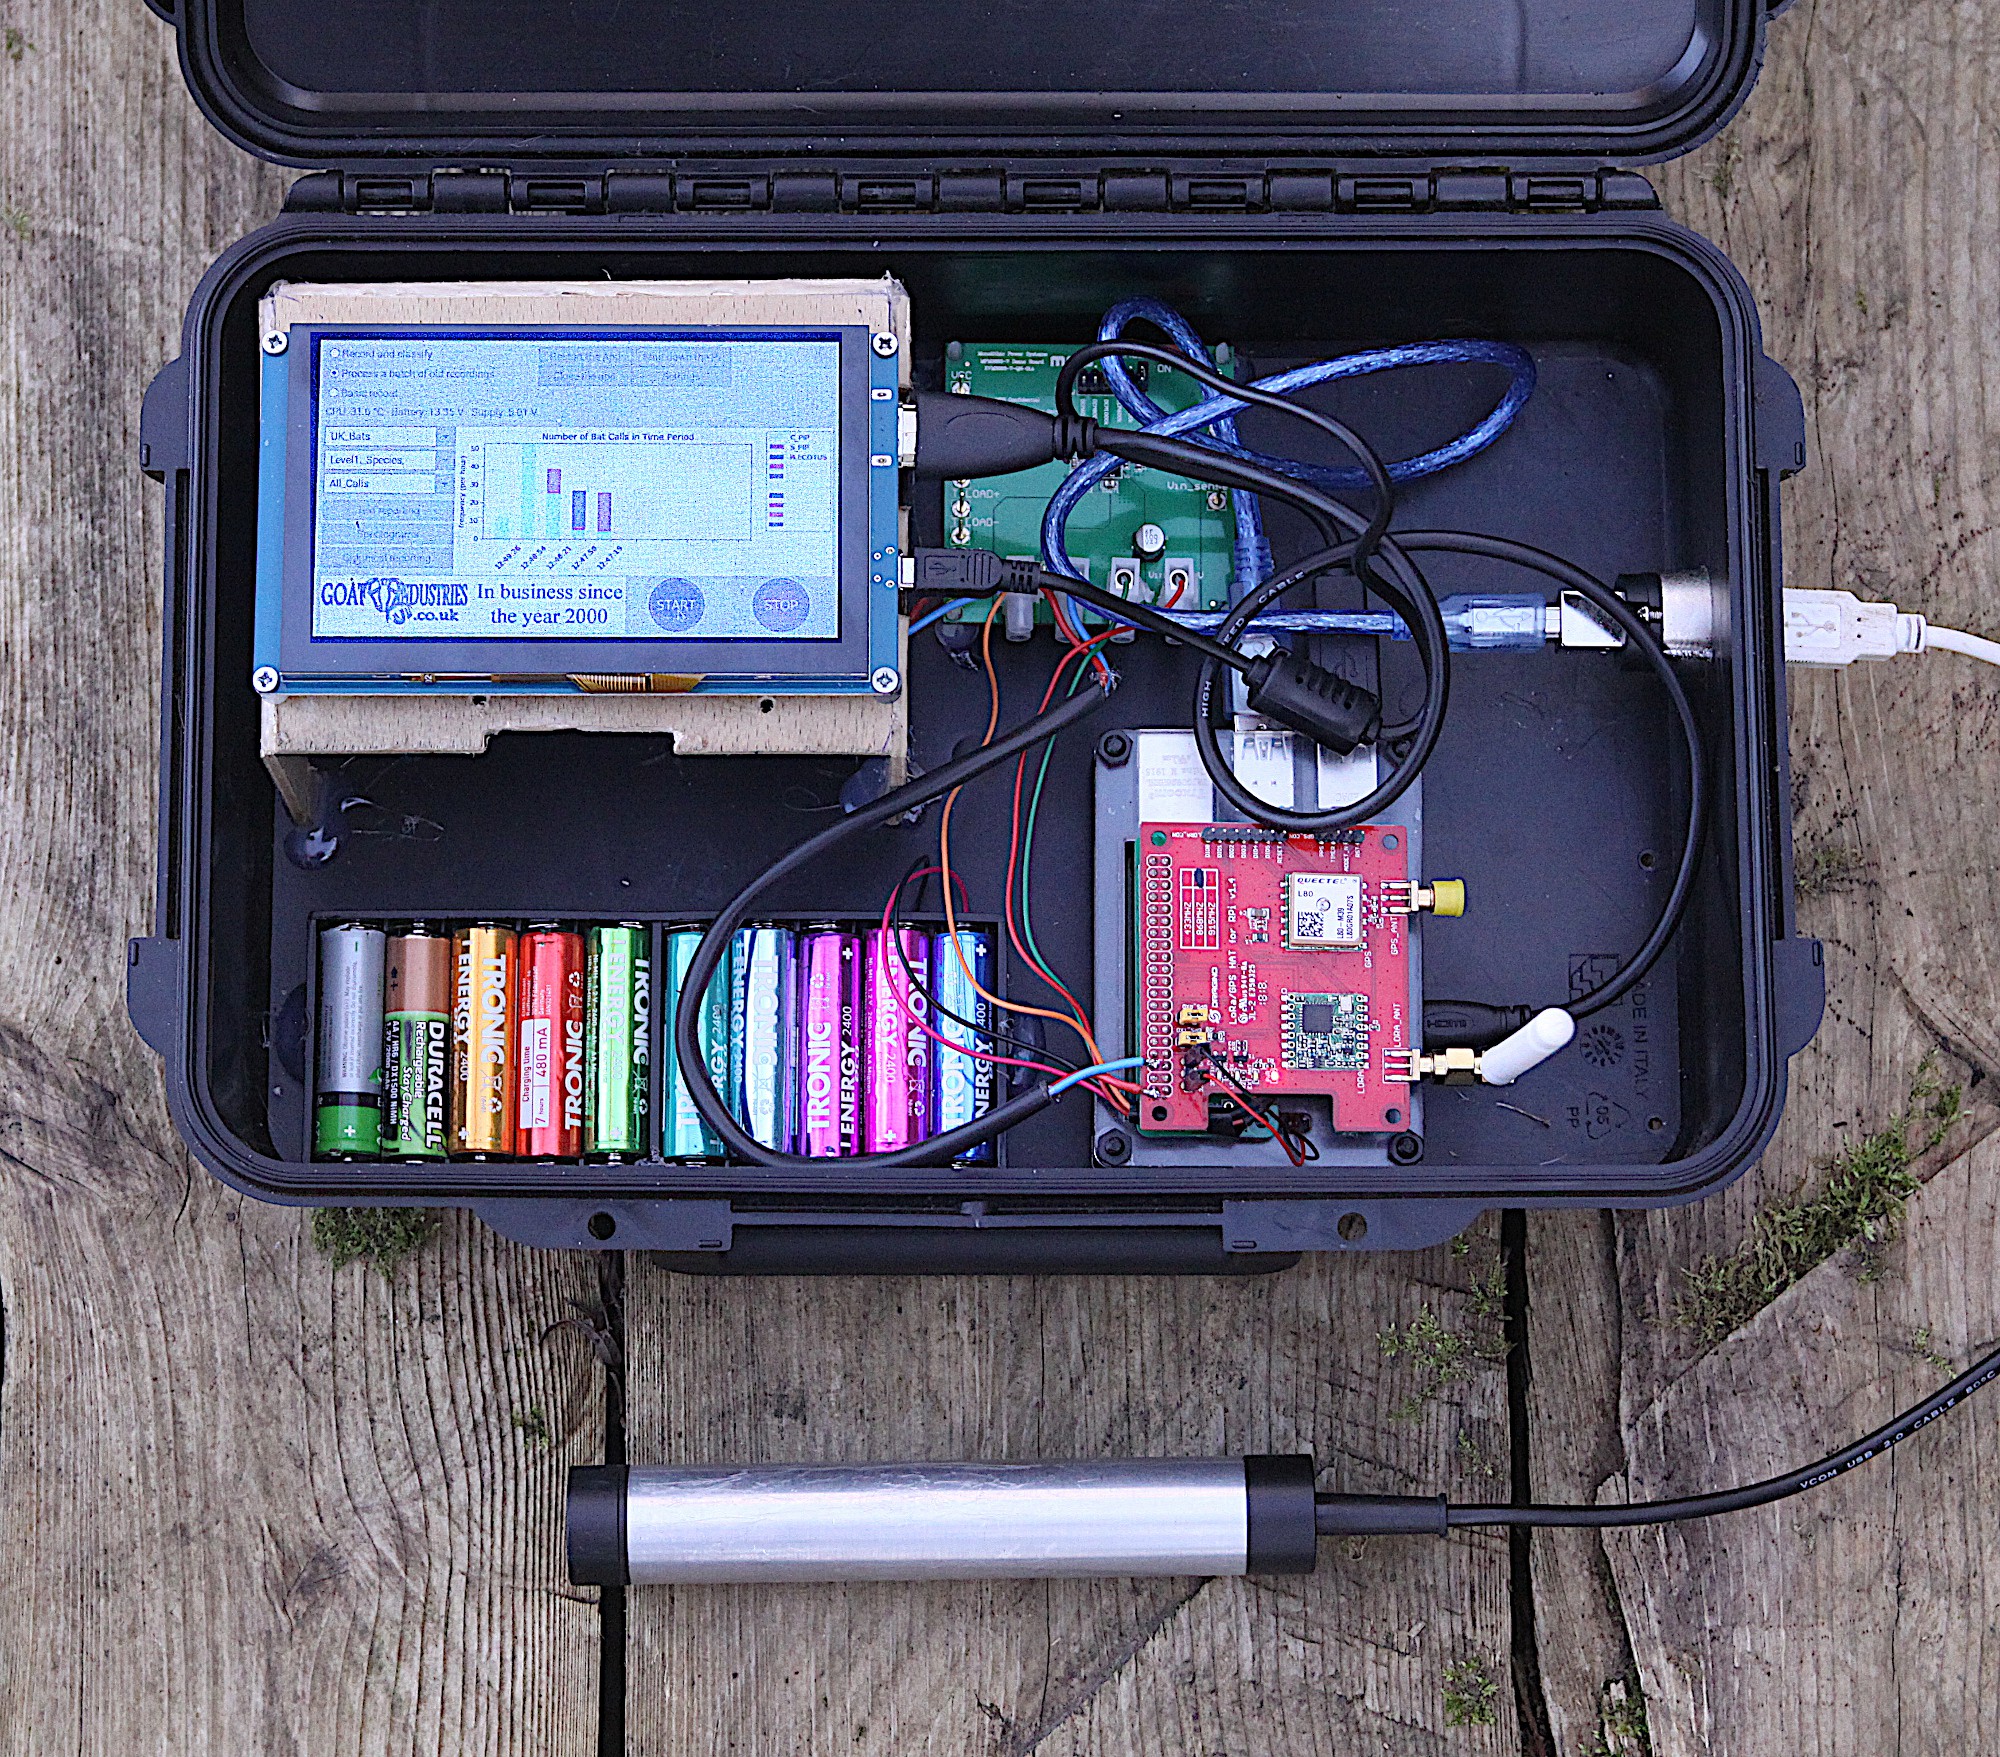
As can be seen, there are not really very many parts involved in this project.Initially, I chose to use the LoRa module and Pi4 as I had these components lying around after some other projects were abandoned. There's nothing wrong with using these gadgets and power usage is the same with a Nvidia Nano and the Pi 4 but, I have to confess, I am a bit of a cellphone 4G junky and having a web interface based on Mbytes rather than Kbytes of data is sweeeeeet. Also, as time goes on, the deep learning part of the project will be further developed and the Pi4 is, sadly, unlikely to be up to the job due to lack of suitable GPU. Other salvaged parts include the external pressure / temperature sensor and housing and the waterproof case, which is invaluable.