-
The Vent Gets a Box
06/21/2020 at 18:28 • 0 commentsRevisiting Control Delays
As discussed in the last log, feedback lag is a major concern. Most introductory control system courses focus on single input-single output (SISO) linear systems. For these simple systems, there is a mountain of theory that can be used to analyze a system and predict certain characteristics about performance, observability, controllability, stability, and more. For the Ventilator, we do indeed have a SISO system. We are controlling output commands to the blower motor controller, using pressure feedback as the input. The system is not linear, but may possibly be close enough. For linear SISO systems, Bode plot analysis of the controlled transfer function is typical. To learn more about this process, this page is enlightening. To summarize, the Bode plot can be analyzed to determine stability of a system. A major de-stabilizing factor within these systems is the pure time delay. This makes sense even without detailed mathematical analysis in the frequency domain. Imagine holding a broom upright on your palm with your eyes closed. A friend will call out which way to move your hand so you stabilize it. The delay added from having your friend tell you what to do will destabilize the control system and you will drop the broom.
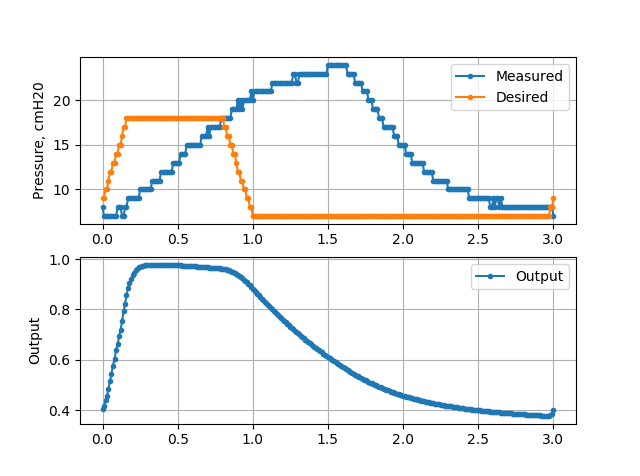
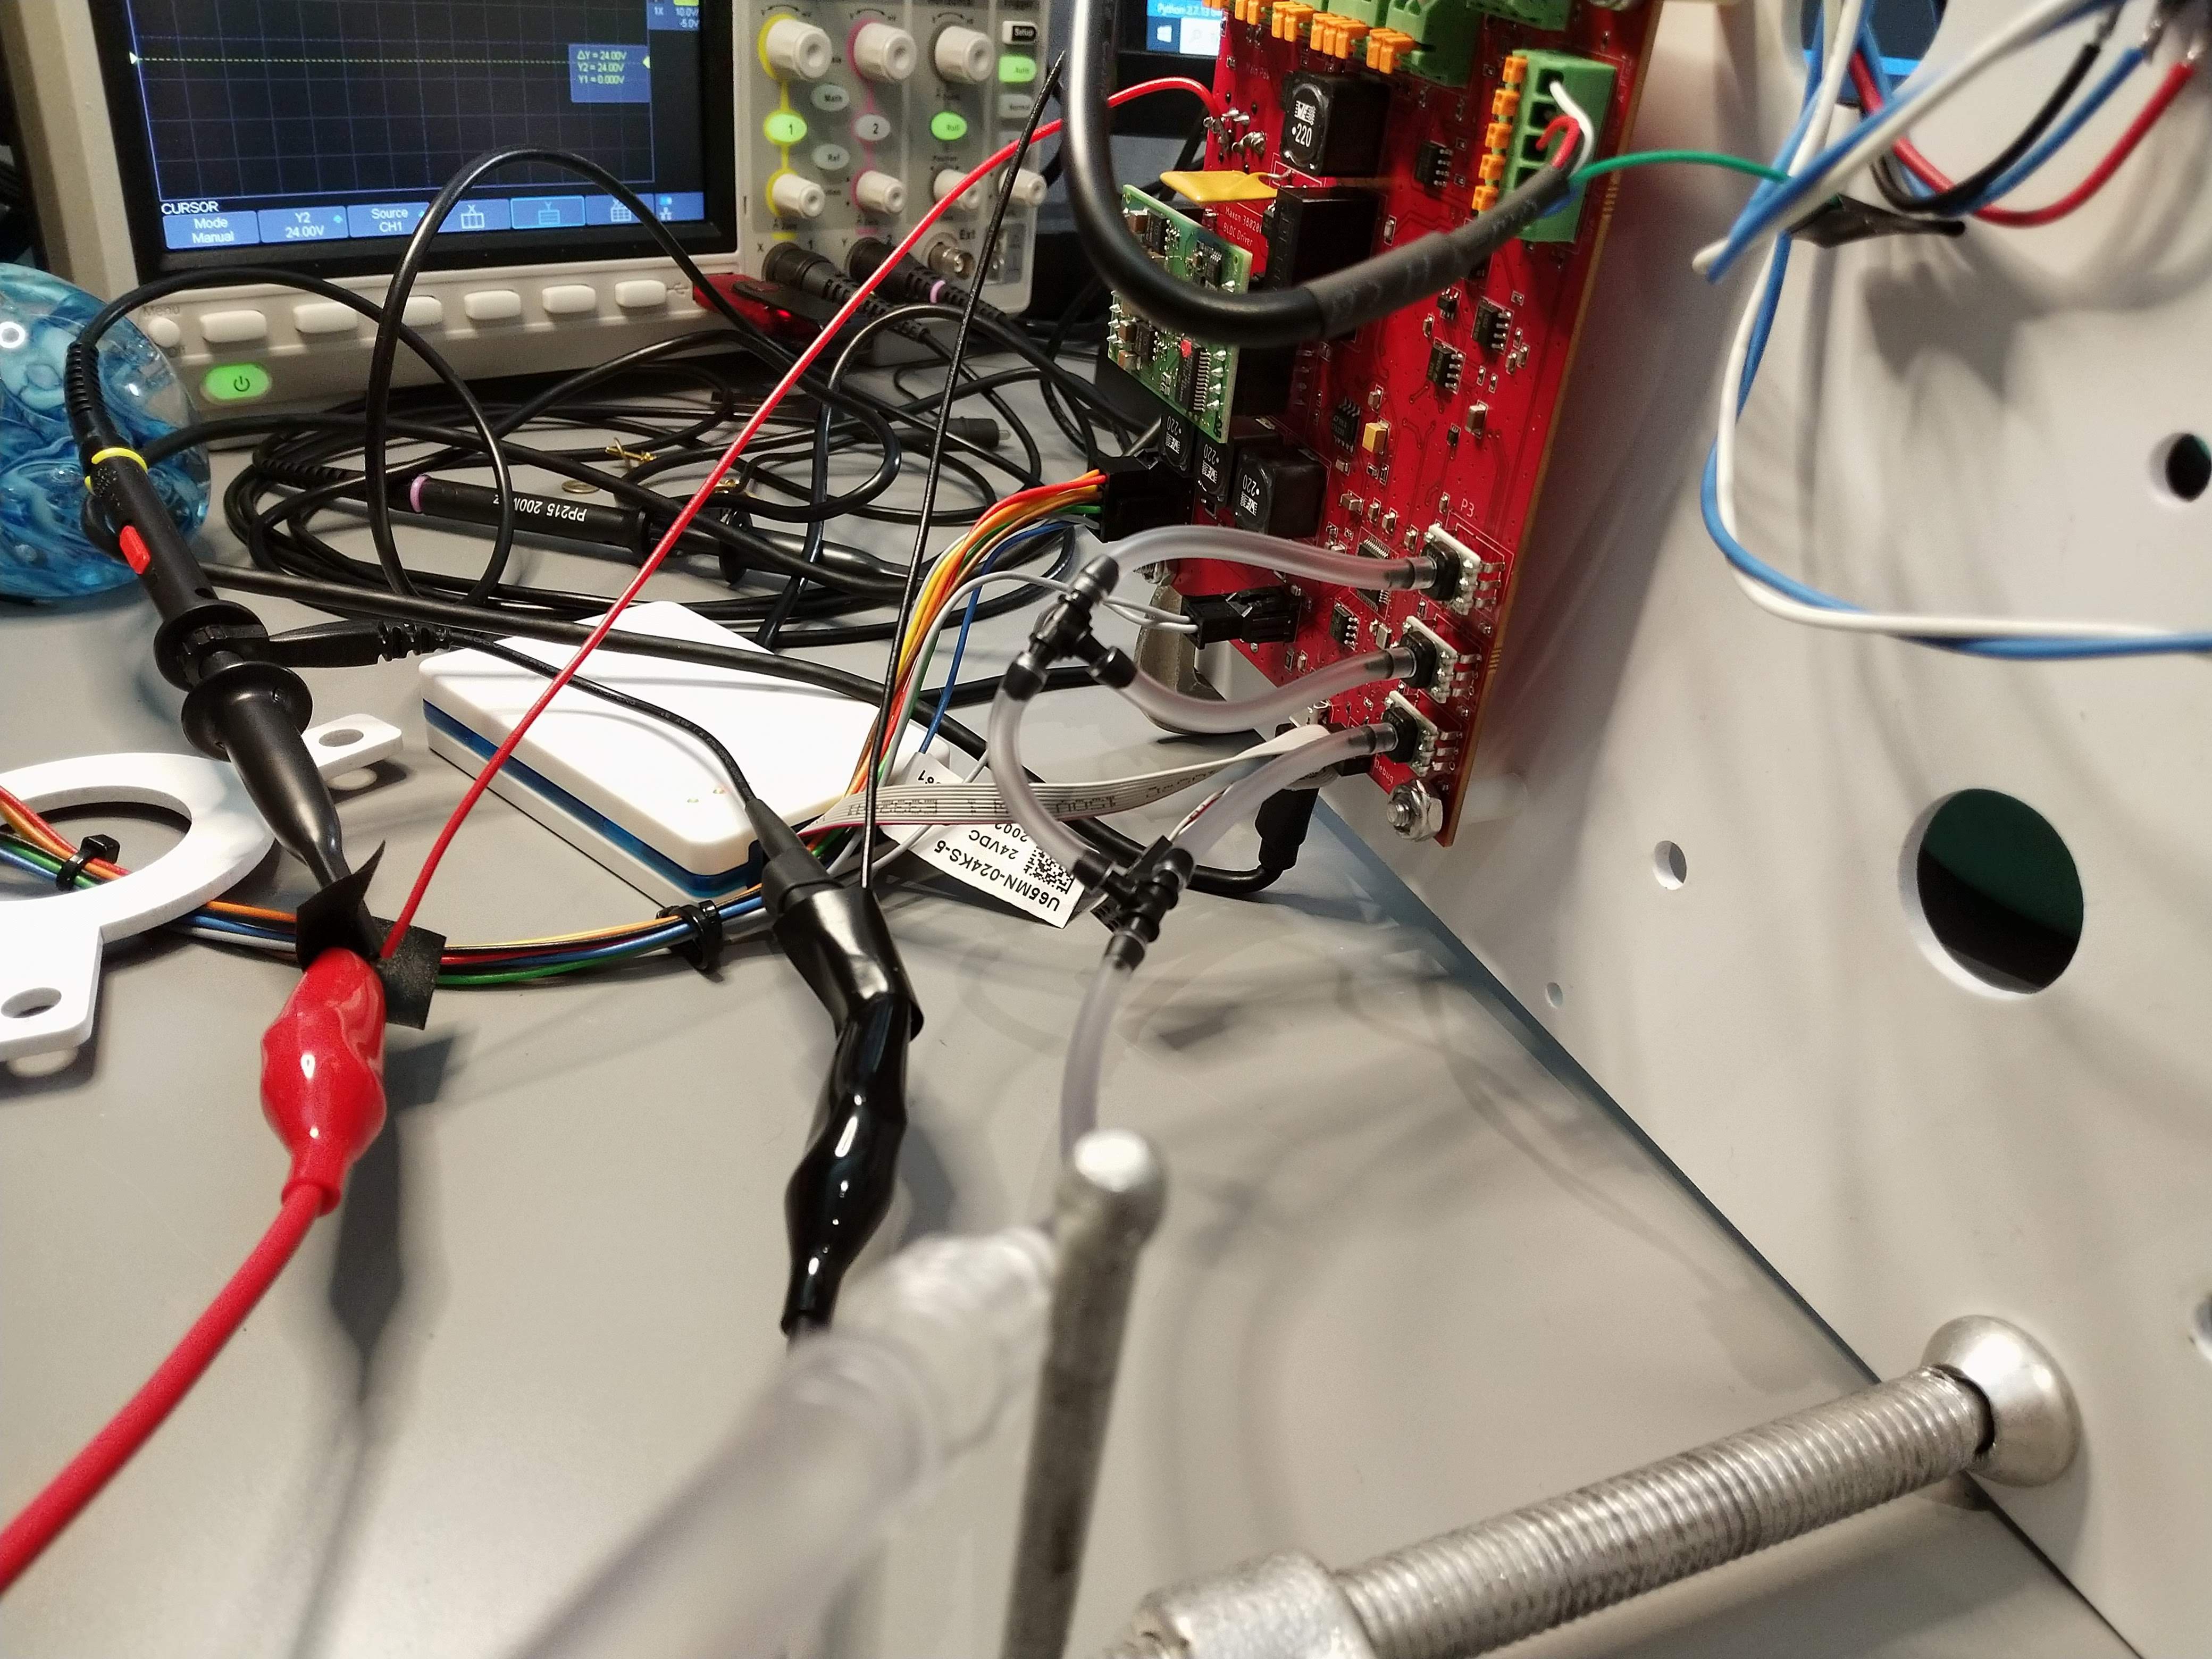
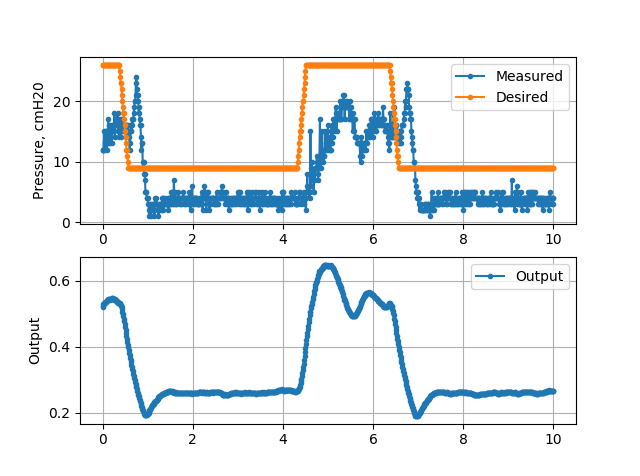
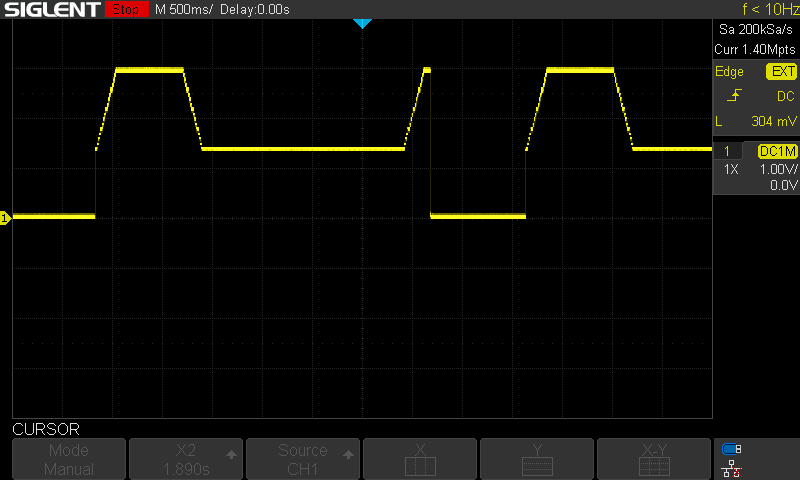
For the Low Cost Ventilator, I recently adjusted the air circuit so that the pressure sensors are connected to the Wye (just before the ETT). An extra length of hose carries the air from that section to the pressure sensors. That, combined with some apparently slow ramp up on blower speed adds a significant feedback delay. The image below shows one breath cycle at 20 breaths per minute. Even though the command to the motor ramps up relatively quickly, the measured pressure only reaches its peak about 1.25 seconds later. This controller is mainly feedforward, since the delay would destabilize a PID controller.
![]()
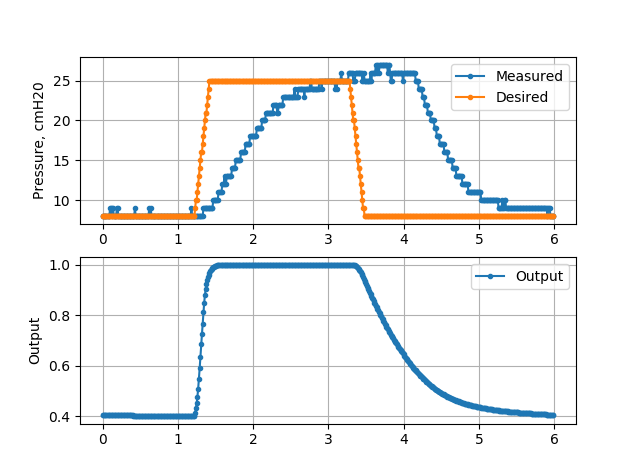
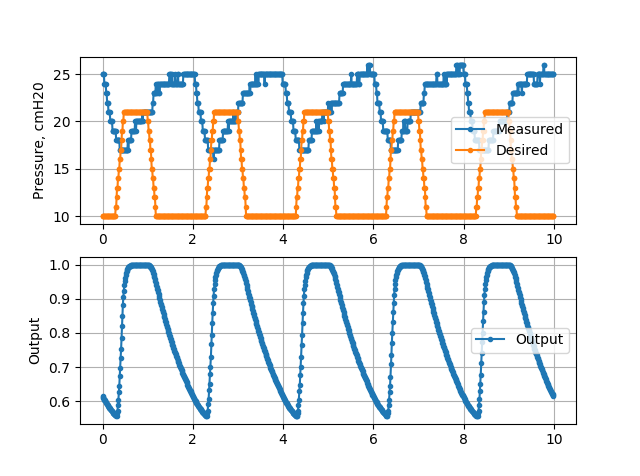
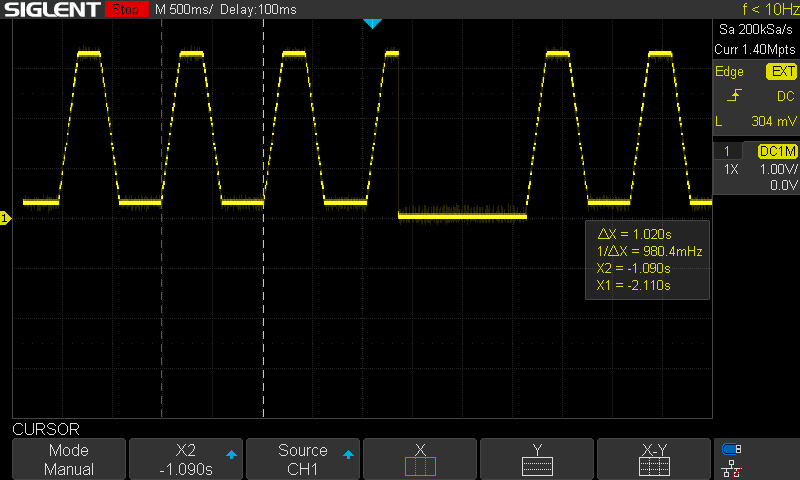
Likewise, this delay is visible for a slower breath cycle which allows more time for the dynamics to stabilize.
![]()
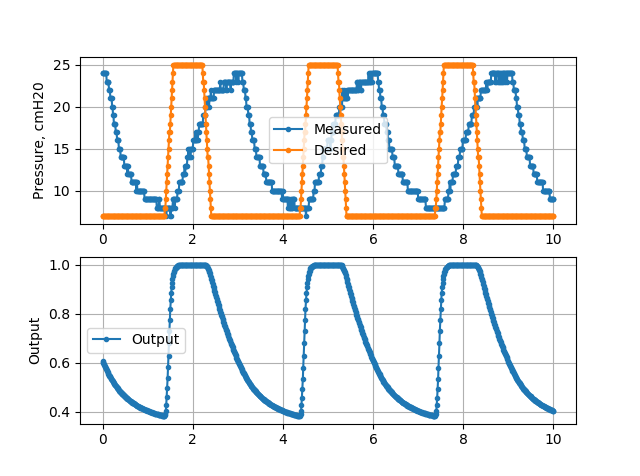
Although there are some control approaches that can be done to combat pure delays, such as Model Reference Adaptive Control or the use of a Smith Predictor, the best approach is to adapt the design to reduce this delay. Likely this would mean a stronger blower or a controller that ramps up speed faster, and moving the pressure sensor nearer to the Wye.
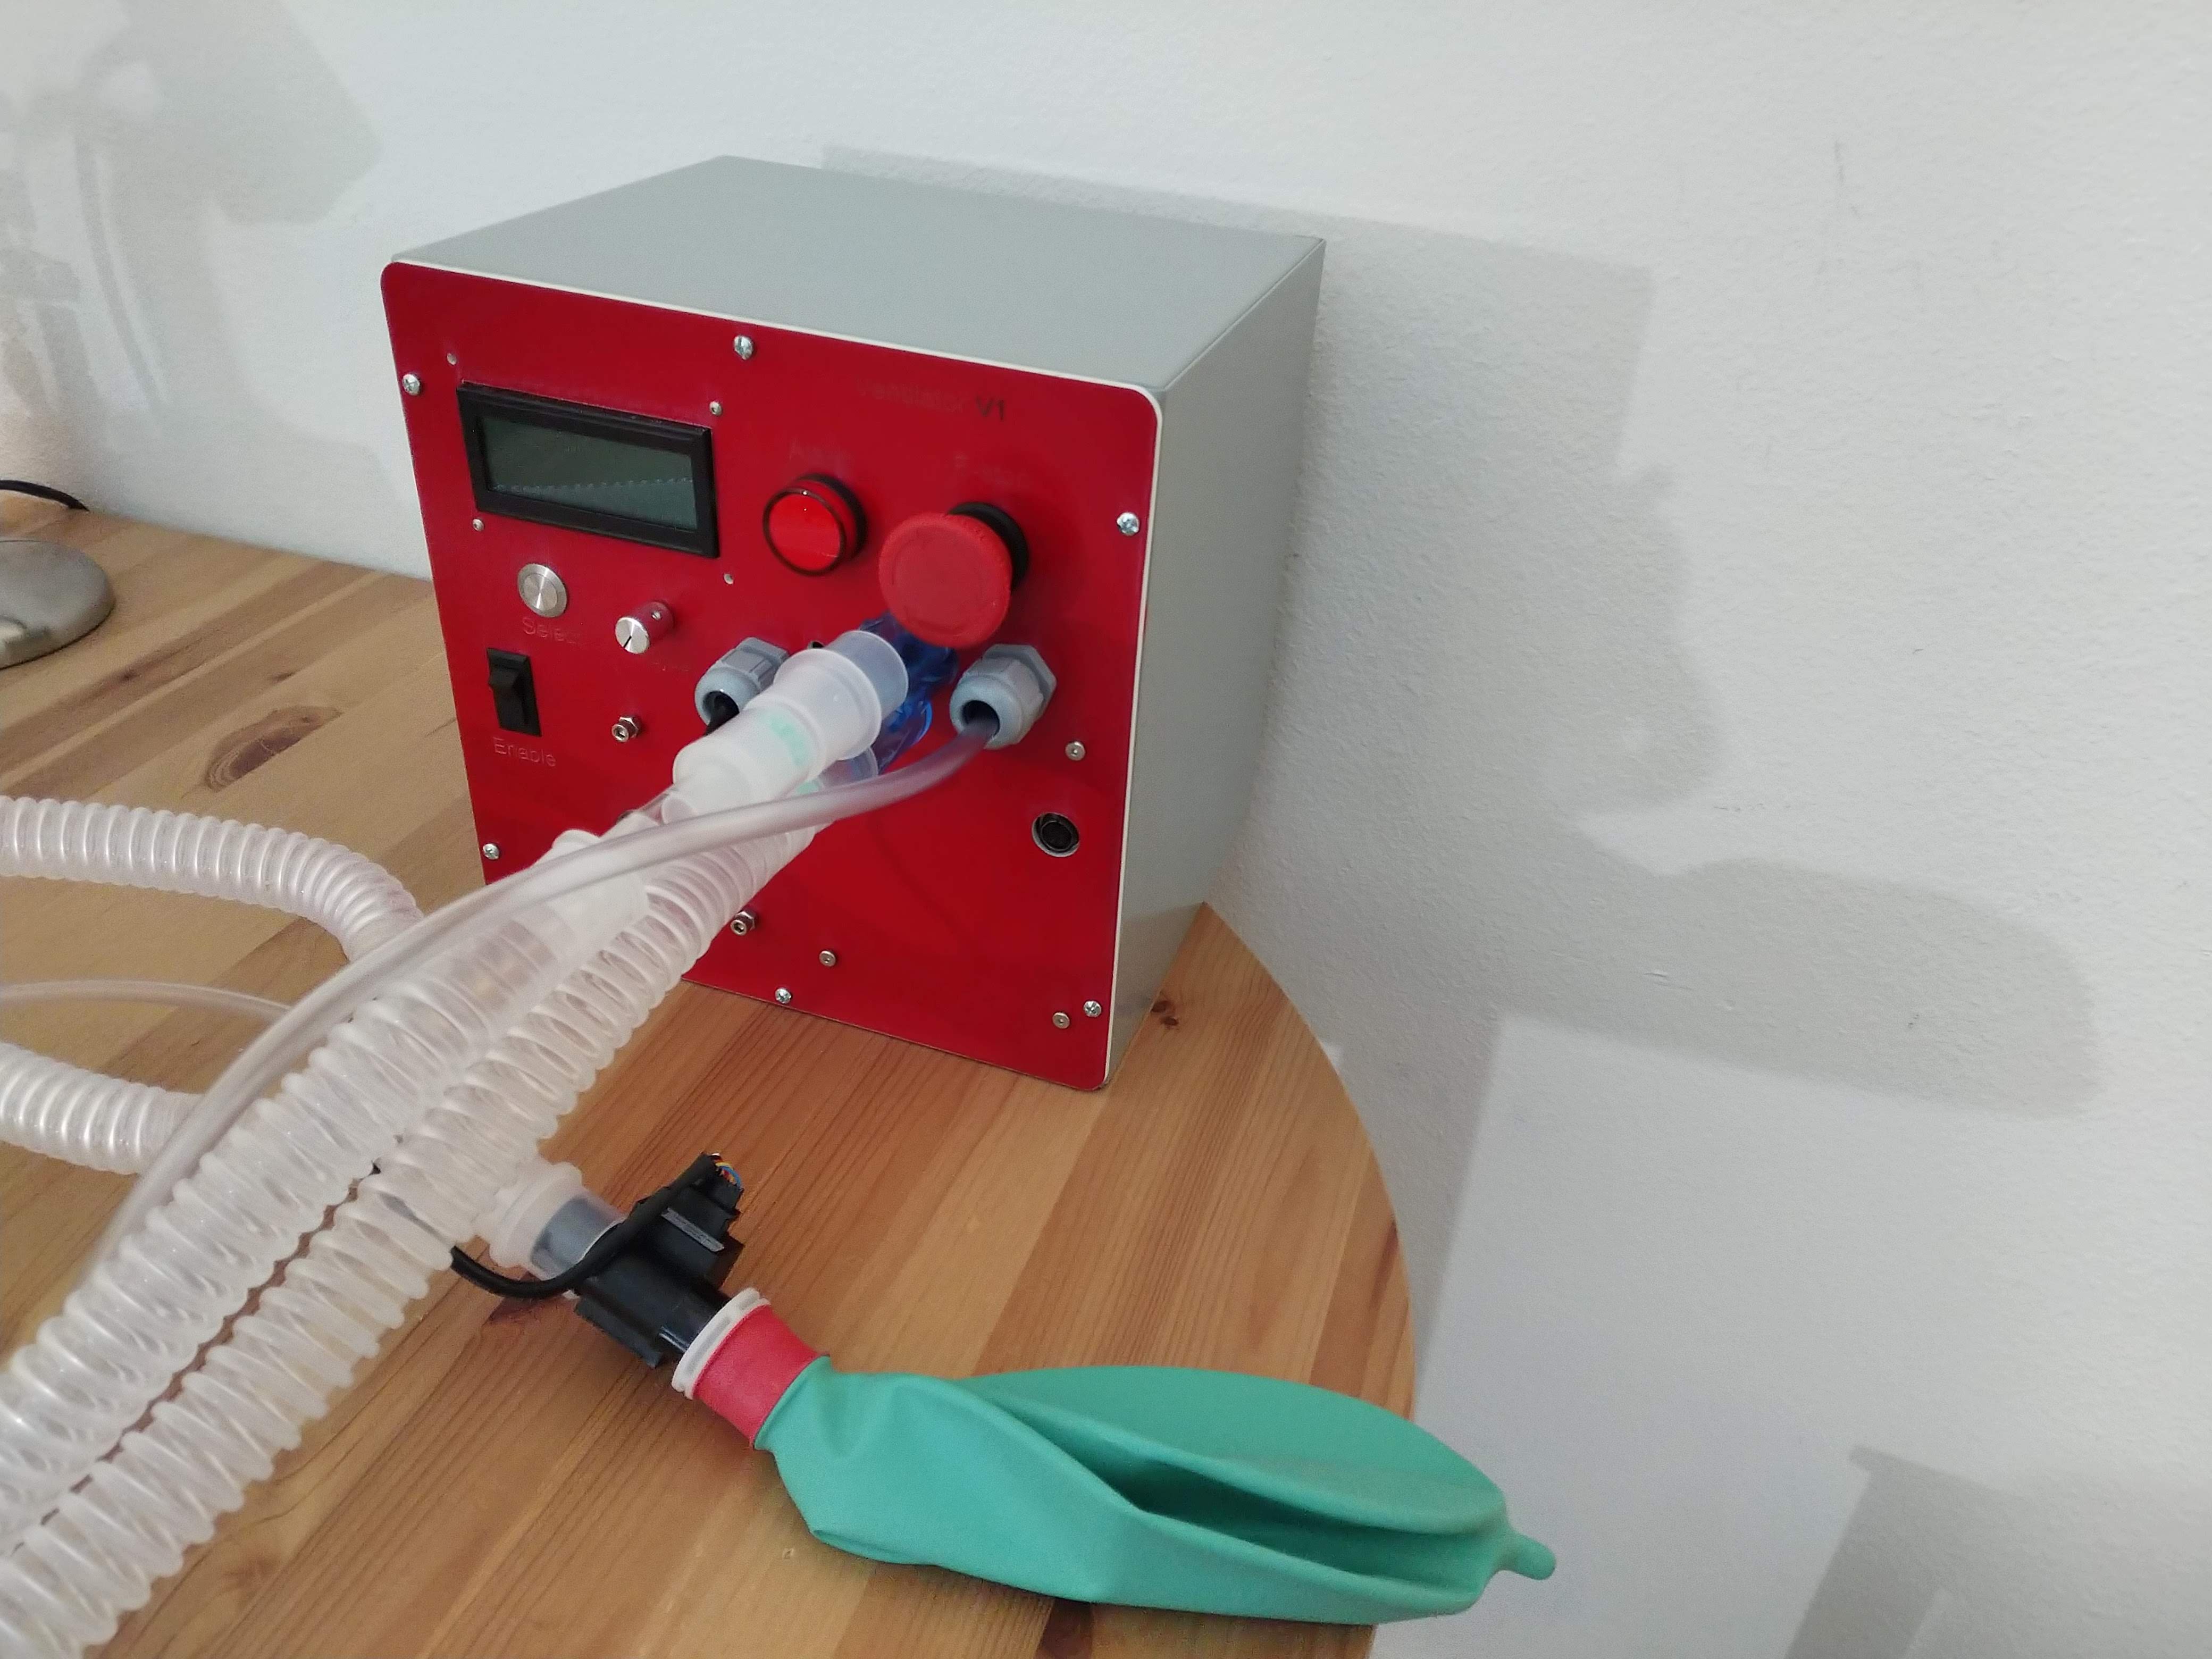
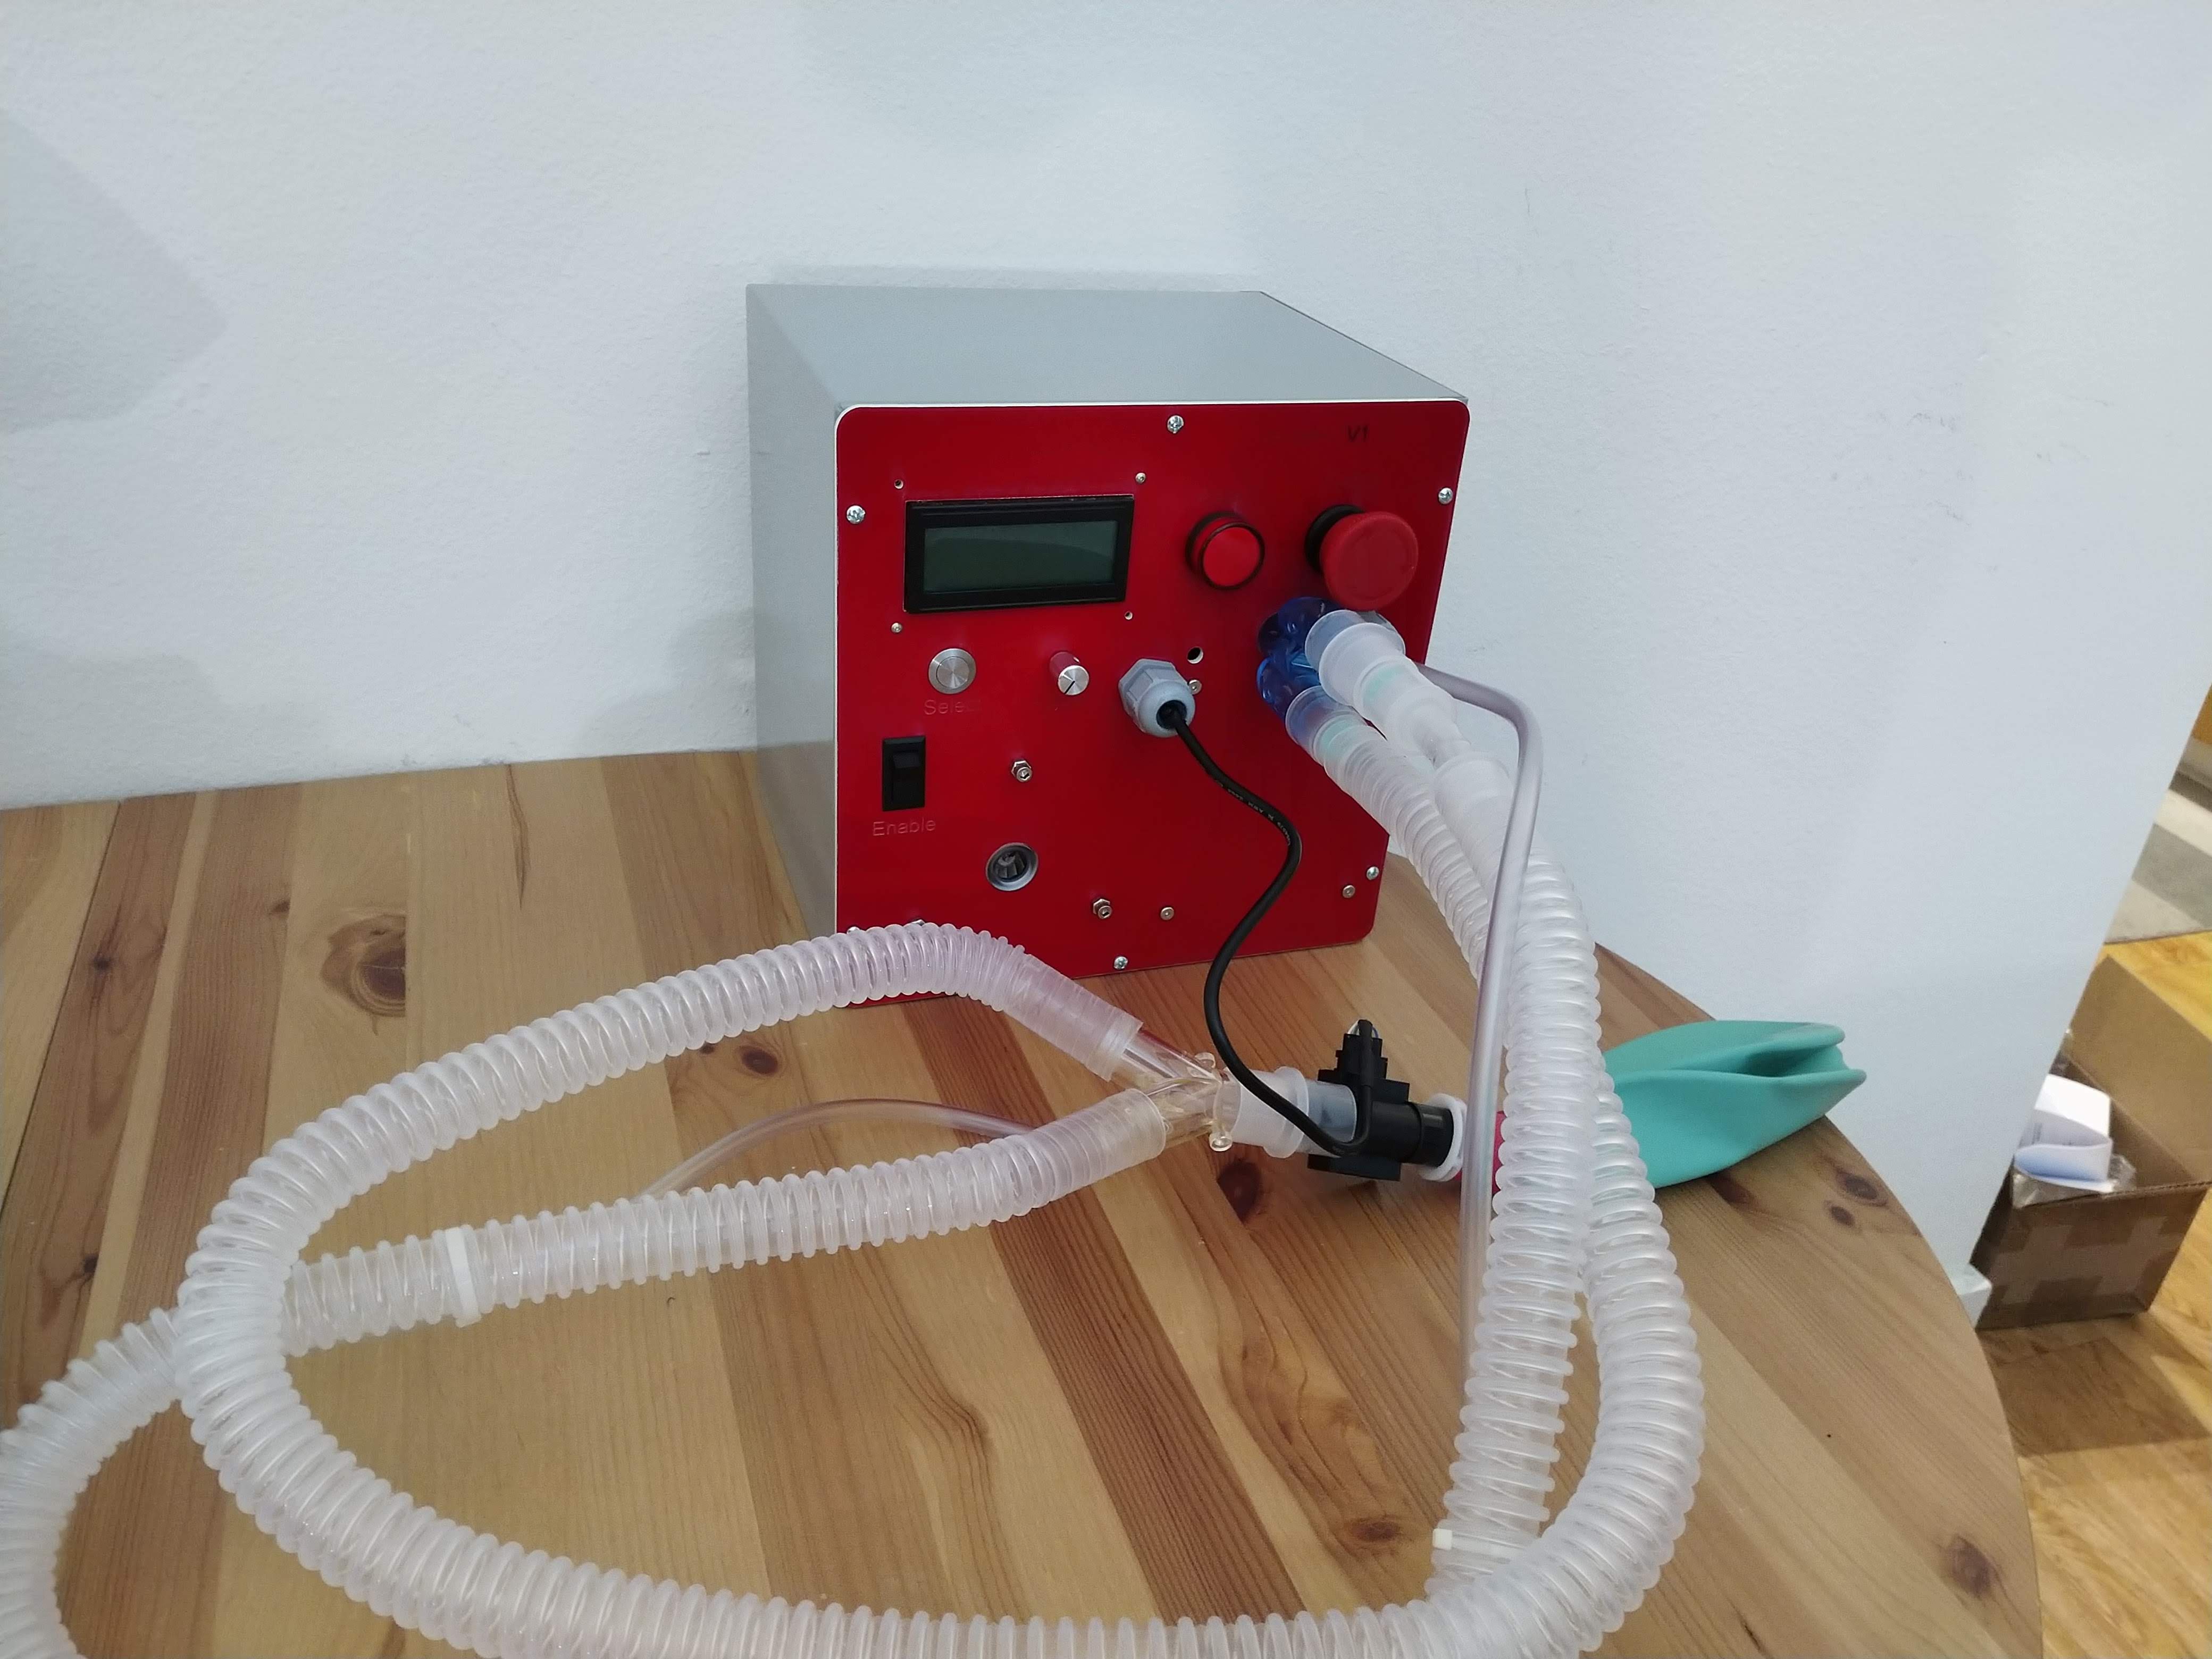
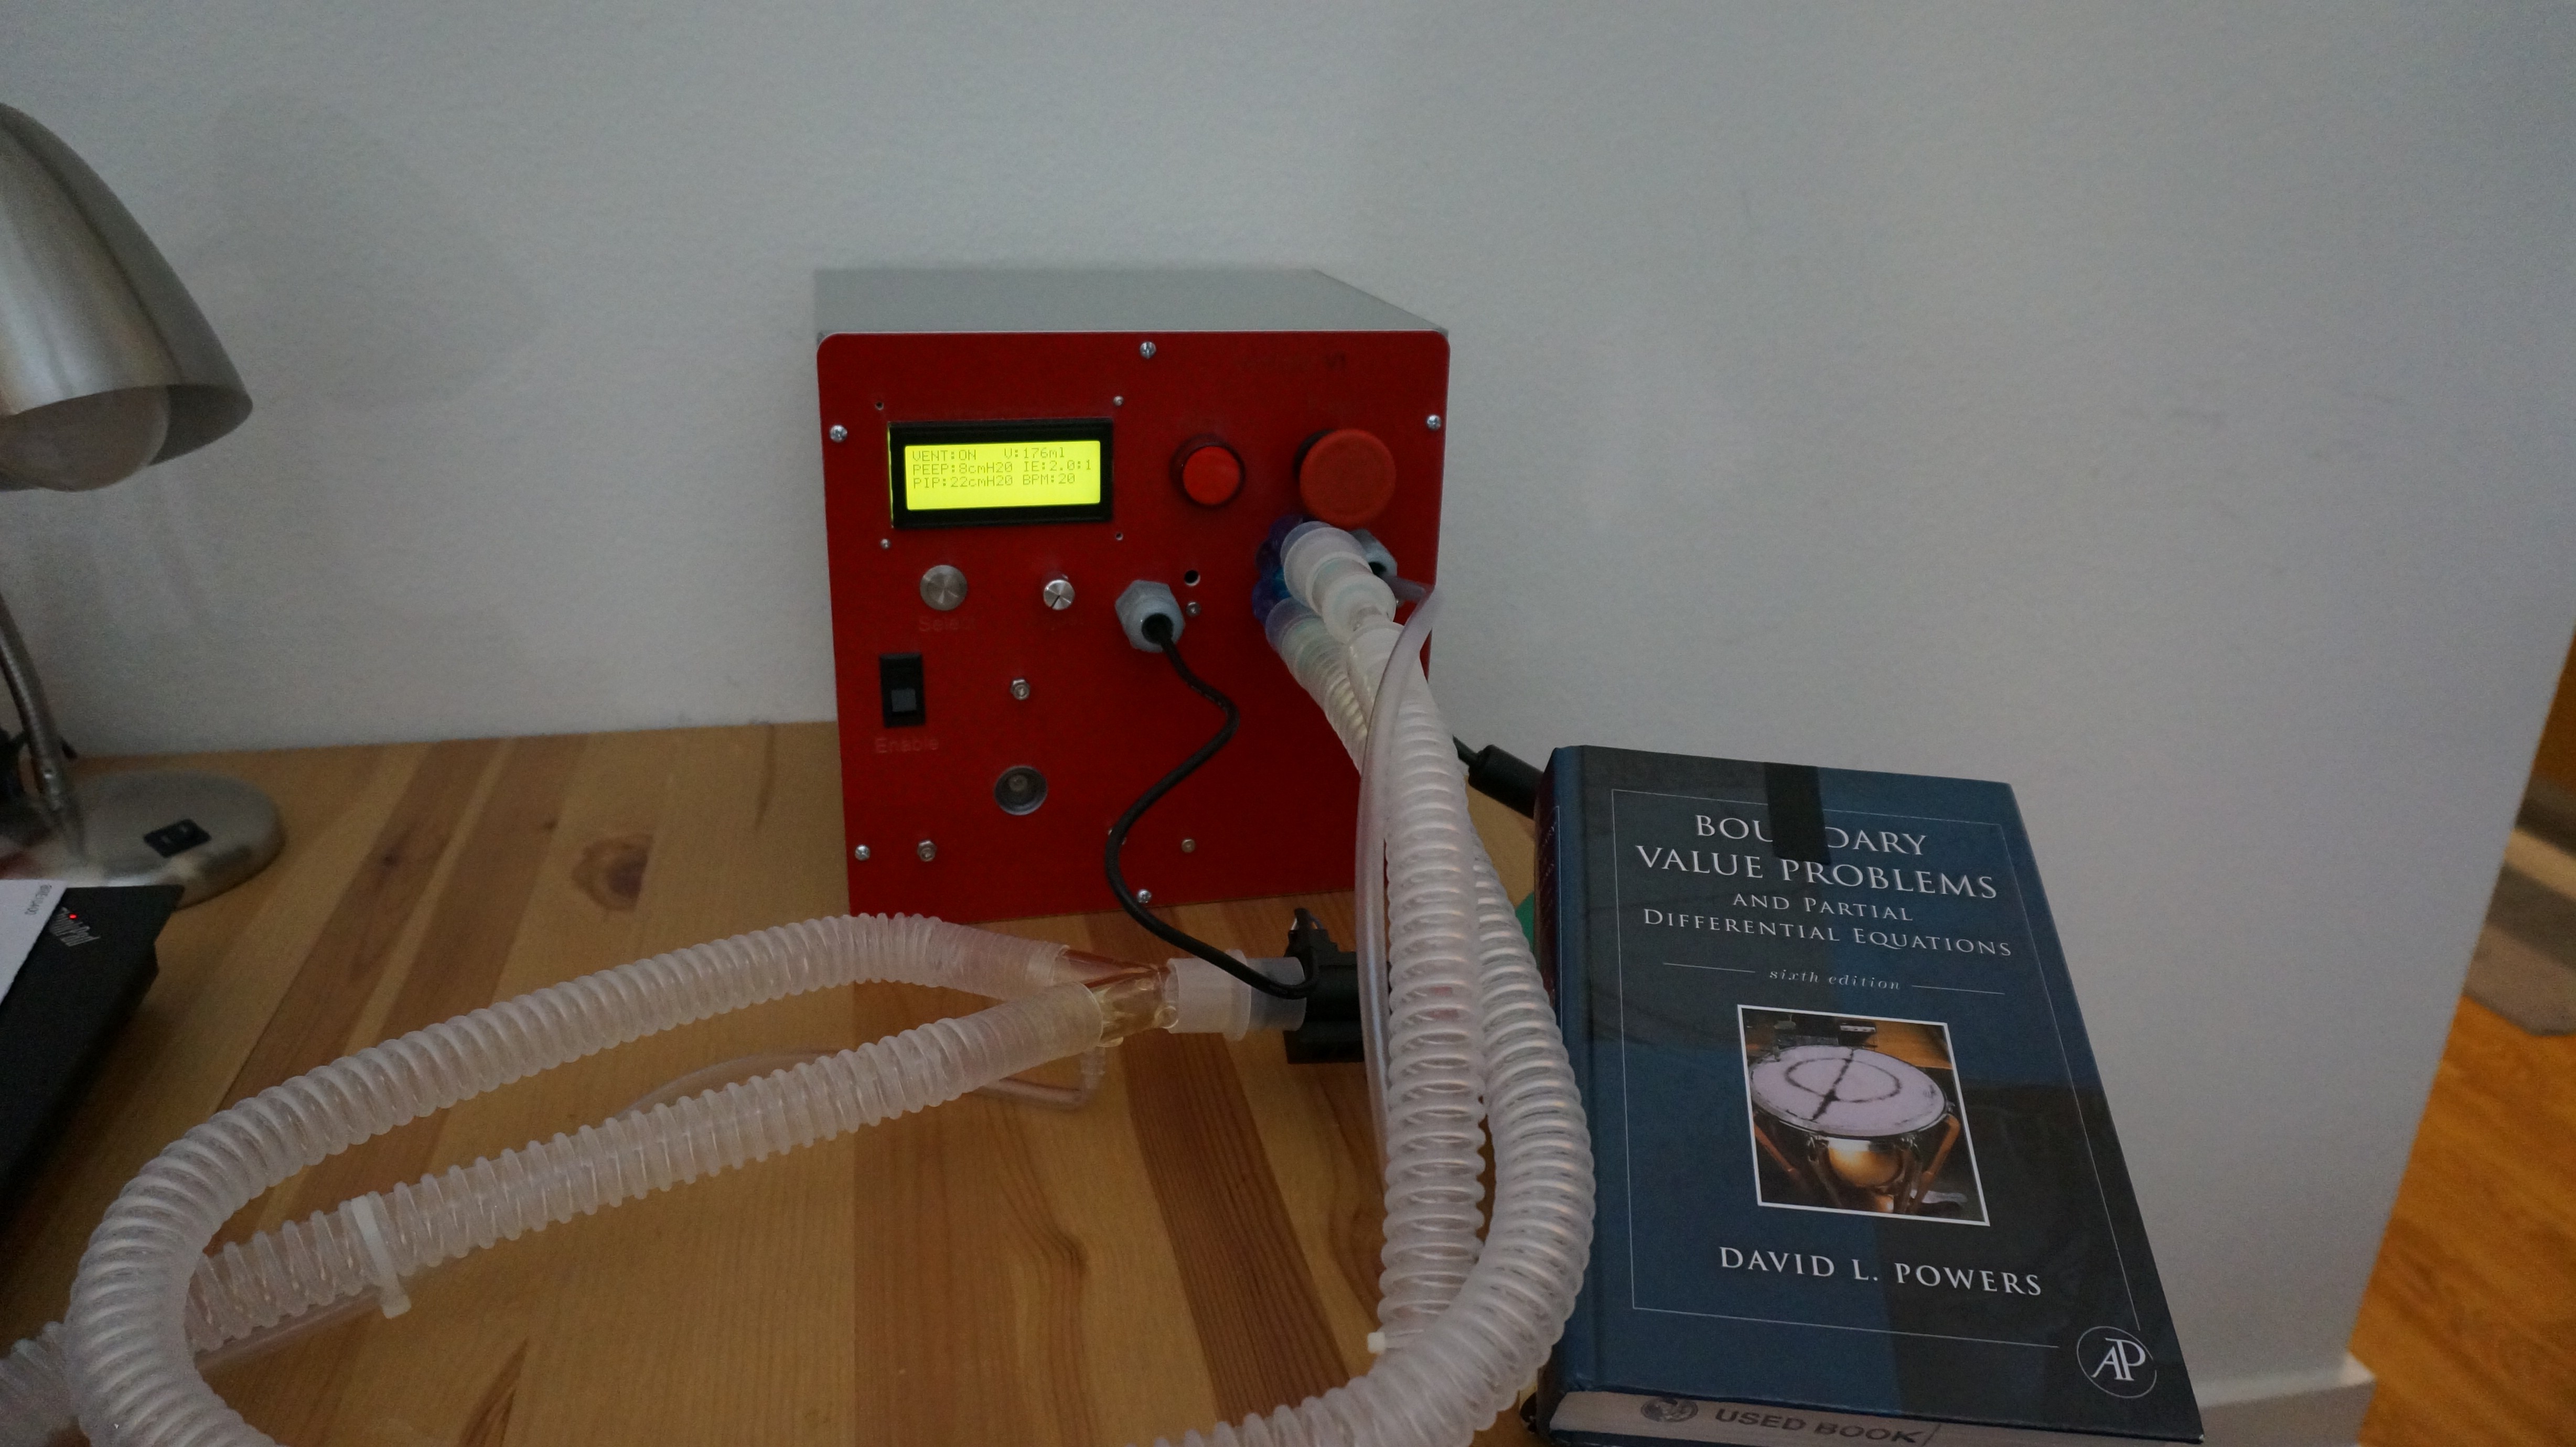
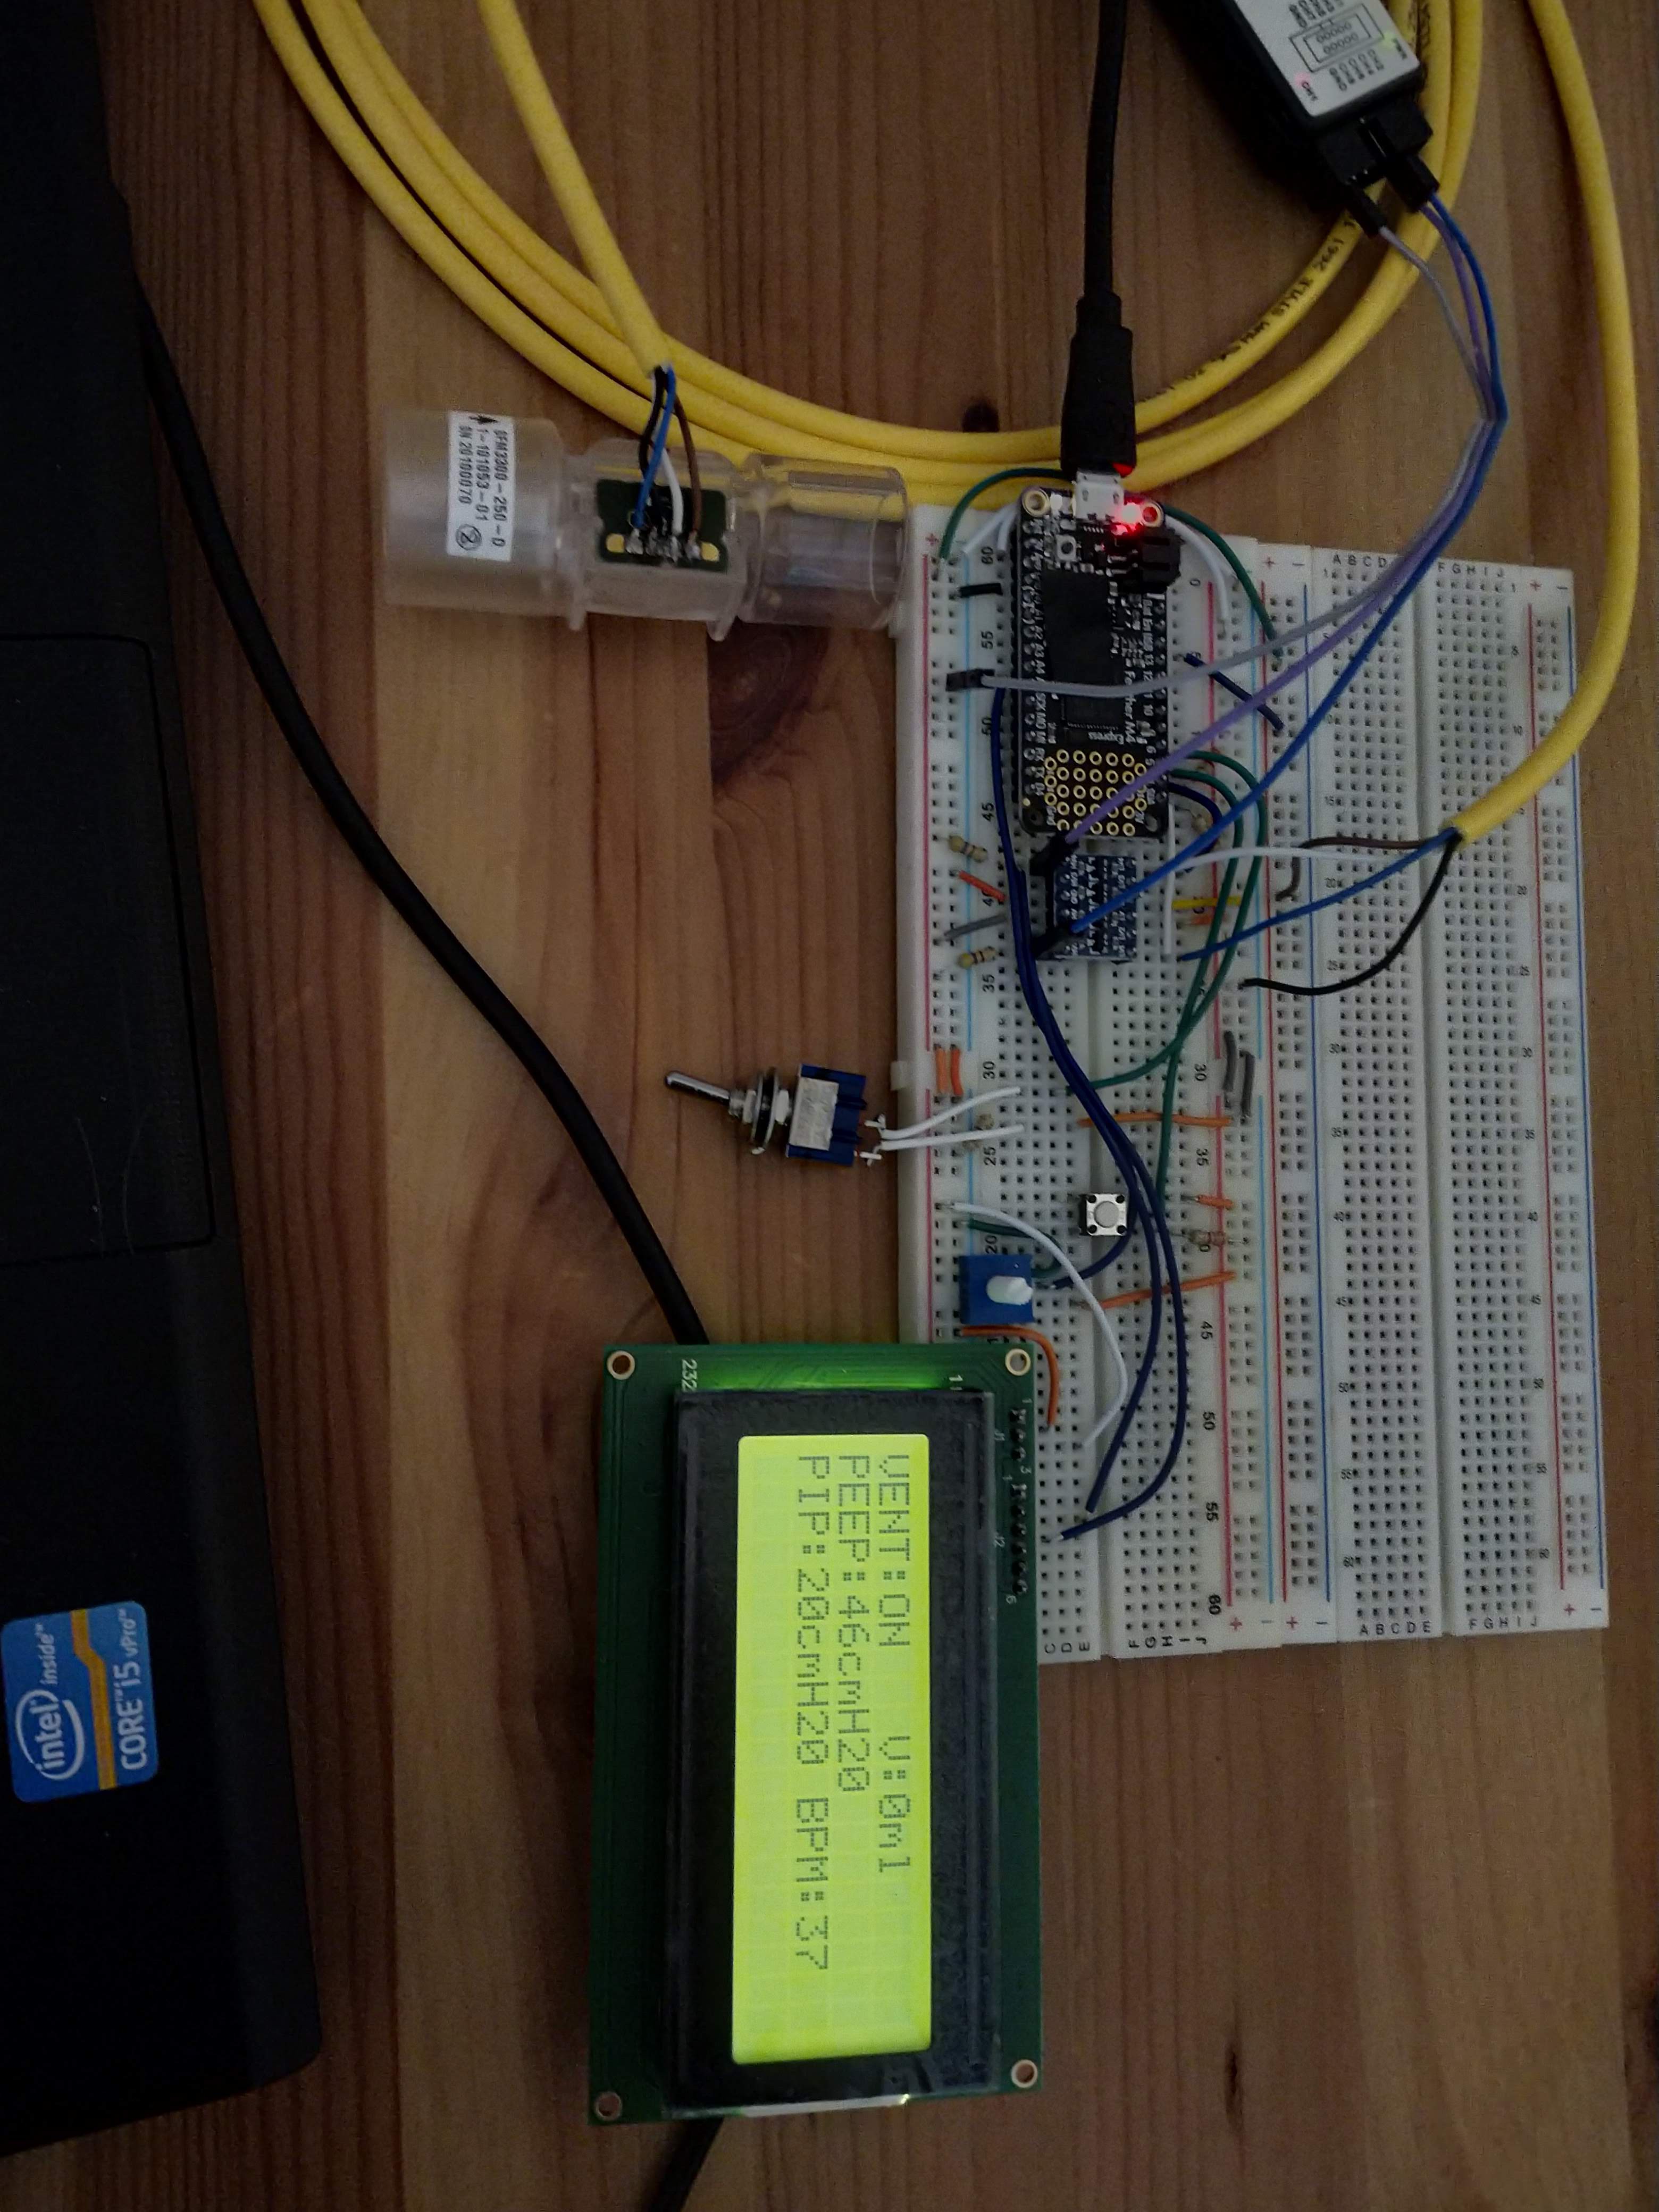
Vent in a BoxThe Ventilator has reached the point that it can be put inside its enclosure. From the beginning, our design was meant to have a single flat front panel that all custom parts would mount to. This panel would replace the panel on a COTS Hammond Industries metal enclosure. This makes assembly easy, fast, and the result looks fairly professional. The below images show it mounted inside the enclosure. Unfortunately there are still a few parts still on order for the air circuit, so it isn't quite right, but it's close enough for testing. Note the smaller hose leading from the Wye back into the vent. This provides pressure feedback back to the sensors inside, likely contributing to the control delay somewhat.
![]()
![]()
The system was powered up using its medical grade power supply (port hidden just behind the hoses in the picture below) and two (figuratively and literally) heavy textbooks were used to add some resistance to the "lung" during breathing. This is not a great dummy lung, but is cheap and available.
![]()
Finally, I made a demo video of the ventilator, embedded below. Note a few things in particular:
- On power up, the alarm buzzer and light turn on. They shut off when the system boots. The hardware that controls those are physically different from the microcontroller, and alarm by default. The microcontroller must periodically toggle a pin to that subsystem, or the alarm will sound. This is an important safety feature.
- All settings are entered through a pushbutton and knob. The brightness of the screen washes out the settings, but they are shown in real-time on the display. The display refreshes at over 30Hz. The use of an RTOS and non-blocking interrupt driven I2C interface to the display allows this.
- All settings are stored in non-volatile FRAM, and are loaded on boot. CRCs are used to check for data integrity. This means any unintended reboot (such as one triggered by its watchdog) will load the correct settings, and get back to normal operation quickly. In addition, settings remain constant over power cycles.
- This demo shows a slow and a faster breathing cycle. Although the controller isn't well tuned (see above issues with delays), the code does support a wide variety of settings.
Open Sourcing the CodeAlthough the system is still a work in progress, I decided to make the firmware repository public in case people want to dig in deeper or have suggestions. It can be viewed here: https://github.com/jwachlin/LCV
-
Low Cost Ventilator: First Breaths
05/30/2020 at 19:40 • 0 commentsAfter waiting for some further parts, we have now begun to assemble and test a simplified version of the breathing circuit. The real breathing circuit will include a hookup to an oxygen supply, check valves to manage the inspiratory and expiratory paths, virus filters, and a humidifier/heater. For this testing, we are mainly focused on a few goals:
- Testing basic motor control
- Basic control of speed and interfacing with the motor
- Implementation of pressure controller
- Testing pressure sensor feedback effectiveness
- Implementation and testing of flow sensor for tidal volume measurement
INITIAL MOTOR CONTROL
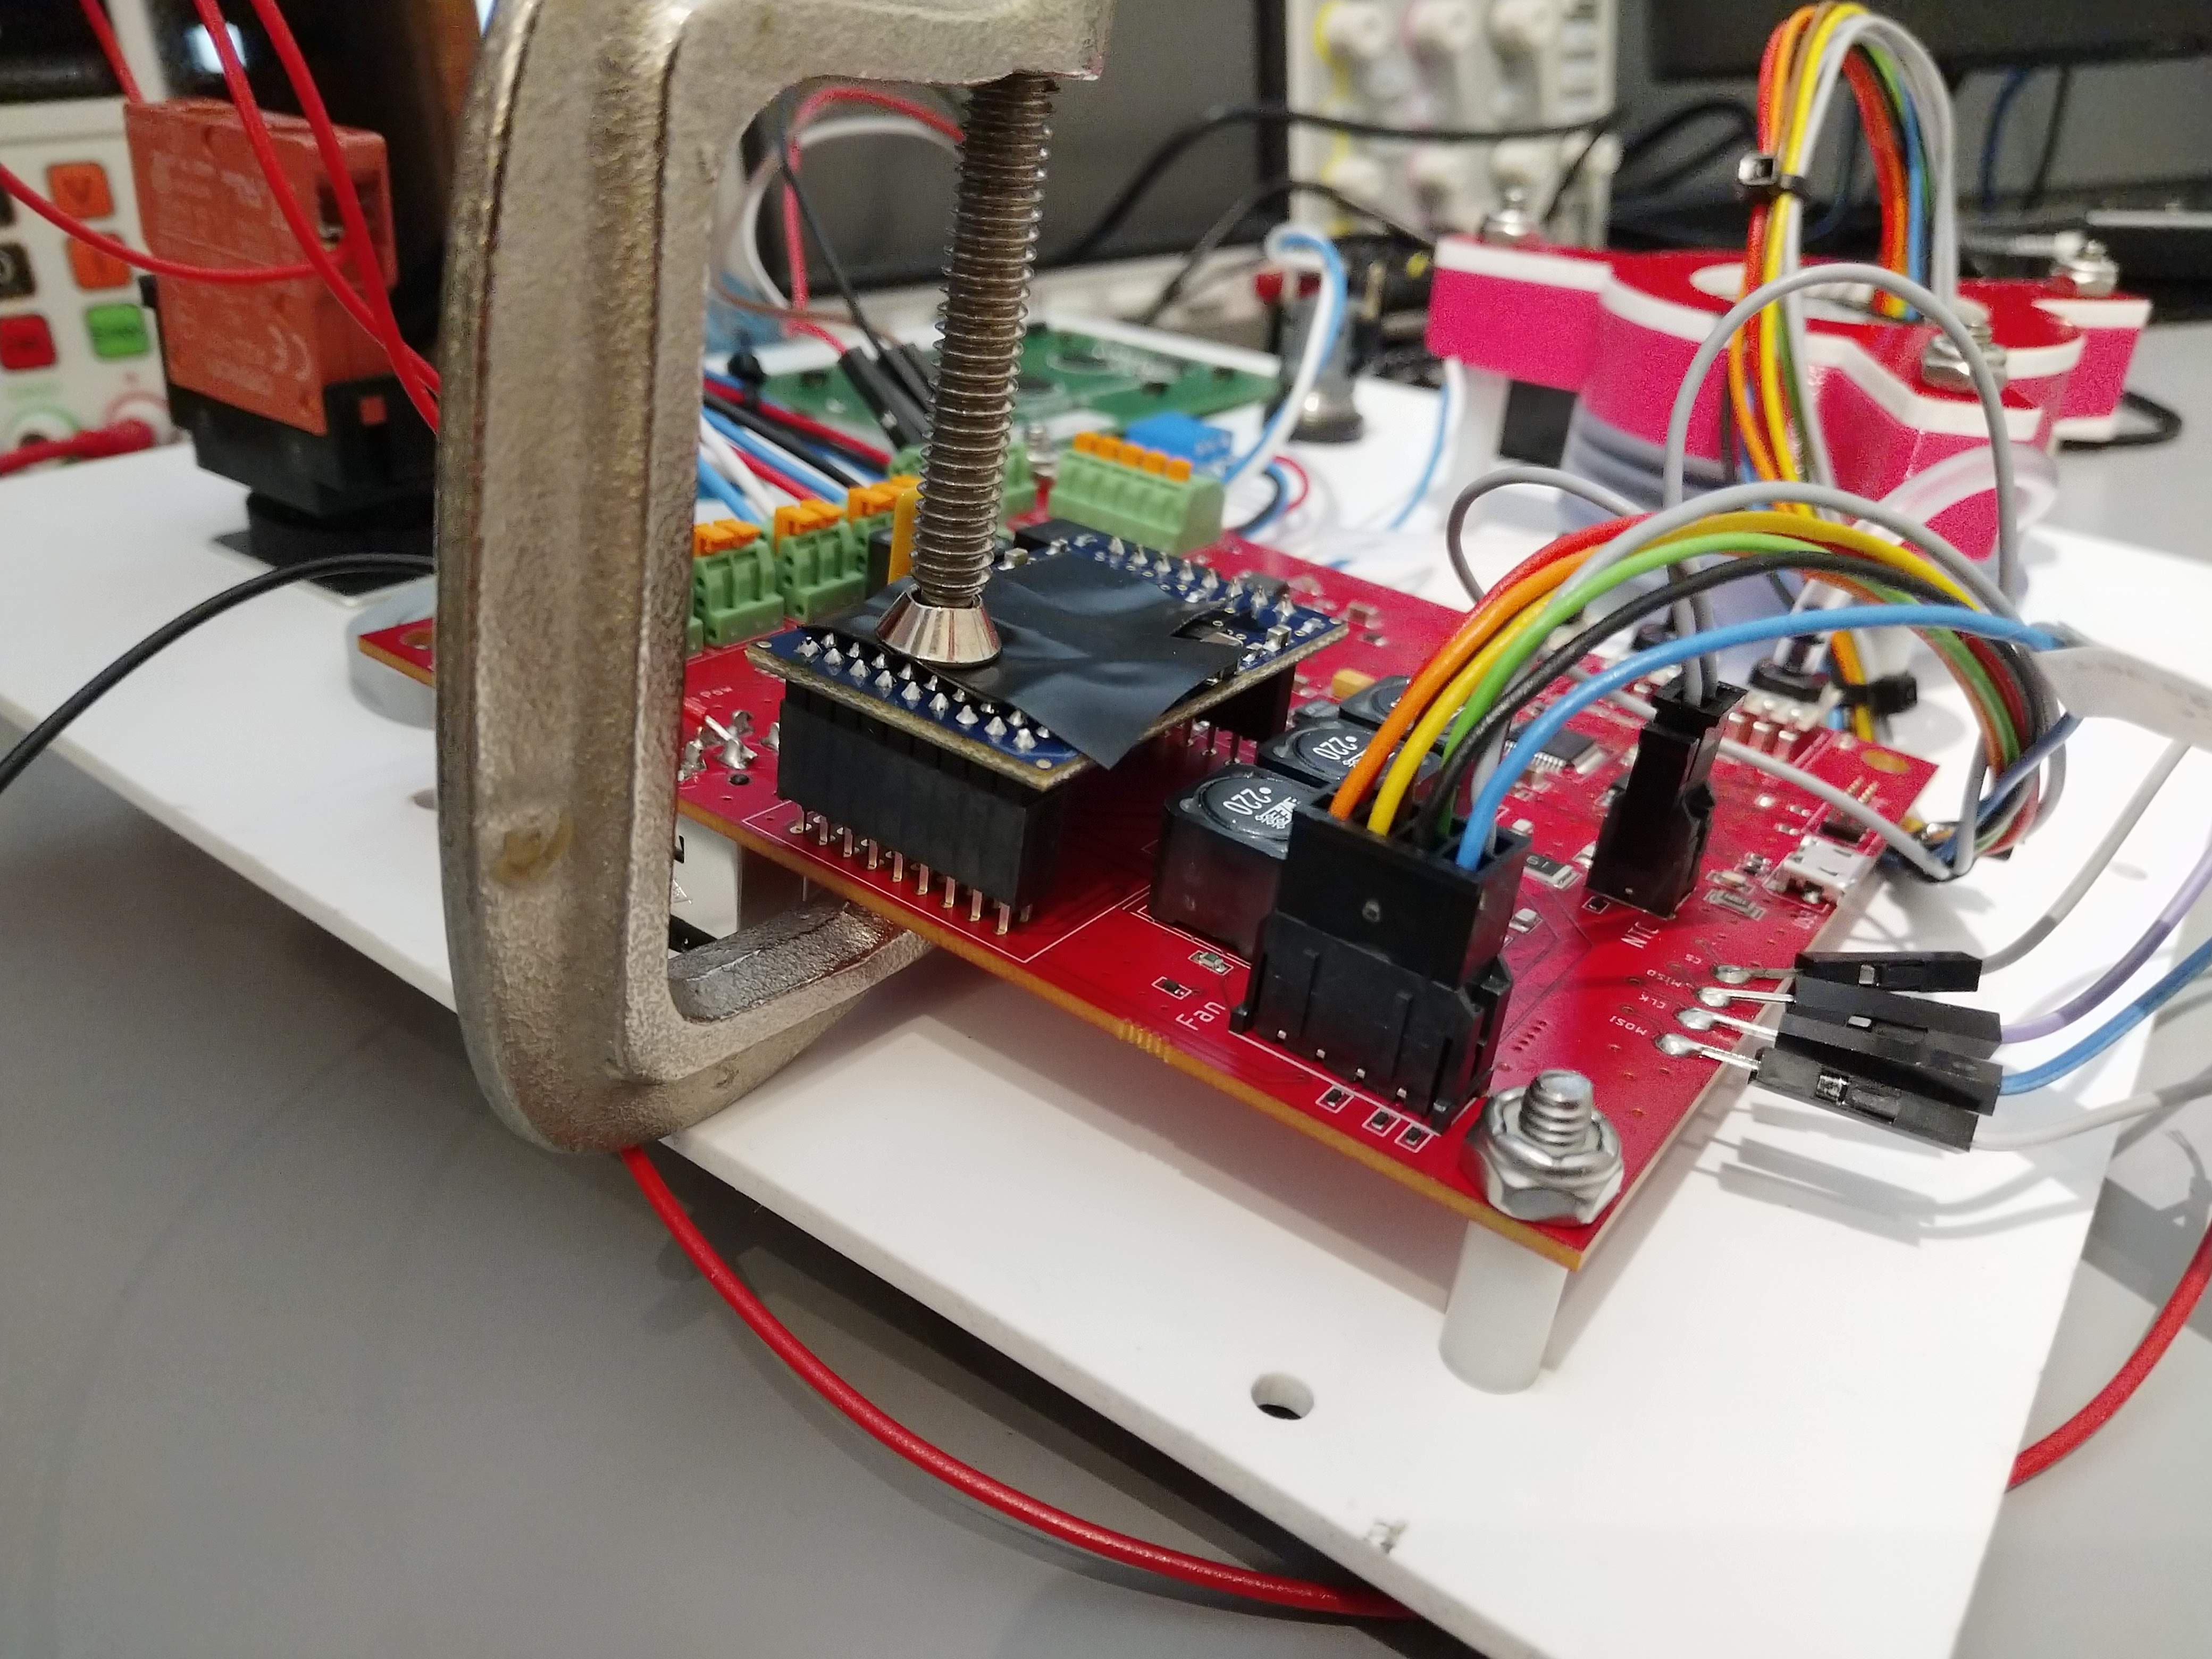
The main challenge to initially implementing motor control was a PCB design mistake related to the mounting of the brushless motor controller module. The design called for female header pins to be soldered onto our PCB and act as a socket for the module. Unfortunately, the drill size for all of the pads was too small, and the header pins would not fit through. We looked for alternative headers with smaller diameter pins, but were not successful. Ultimately, we ended up soldering the header pins "on top" of the pads, using the holes as alignment detents. With a few dozen pins, we figured it would be structurally sound enough for testing, and we could solder enough to be electrically OK. The picture below shows the controller module clamped in place in preparation for soldering it down.
![]()
The design called for Maxon's 380200 OEM brushless motor controller module. During original research, we had purchased an alternative from Anaheim Automation. While mostly pin-compatible, it was somewhat different. In particular, we used Maxon's controller in closed loop speed control mode, but the Anaheim Automation part was open loop only. In addition, the maximum speed of the Anaheim Automation part was not clear. This resulted in some issues.
During initial testing, things seemed OK. The pressure controller that we had designed was a PIDF controller. A trapezoidal pressure profile was generated based on the ventilator settings, and the controller would attempt to track measured pressure to that profile. The controller source can be seen below.
/*
 *    \brief Performs PIDF control
 *
 *    Has integral error range and anti-windup
 *    Has derivative filtering
 *    Note: this is a tracking controller, so "derivative" can somewhat abruptly change, need to be careful
 *
 *    \param control Pointer to the control structure defining the pressure profile
 *    \param params Pointer to the structure holding controller tuning parameters
 */
 static float pidf_control(lcv_control_t * control, controller_param_t * params)
 {
    static float error_integral = 0.0;
    static float error_derivative = 0.0;
    static float last_error = 0.0;

    float error = control->pressure_set_point_cm_h20 - control->pressure_current_cm_h20;

    float alpha = 0.7;
    error_derivative = alpha*(error-last_error) + (1.0 - alpha)*error_derivative;

    if(abs(error) < params->integral_enable_error_range)
    {
        error_integral += error;
        if(abs(error_integral * params->ki) > params->integral_antiwindup)
        {
            error_integral    = (error_integral/abs(error_integral)) * (params->integral_antiwindup) / params->ki;
        }
    }
    else
    {
        error_integral = 0.0;
    }

    float output = params->kf * control->pressure_set_point_cm_h20 +
                    params->kp * error +
                    params->ki * error_integral +
                    params->kd * error_derivative;

    if(output > params->max_output)
    {
        output = params->max_output;
    }

    if(output < params->min_output)
    {
        output = params->min_output;
    }

    last_error = error;
    return output;
 }
For testing of the code originally, we had set it up to have only non-zero feedforward gain. The motor controller modules are controlled with an analog signal from the MCU's DAC. In other words, the MCU was initially outputting a voltage linearly proportional to the desired control pressure. I could then look at that signal on the scope to ensure the trapezoidal pressure profile was being properly generated. For initial motor testing, the controller was left this way, and the motor spun up and slowed down appropriately.
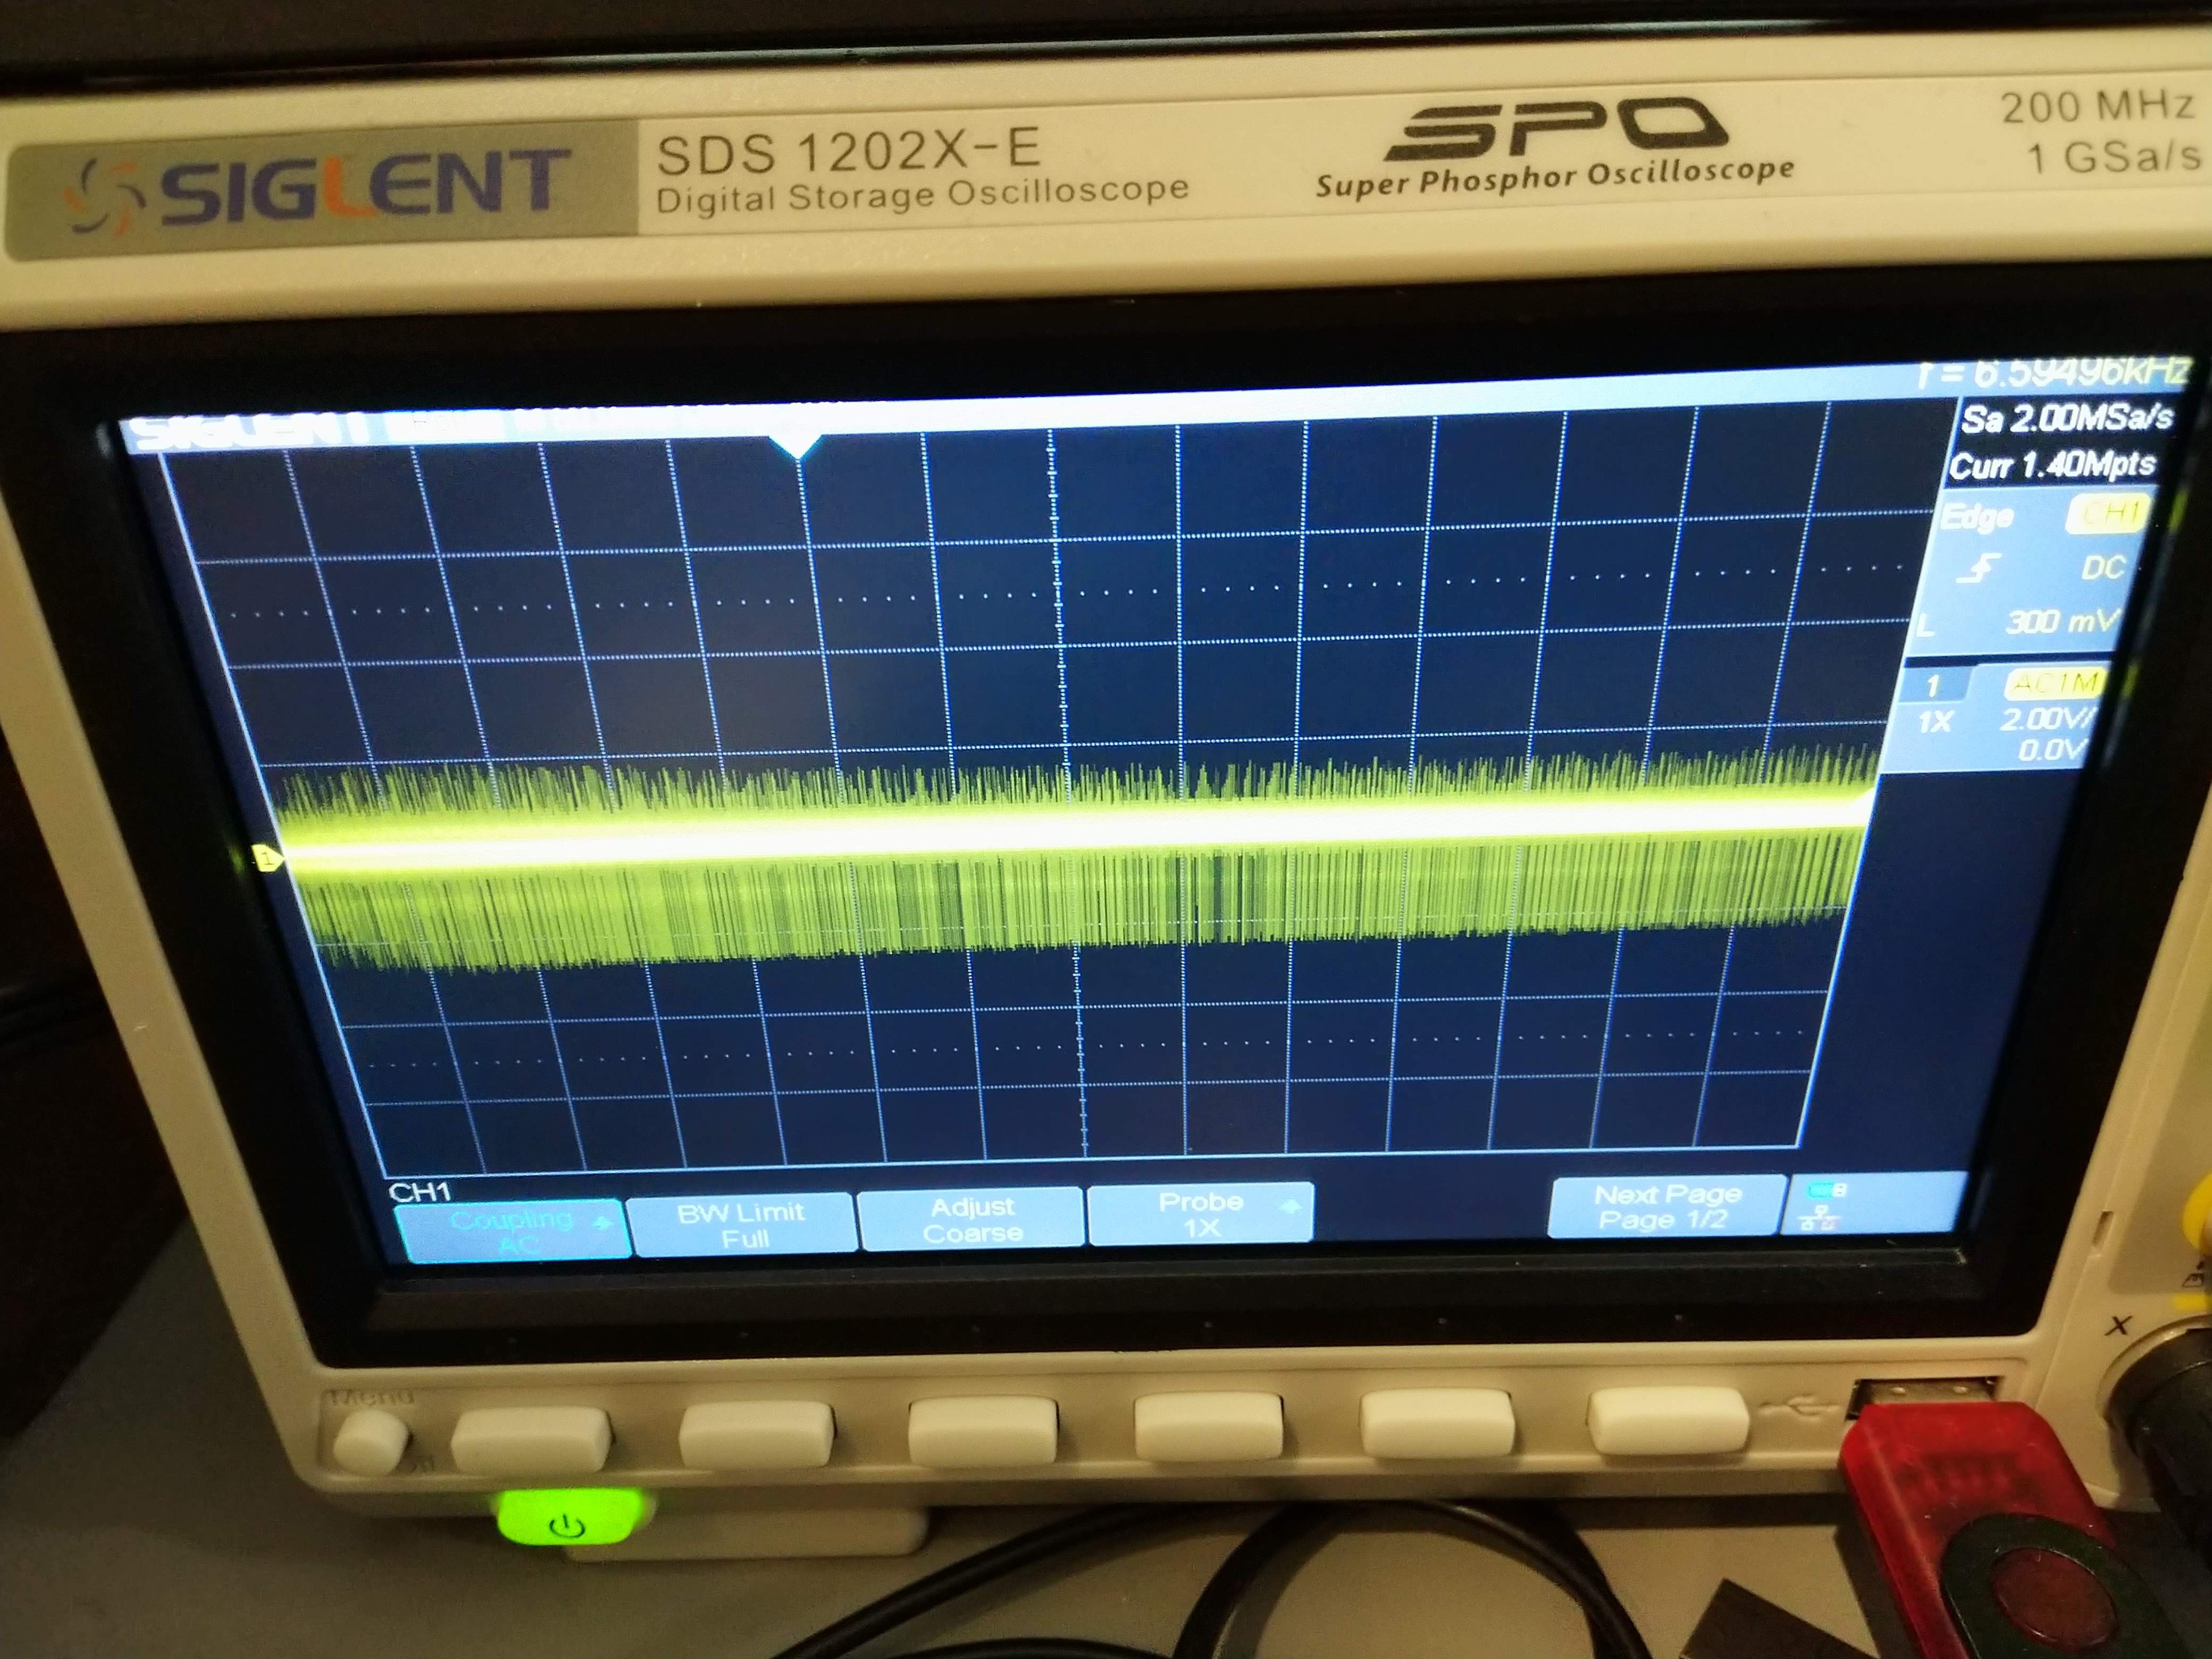
However, as I began to tune the controller, issues arose. I discovered an odd issue where if I increased control gains a small amount, the motor would twitch slightly, and the whole system would reset. The symptoms seemed to indicate a power issue. Indeed, it turned out the instantaneous control effort would be increased enough to cause noise on the power rails that would reset the system. This was of course, very concerning, but odd since we had followed the recommended design for Maxon's motor controller. By heavily filtering the motor command, the system could avoid such spikes, with reduced ability to track. The image below shows the 24V power rail, AC coupled, when the motor was started. Clearly there is a lot of noise.
![]()
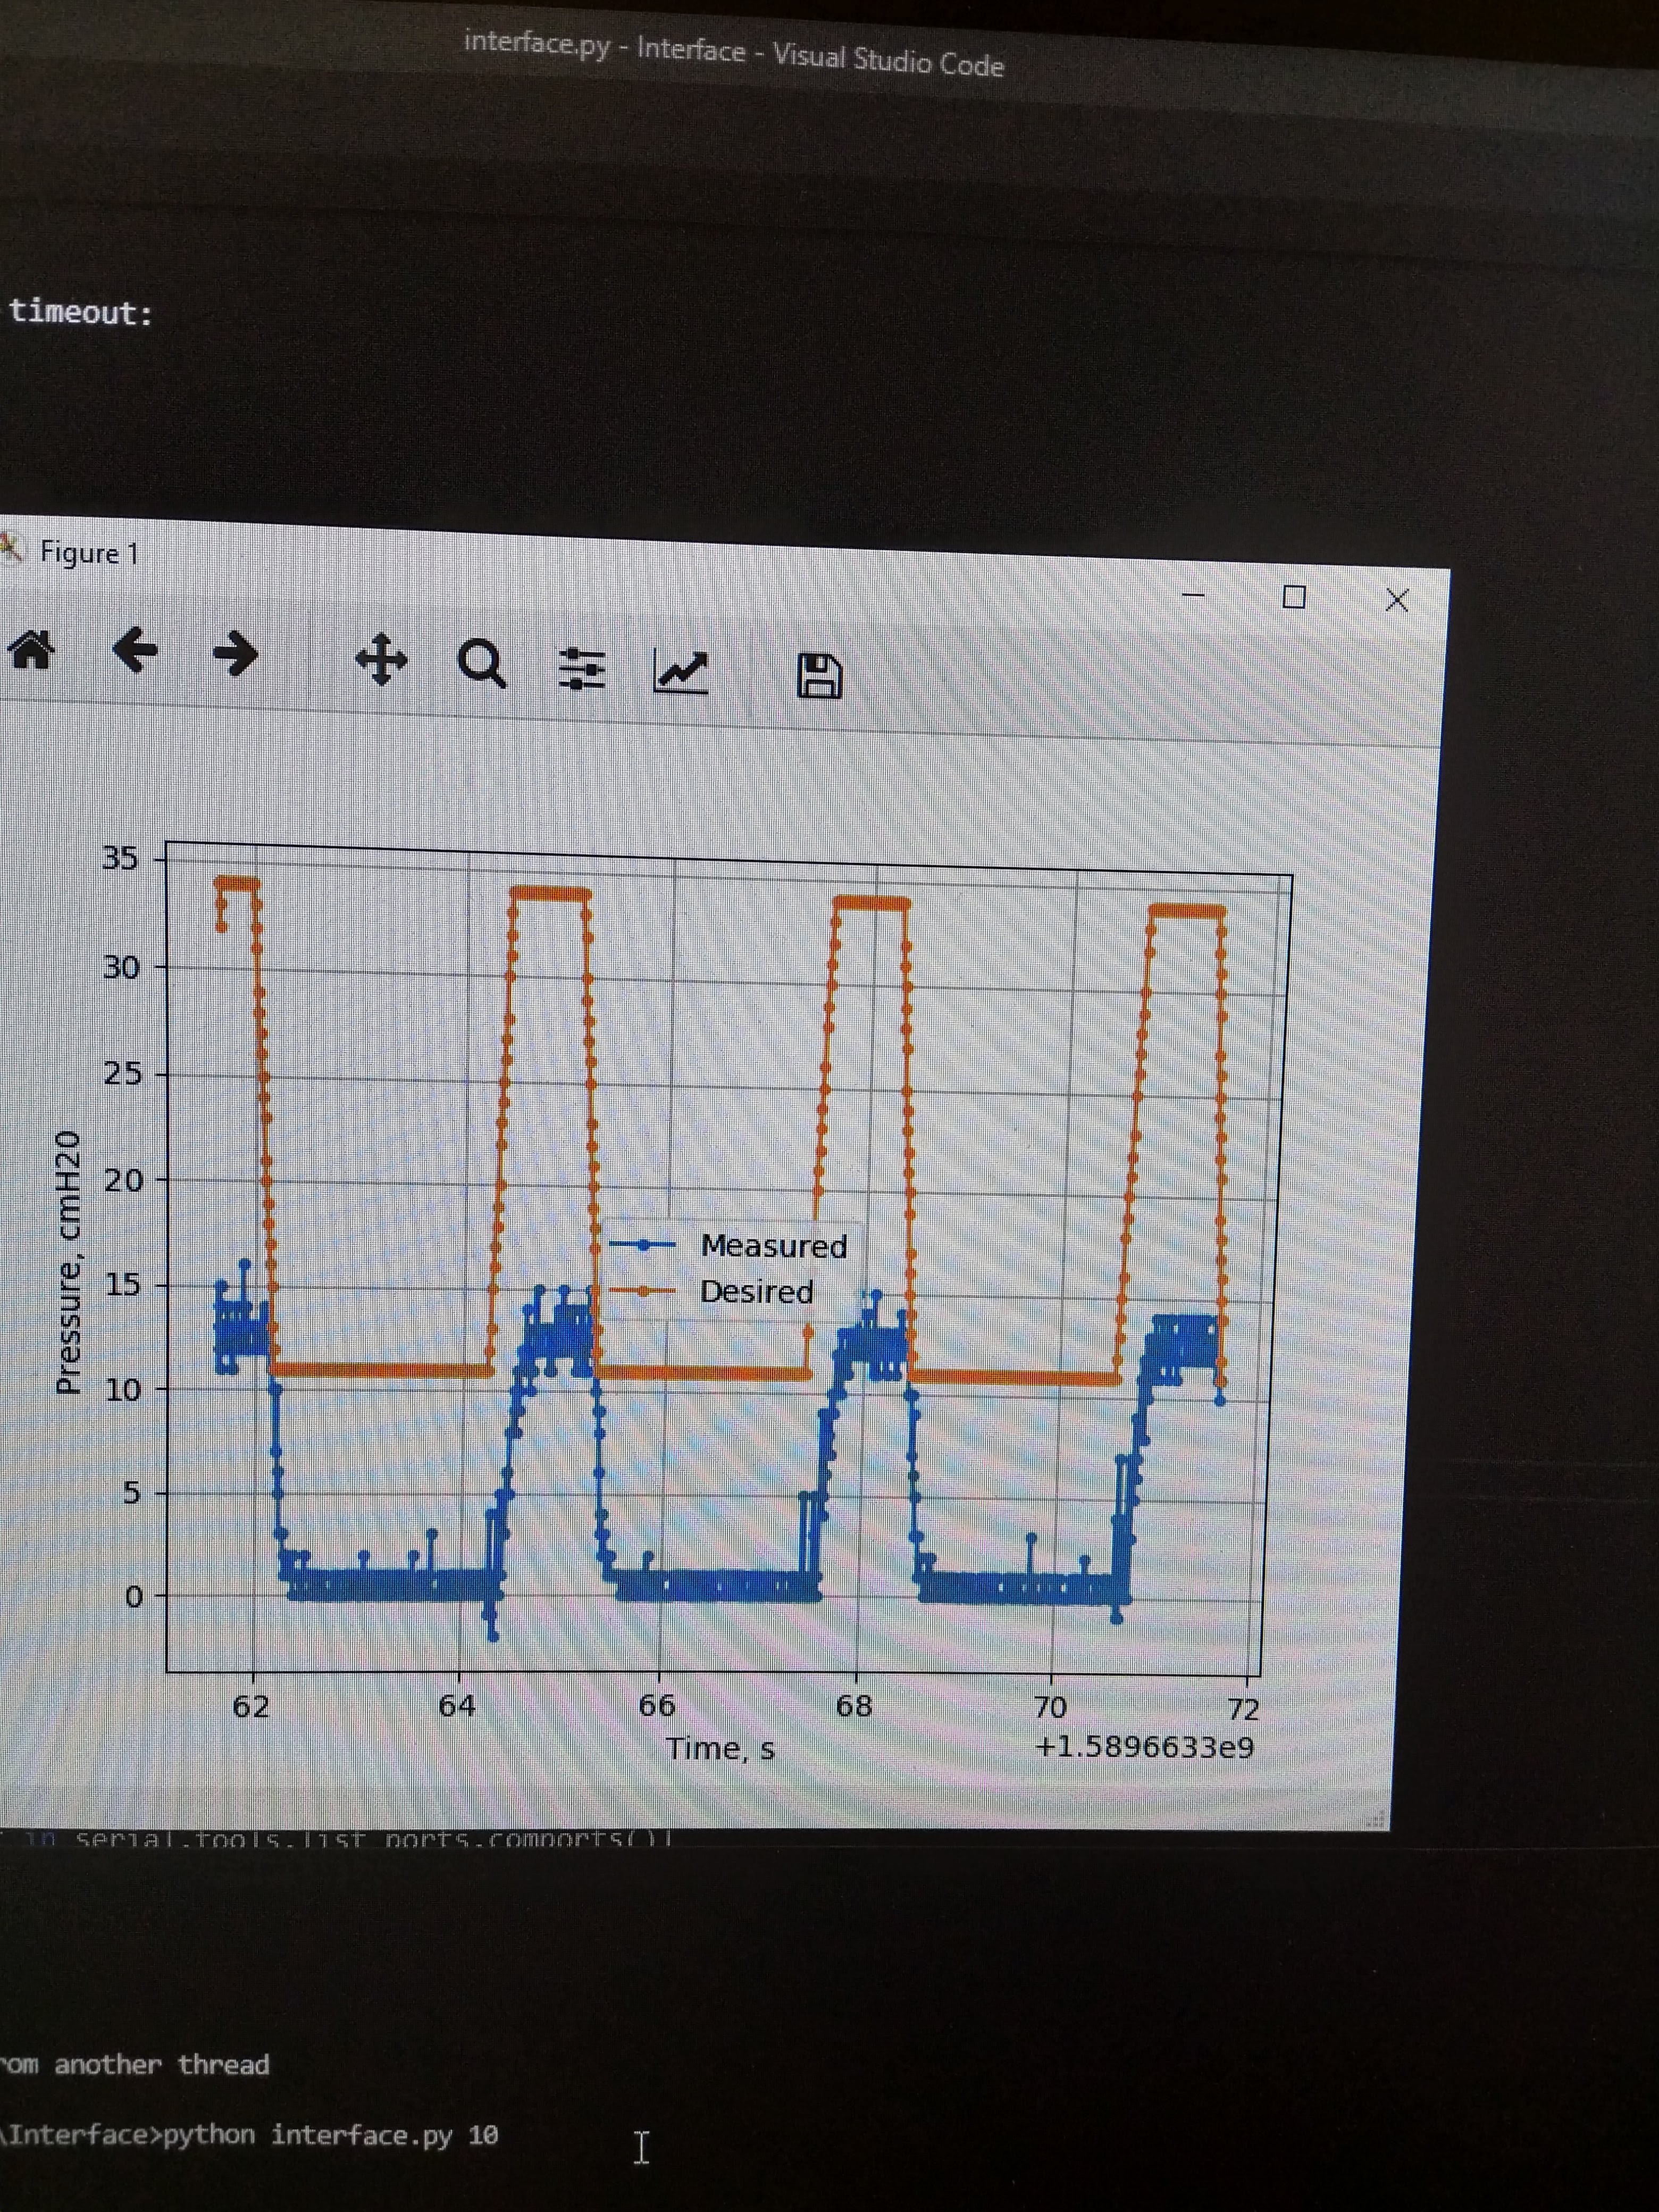
However, we also discovered another issue: the system was not able to reach high enough pressure. I built a Python interface to communicate with the ventilator over USB so the controller could be tuned. On one test with the original Anaheim Automation speed controller, the following pressure profile was seen (pardon the picture of a screen.) The lag is clear (and will be discussed later), but also the peak measured pressure was only about 12 cmH2O, far too low to be useful. We bought the Maxon speed controller to see if these issues would be resolved.
![]()
The Maxon speed controller instantly showed major improvements. Control parameters that previously would have caused a reset, no longer did. The peak pressure also substantially increased. In preparation for more detailed controller tuning, I set up the air circuit to use all three pressure sensors, with appropriate averaging, outlier detection, and filtering. The image below shows all three sensors connected to the patient circuit.
![]()
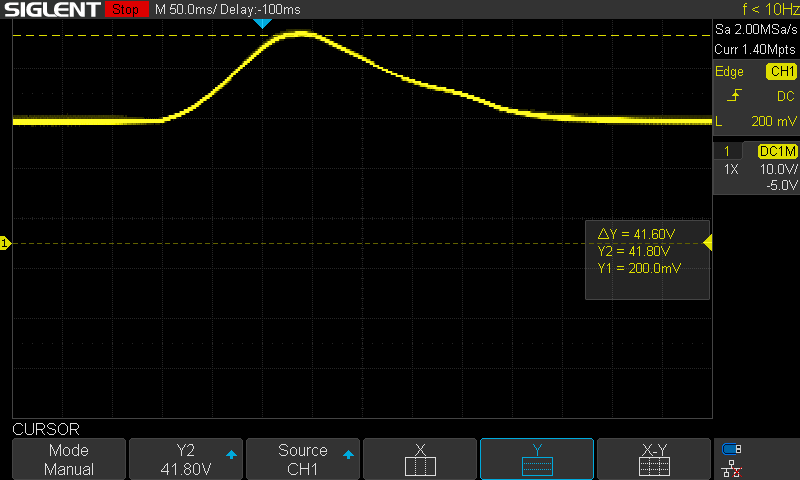
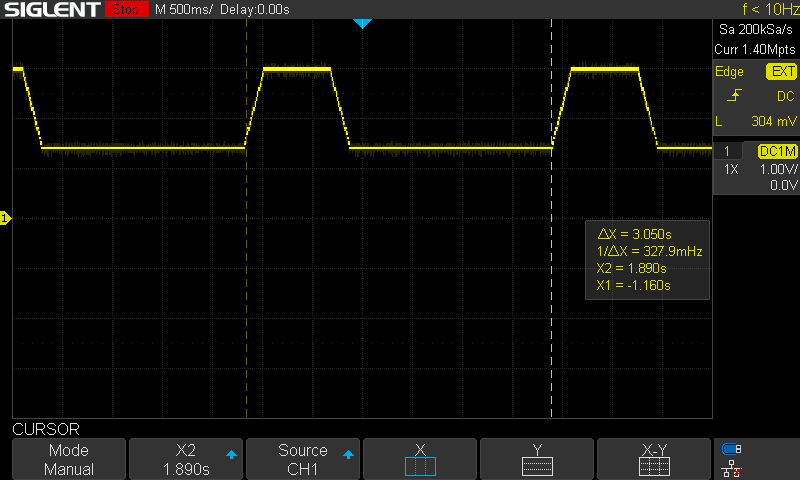
Unfortunately, the issues were not all gone. While the system would no longer reset when spinning up the blower, if it was spun down too fast the system would reset. While connected to 24V power from my switching lab bench PSU, I watched the voltage on the scope as the motor would turn off in these situations. The spike was much smoother and higher than I expected. The voltage spiked up to about 42V over about 350ms. I am actually surprised this did not (at least noticeably) damage other parts. Oddly, with minor re-tuning so that the controller ramps down more slowly, no spike at all is seen.
![]()
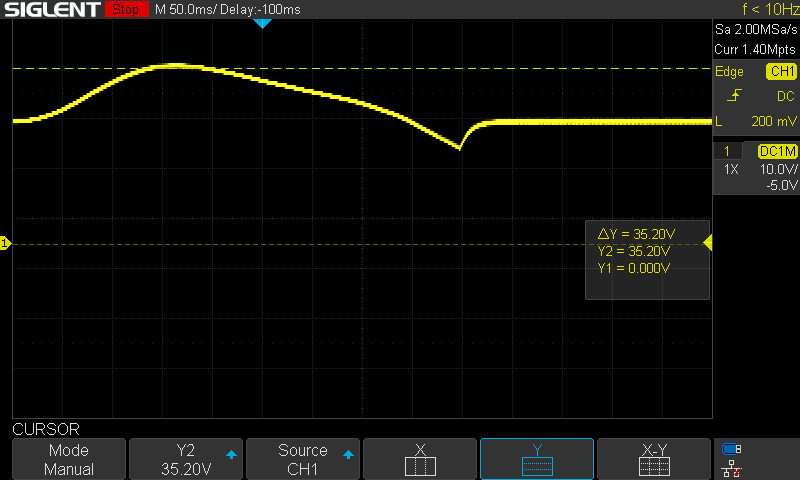
I was concerned that this could be a power supply issue potentially. Perhaps the dynamics of the motor was negatively interacting with the switching controller of my PSU. I therefore powered the system using its intended medical grade AC-DC power brick. The same issue was seen, although the profile of the spike is different. The spike was up to 35V, with a dip afterwards.
![]()
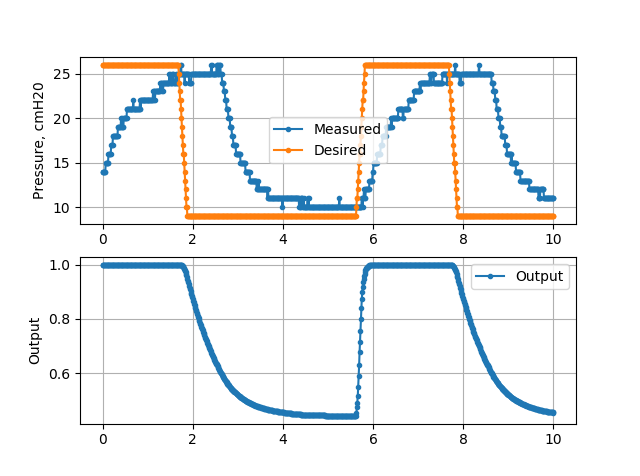
The best solution to this problem is still unknown, but since the motor ramp up is no longer an issue, I changed the command filtering based on whether the command is increasing or decreasing. It can now ramp up much faster than it can ramp down. For rather slow breathing settings, the profile is shown below. As can be seen here, the maximum pressure is now about 25 cmH20. Although the command ramps up rapidly to full effort (1.0), the pressure increases fairly slowly. Indeed, the pressure rise time constant appears fairly similar to the ramp down. It is not clear yet why this is. Perhaps the closed loop speed control on the Maxon motor is limiting this.
![]()
Significant lag from command change to measured pressure change is also visible here. For a pressure control system, this is not unexpected. We are compressing air, and must wait for the wave to propagate through the system to the sensor. For simple PIDF controllers, pure lag can be destabilizing, so we must be careful. For example, the below image shows a pure proportional controller. The lag induces undesirable oscillations. It is not unstable, but indicates the challenge.
![]()
The slow pressure response becomes a challenge for faster breathing settings. The image below is set to 30 breaths per minute with a PF controller. Regardless of poor tuning, the pressure clearly does not decay fast enough to reach a steady state before the next inhalation begins.
![]()
For 20 breaths per minute, we can get a bit better, but the lag is still a major challenge. We are clearly not creating the desired trapezoidal pressure profile.
![]()
Tidal Volume EstimationIn addition to pressure control, our ventilator provides tidal volume monitoring using integrated measurements from a mass flow sensor. We have tested the Sensirion SFM3300 sensor previously, and it seemed to work well. However, it is out of stock everywhere. We therefore designed for the Siargo FS6122 sensor, which has thousands in stock. The specifications are quite similar, but the I2C interface is different. We set up this sensor on its own SERCOM I2C, and wrote the interface to be fully interrupt driven and non-blocking. Since we are measuring tidal volume by integrating flow rate, drift is expected. We therefore want to reset the estimation at each cycle, and not track over a long time. The currently implemented algorithm is simple and a work in progress but does work most of the time. It detects flow transitions from in to out and out to in (filtered and with hysteresis to reduce failures), and uses those transitions to estimate each cycle. Once we better understand the lag in the system, we can also use the controller information to determine each cycle. For now, however, it seems to work. The video below shows a few cycles into a rough dummy lung consisting of an elastic bag with weight on top. Note this setup is not intended to be a realistic lung, but rather provide some resistance to the flow so the tidal volume estimator can be tested. It is quite consistent.
- Testing basic motor control
-
V1 Build and Testing: Log #1
05/09/2020 at 19:18 • 0 commentsA few weeks back, we made a bunch of orders for parts, including our assembled PCB. This week, the hardware finally arrived and we have been hard at work assembling and testing! So far, the focus has been on testing of the PCB, getting the firmware up and running on it, and addition of firmware features which were not easy to test on the breadboard version since that version did not have all of the necessary components.
For cost and timeline reasons, we had only the surface mount components assembled for us, and left the through hole components for us. The board was built by Macrofab, who I have used for many projects and highly recommend. Their boards have always been high-quality, their price is great, and their UI is really easy to use.
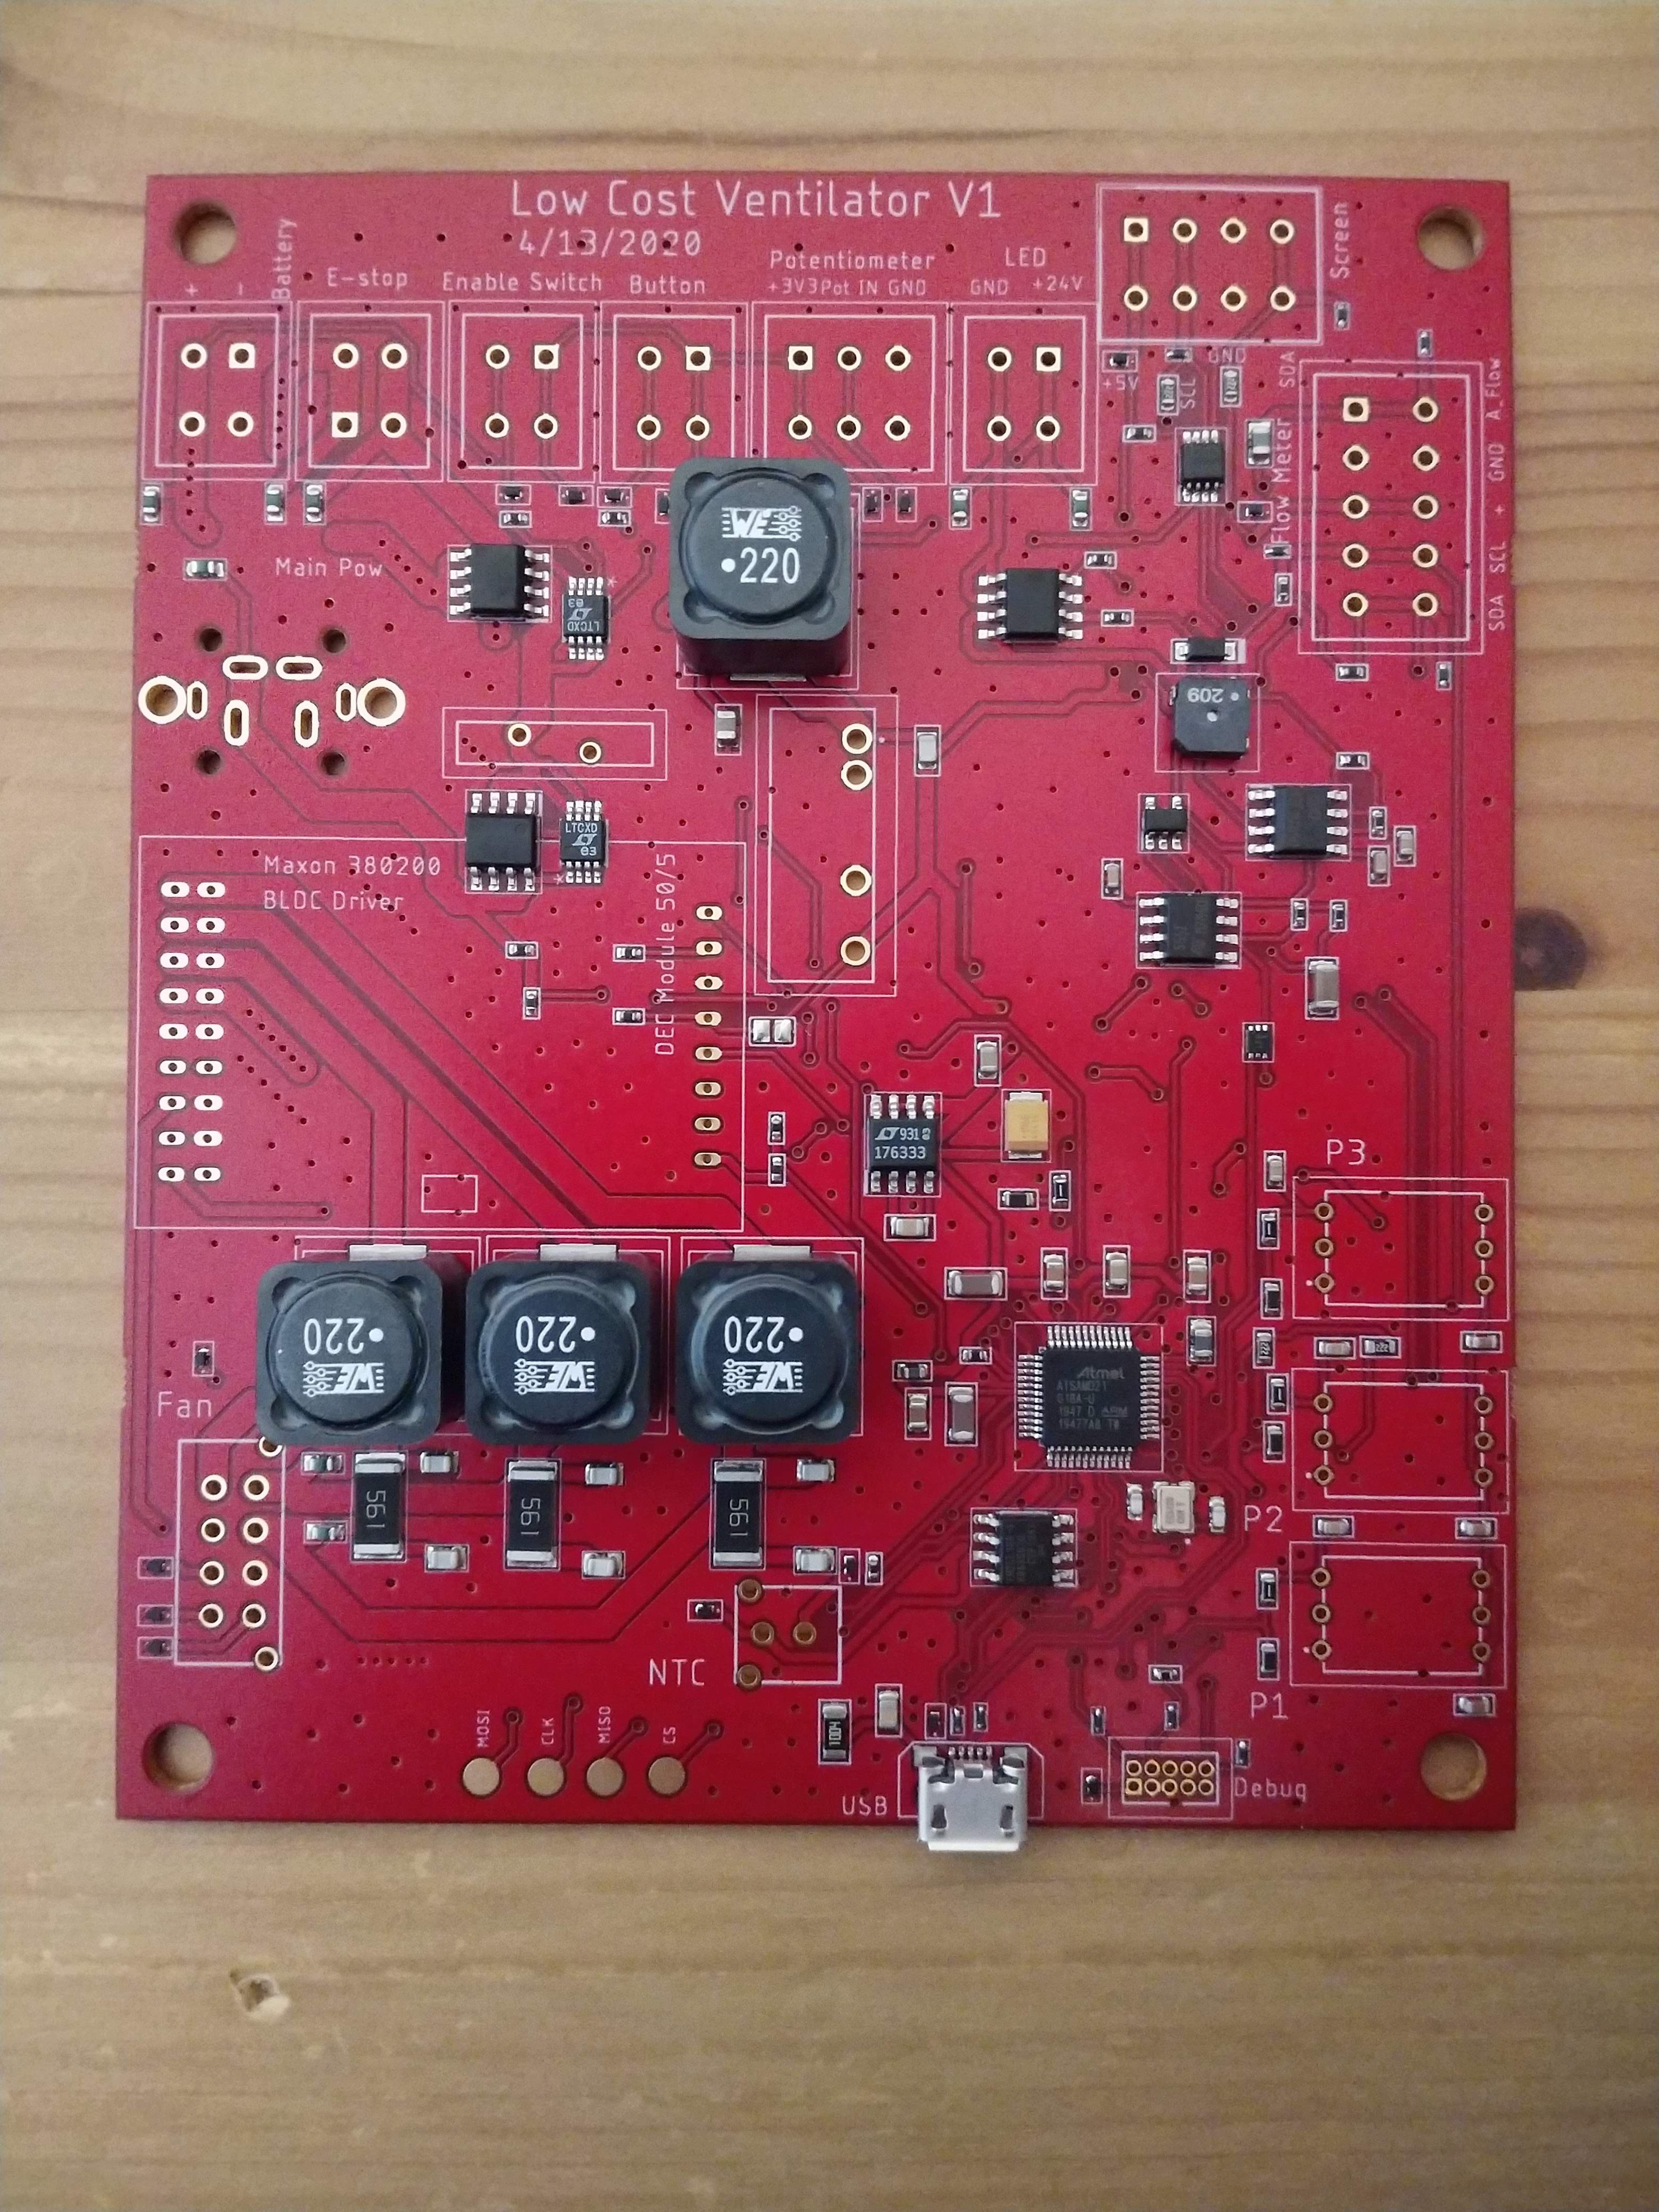
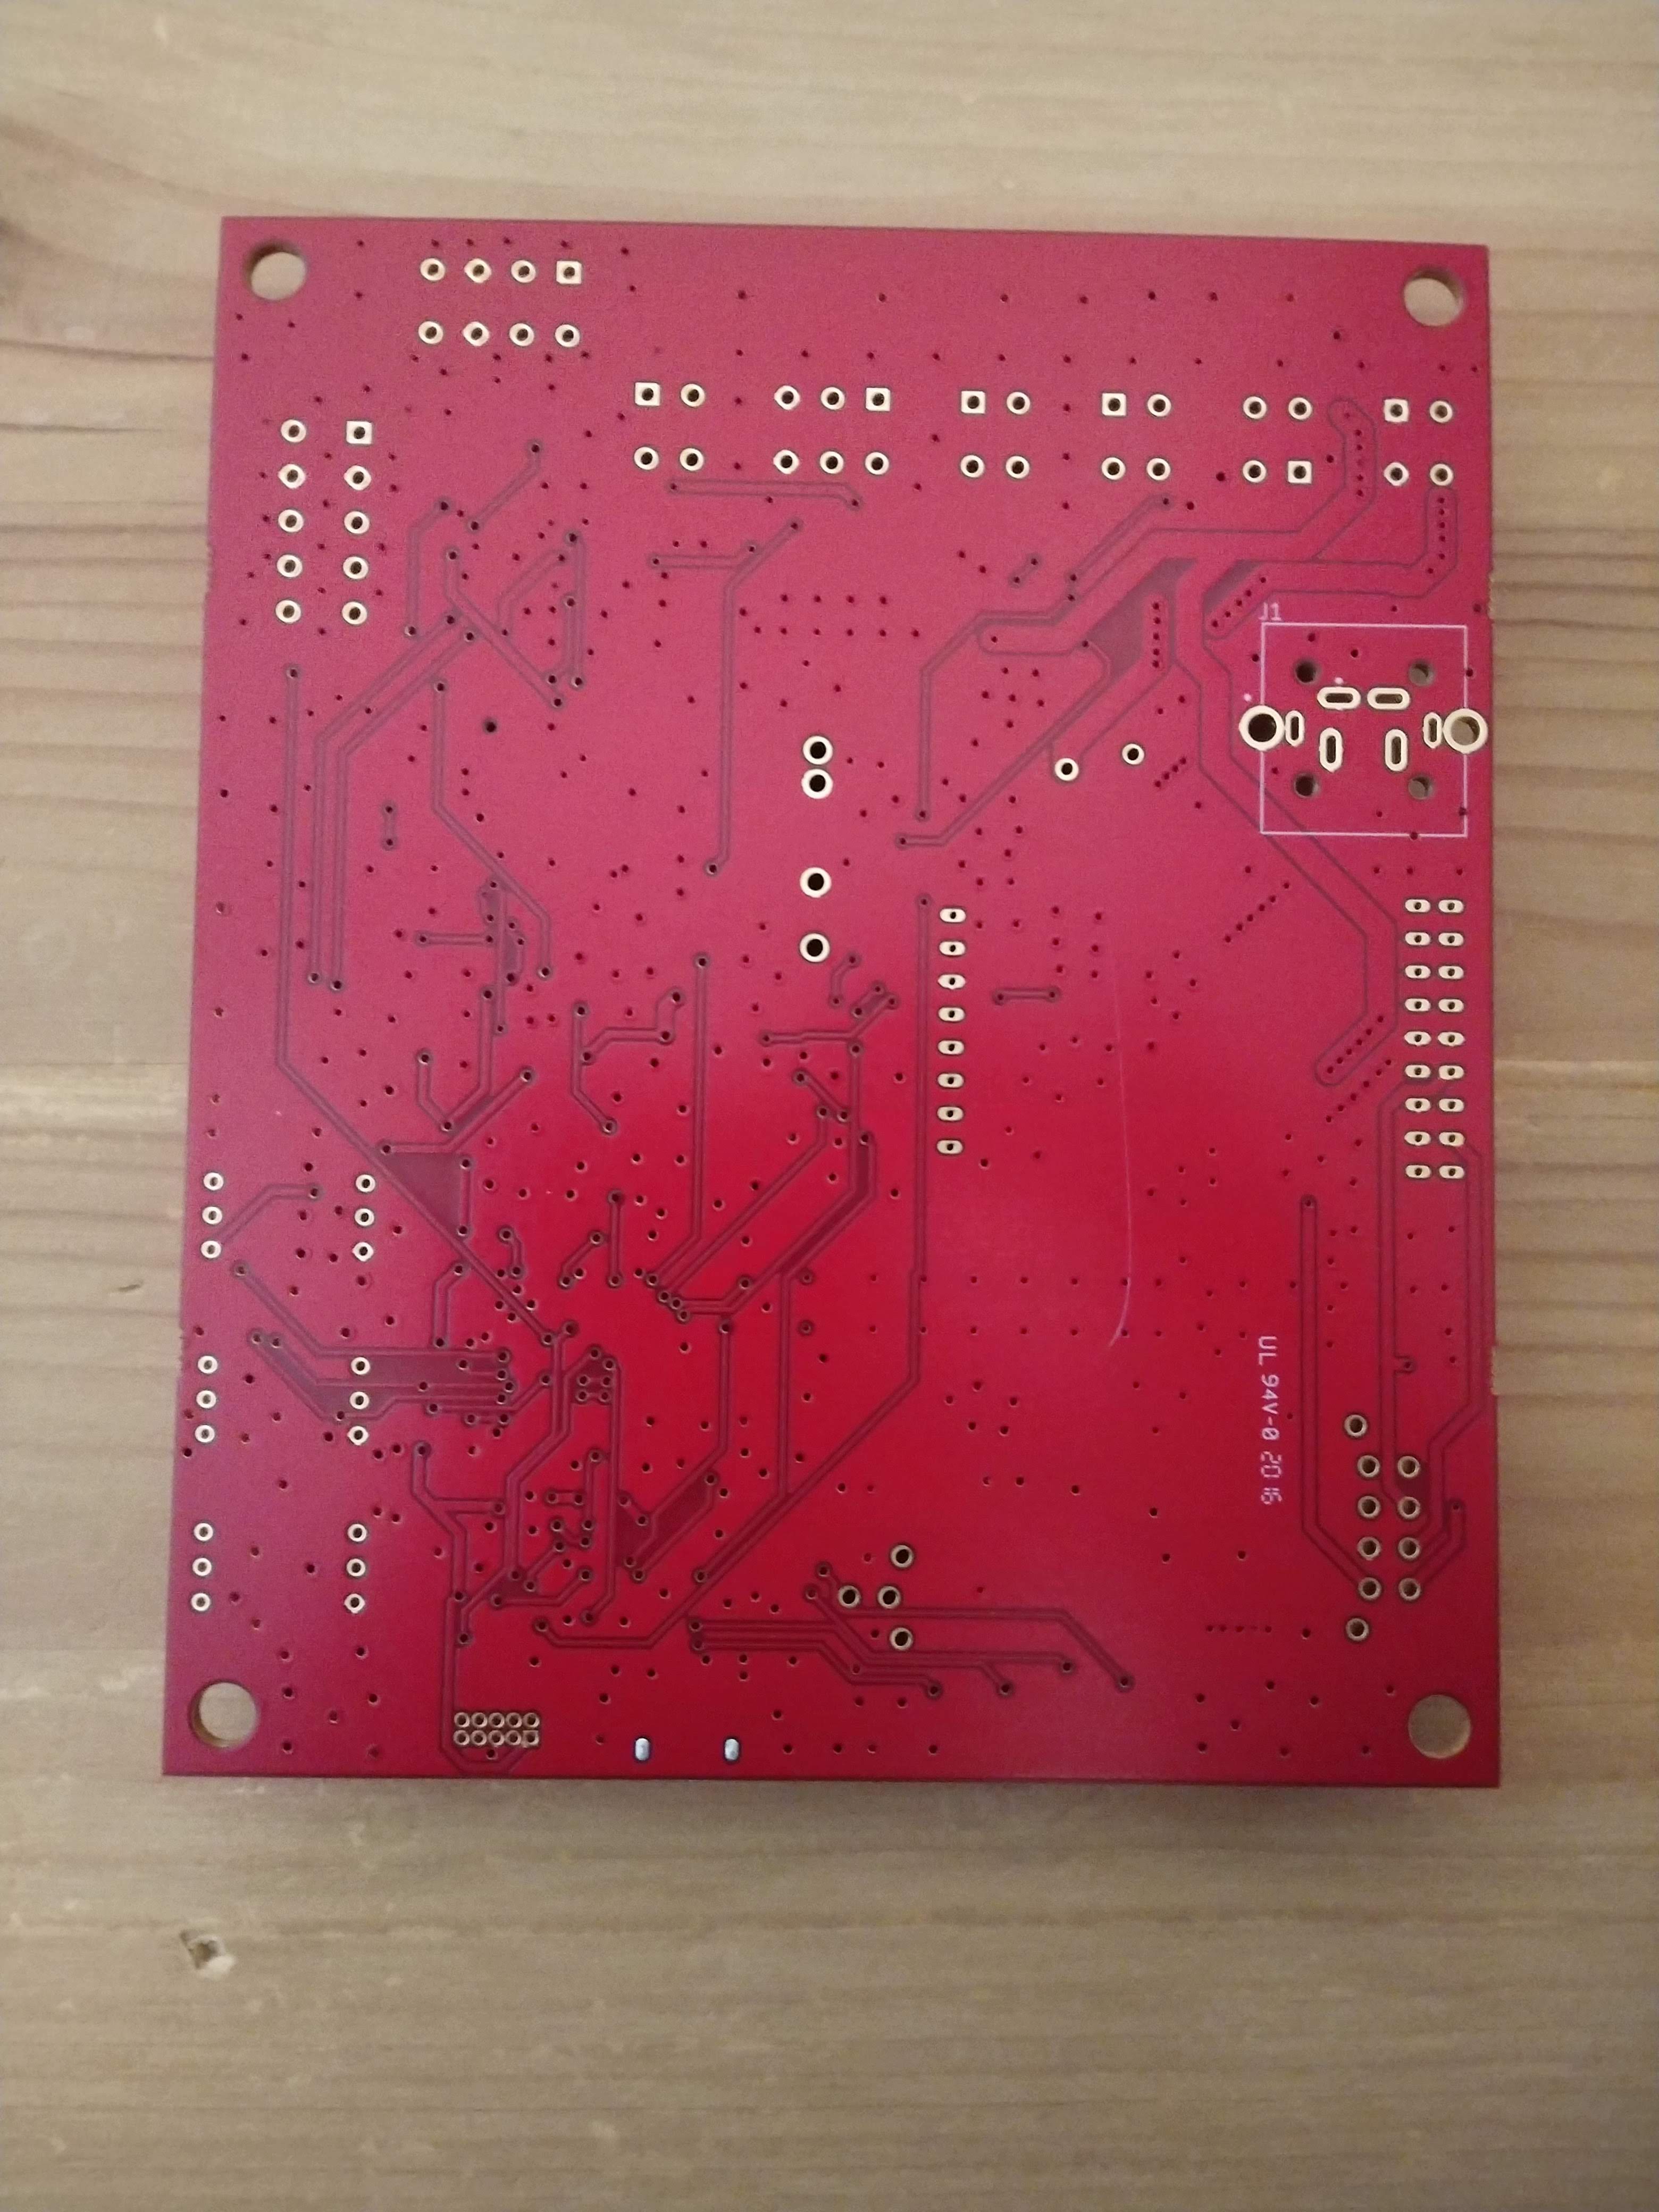
When it arrived, the board looked like the following:
![]()
![]()
There is a lot to note here. First, one can see a lot of safety features that were built into the design. All of the connectors to external parts are ESD protected. Many of the other features of the design are also visible but will be discussed further later. Since the idea of this design is to be low-cost, that doesn't simply cover the cost of components. We also designed it in such a way that the PCB can be built in basically any fab for a low cost. We use generous minimum isolation and width for all traces (none smaller than 10mil, with most much larger than that). The design has all SMD parts on a single side, and it is only a two-layer board.
HARDWARE TESTING
I started assembling the board, going slowly to check all connections for polarity and for any mistakes we might have made in the design. Thankfully, there was nothing impeding the system from being powered up.
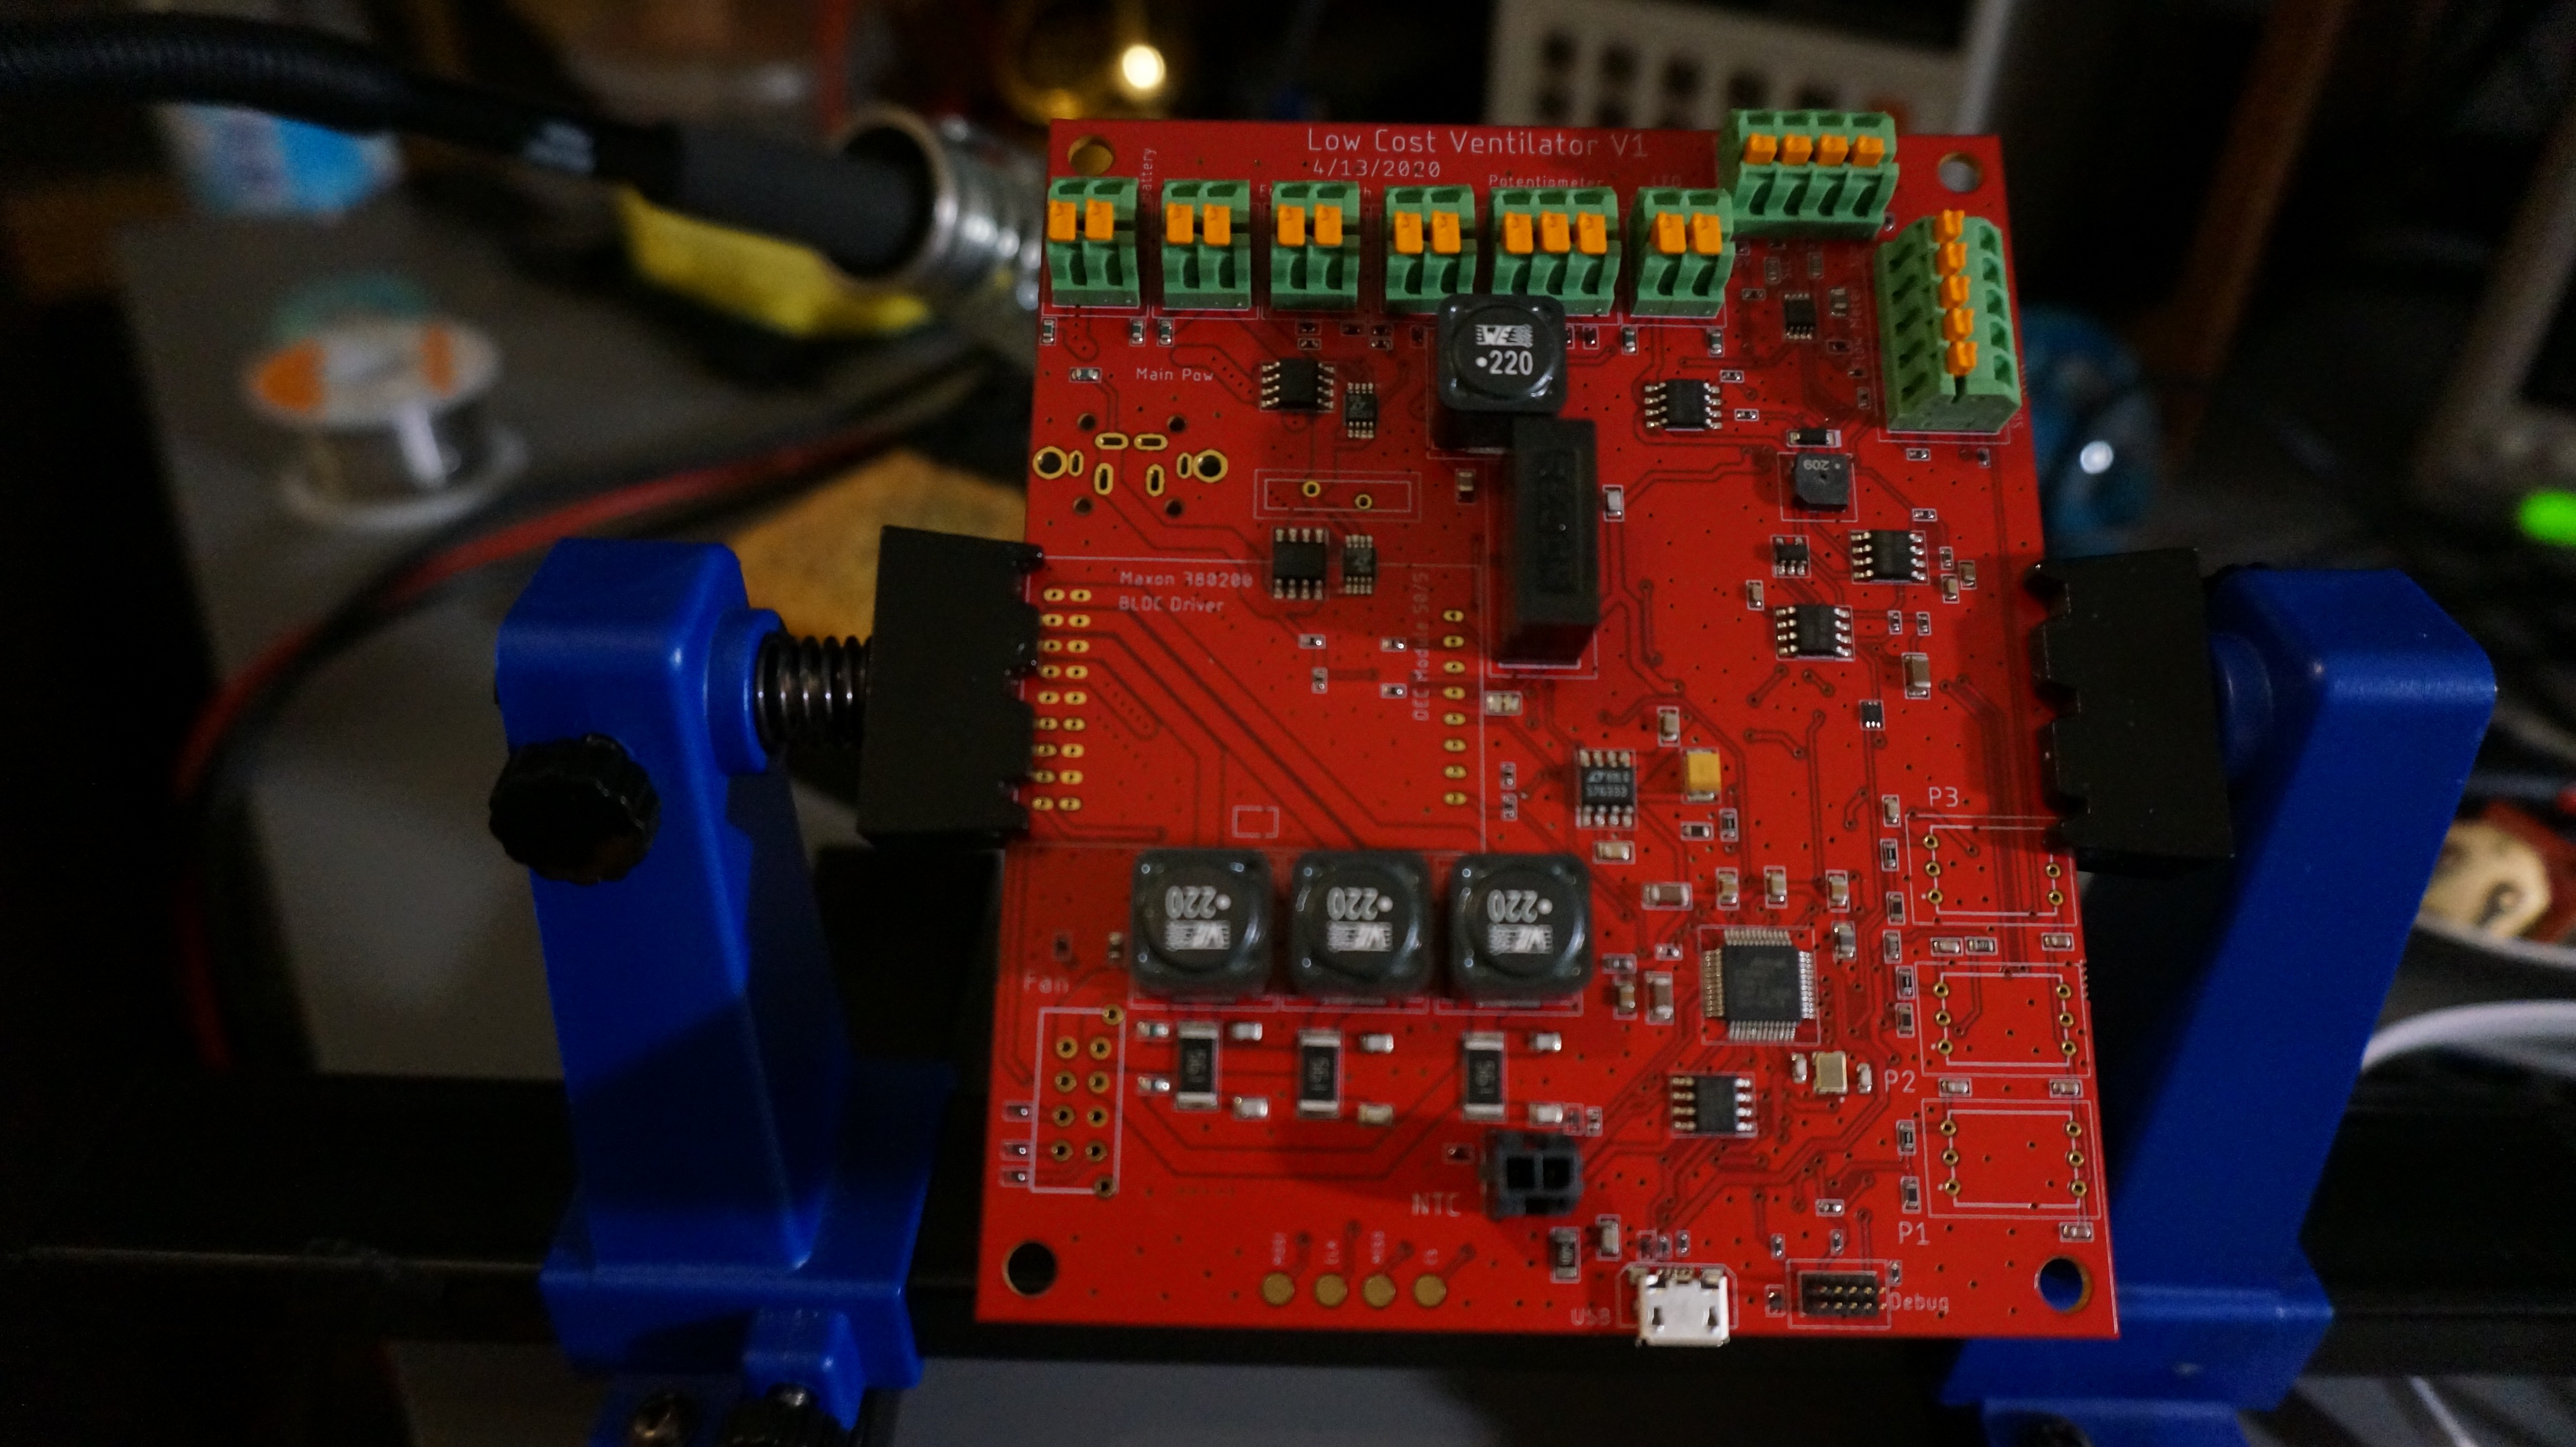
First, here is the board with the 5V regulator, spring pin connectors, programming pins, and motor NTC connector soldered in.
![]()
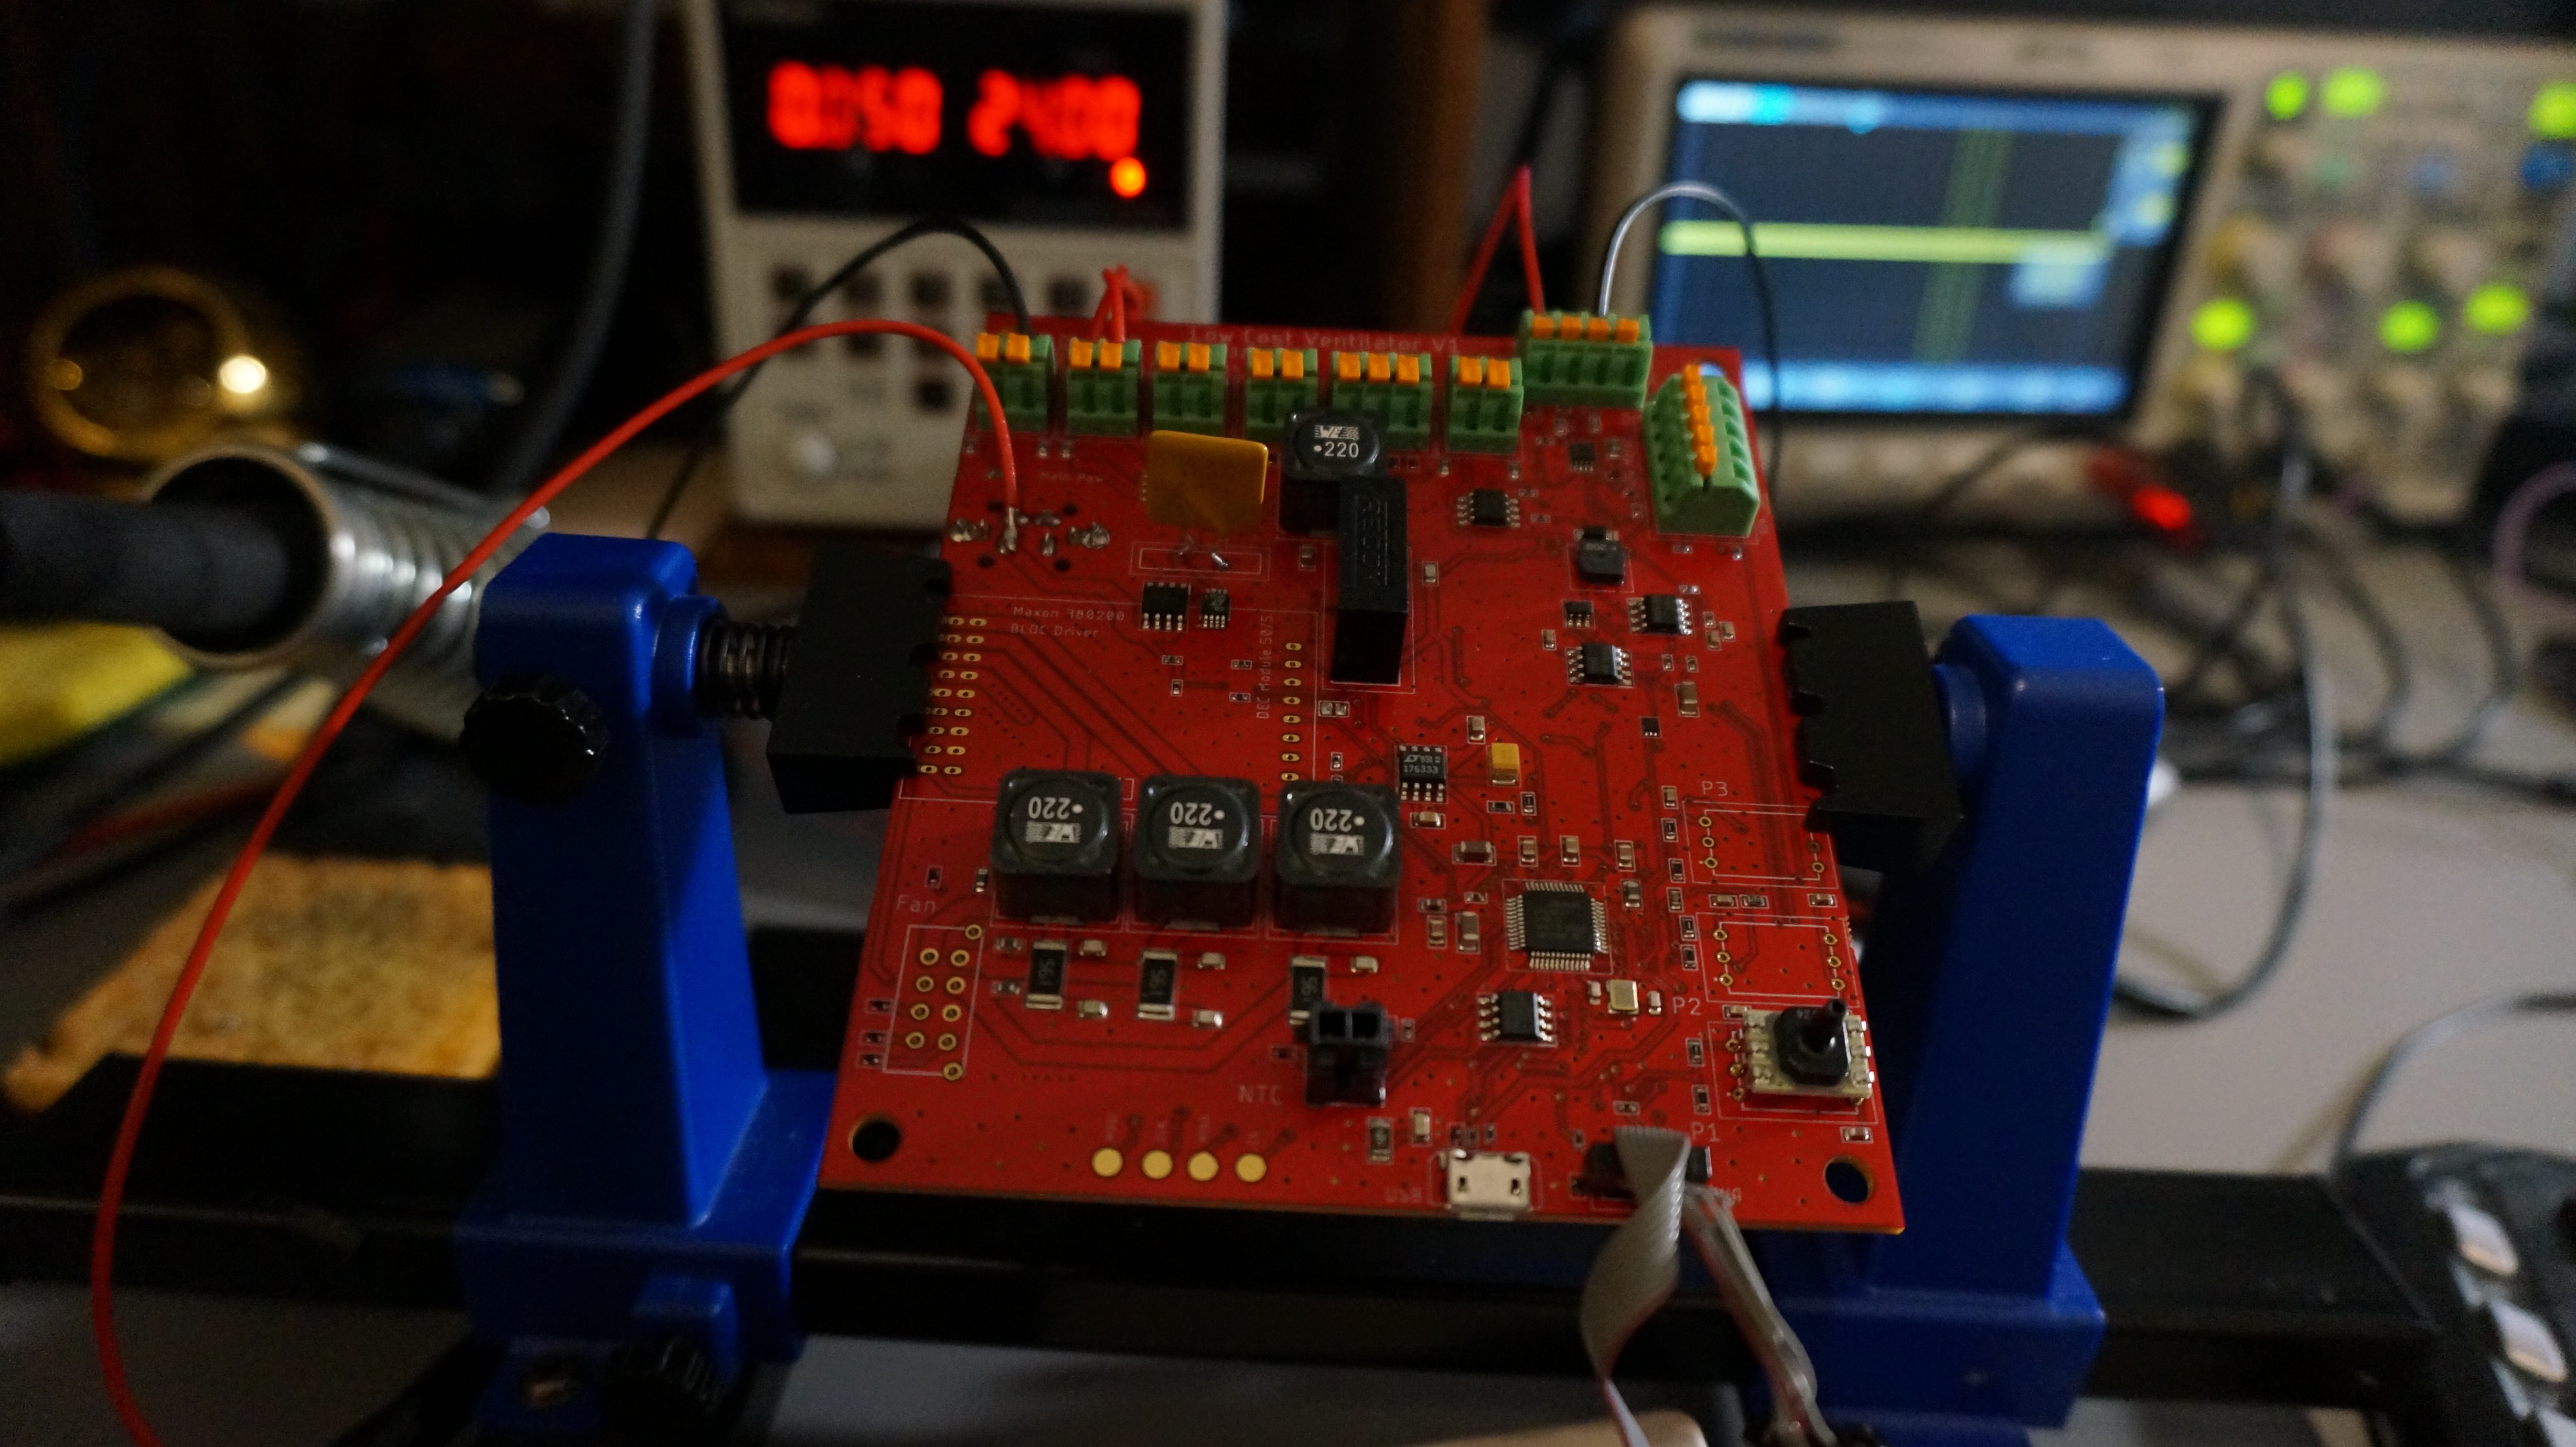
Here, one of the pressure sensors, the fuse, and the main power connector are also installed. The E-Stop switch is wired in, since the system cannot power up without it. The wires on the top right were connected into 5V and GND so I could examine the 5V rail with my oscilloscope (it looks very clean). The red wire soldered onto a pin near the top left of the board was added so that I could power the system from my power supply. Normally, the design uses a COTS medical-grade power supply, but for testing I wanted to be able to limit and monitor current. Thankfully, that wire can be removed once I am done testing - it is not a bodge wire.
![]()
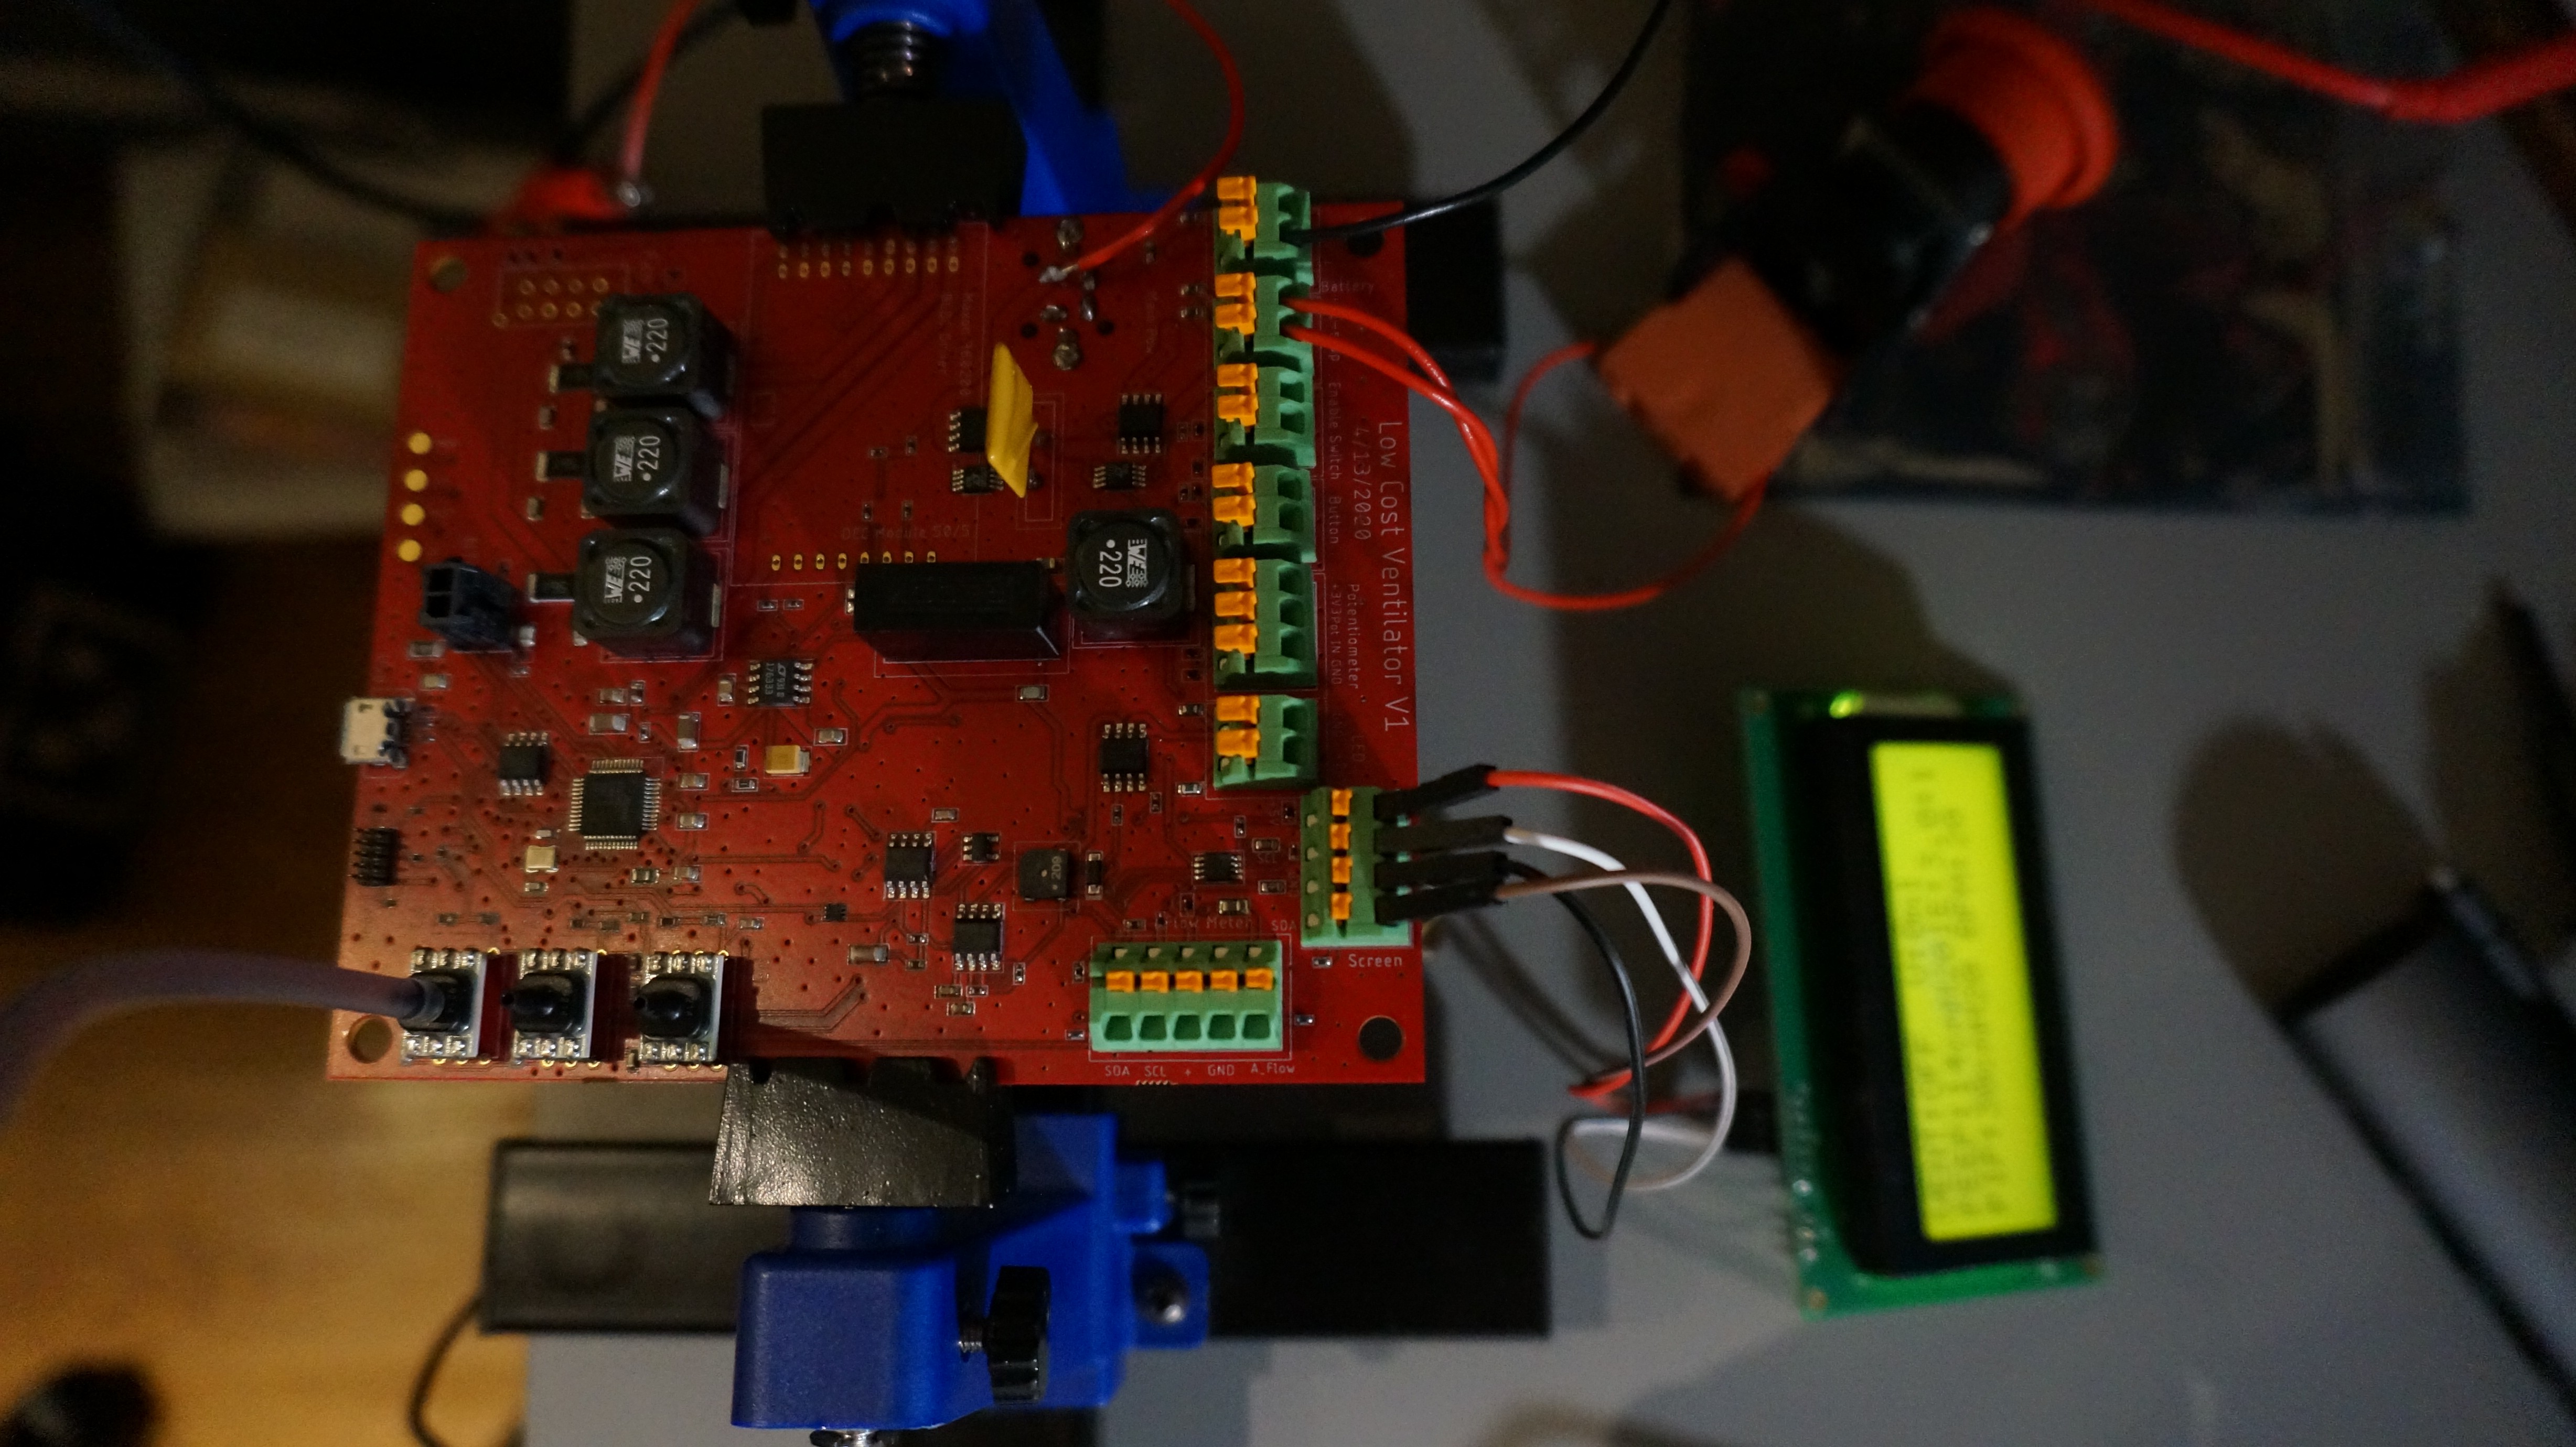
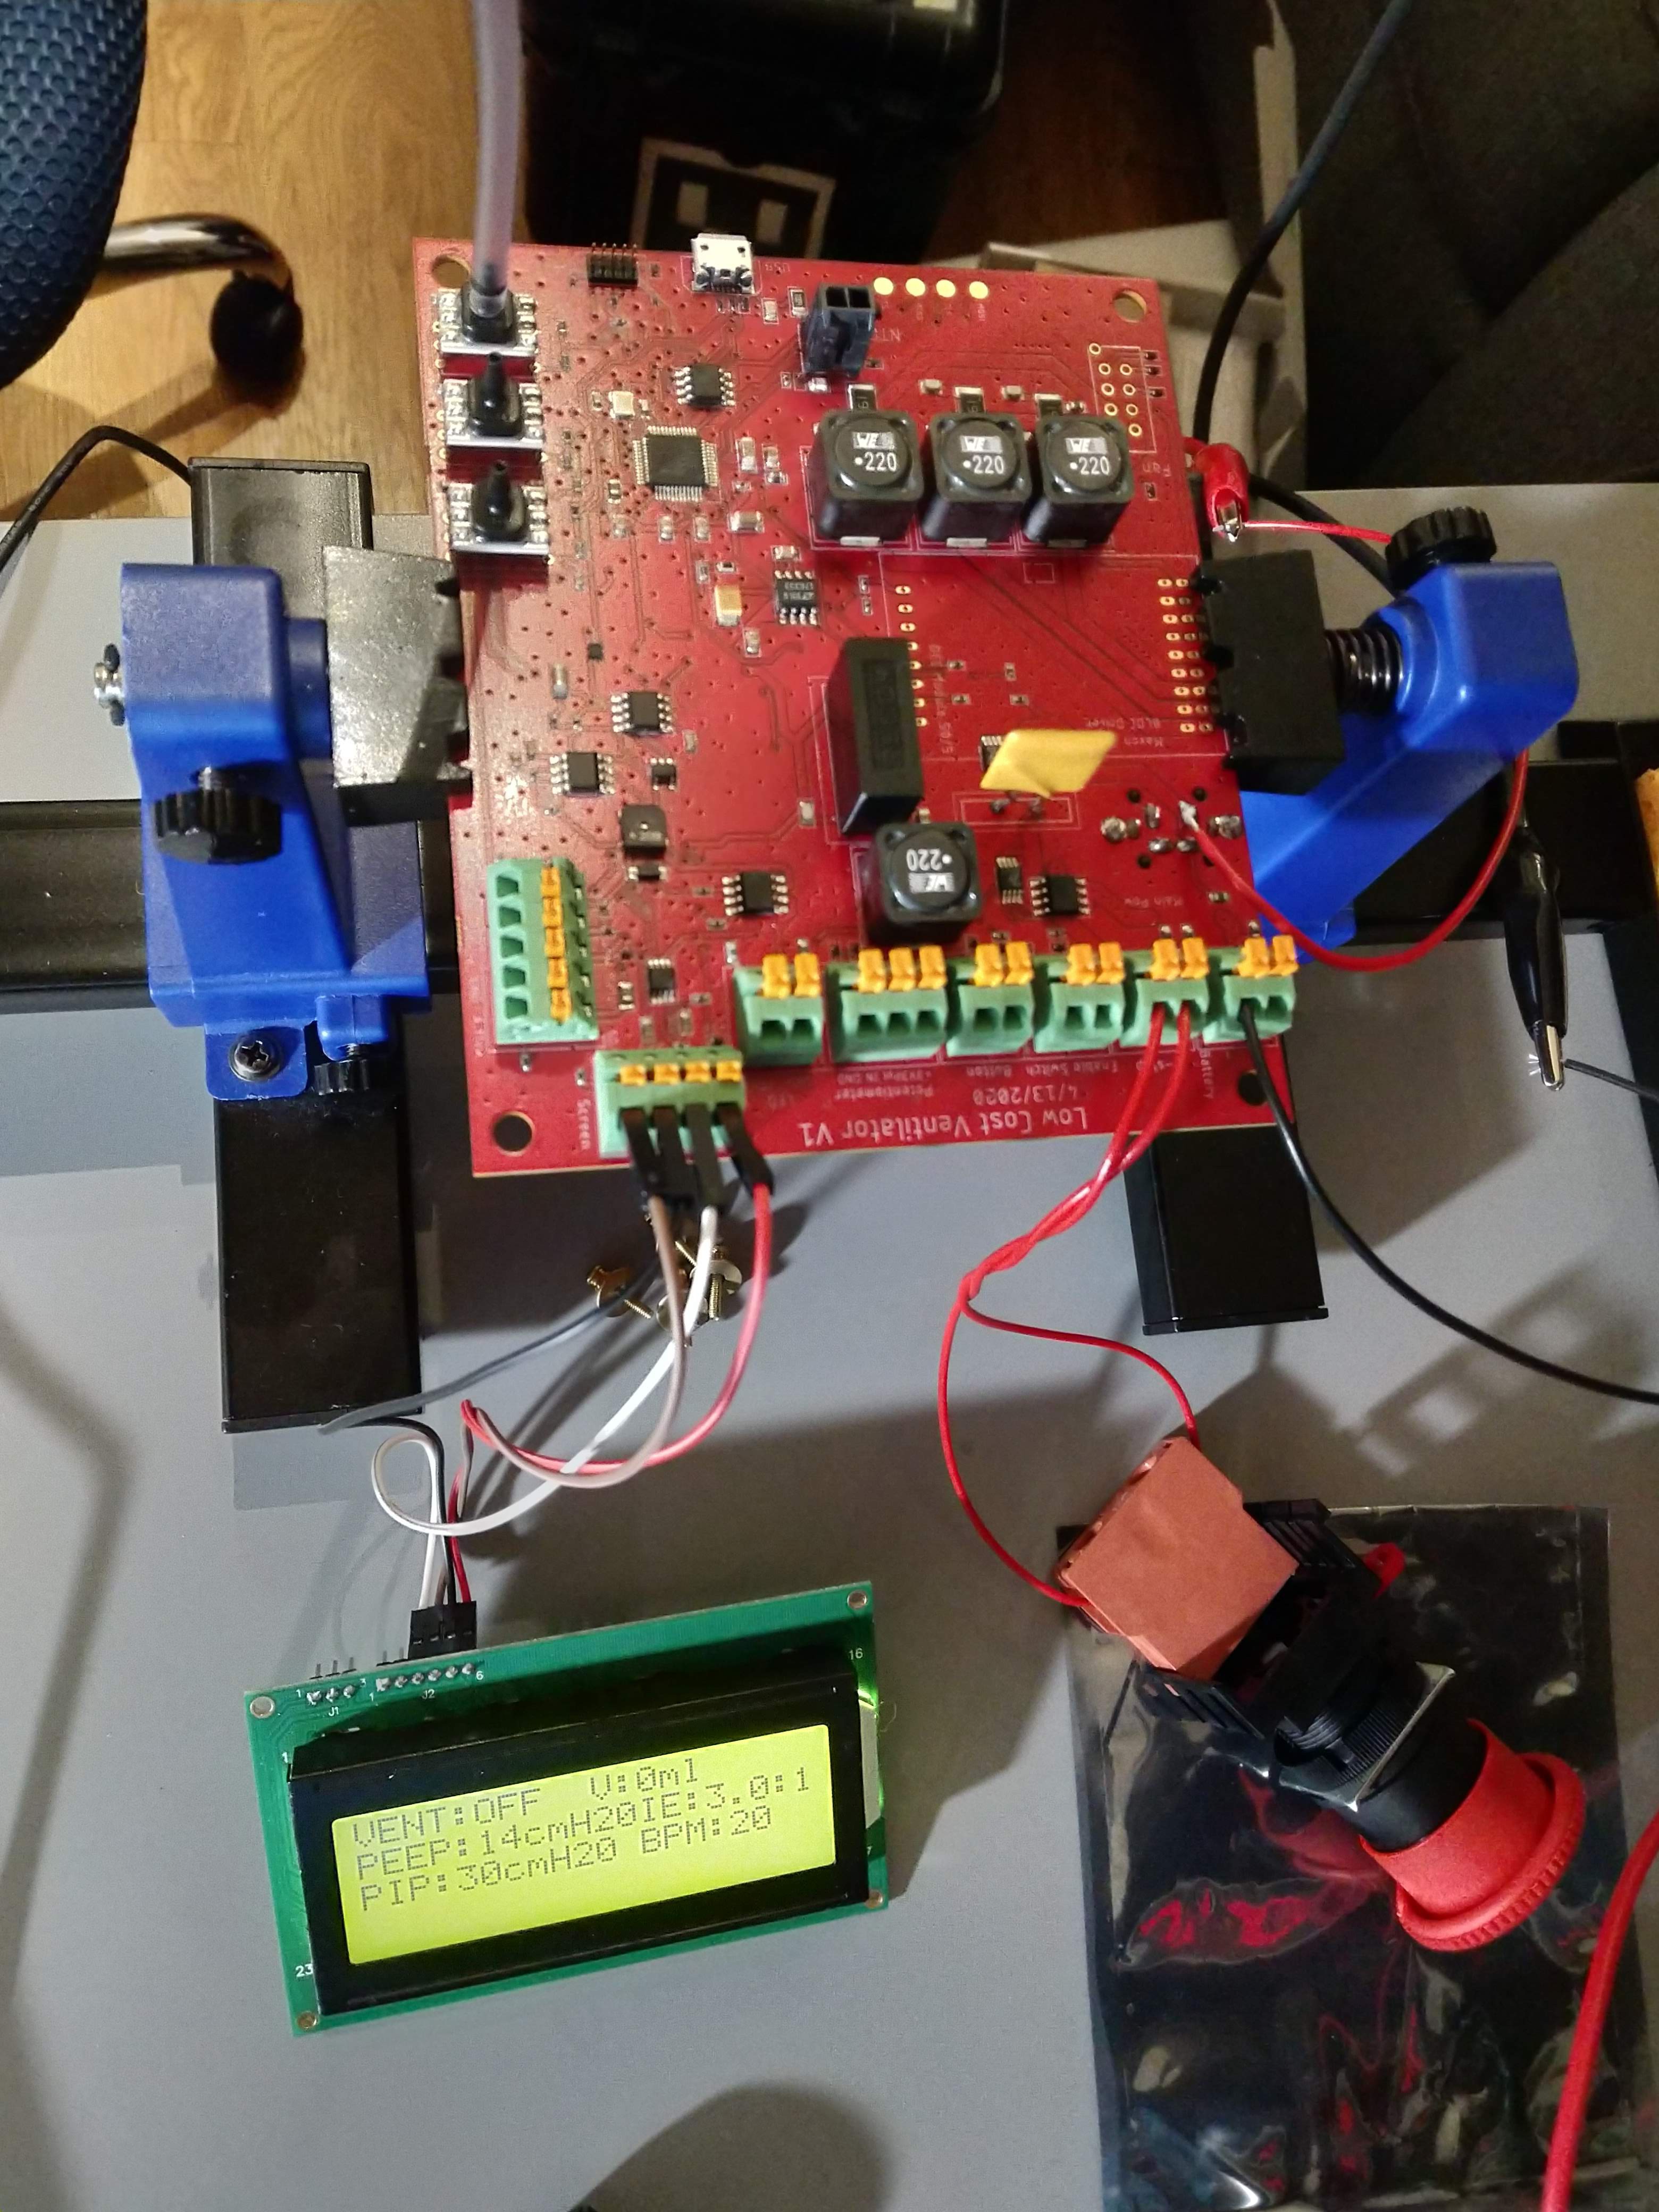
Once I had confirmed that the single pressure sensor was functional and acting as expected, I mounted the other two. This design uses triple-redundant pressure sensors for reliability. Here, the LCD screen is also connected. Since the LCD interface was something I had previously prototyped with a development board, it worked perfectly the first try with no firmware changes needed.
![]()
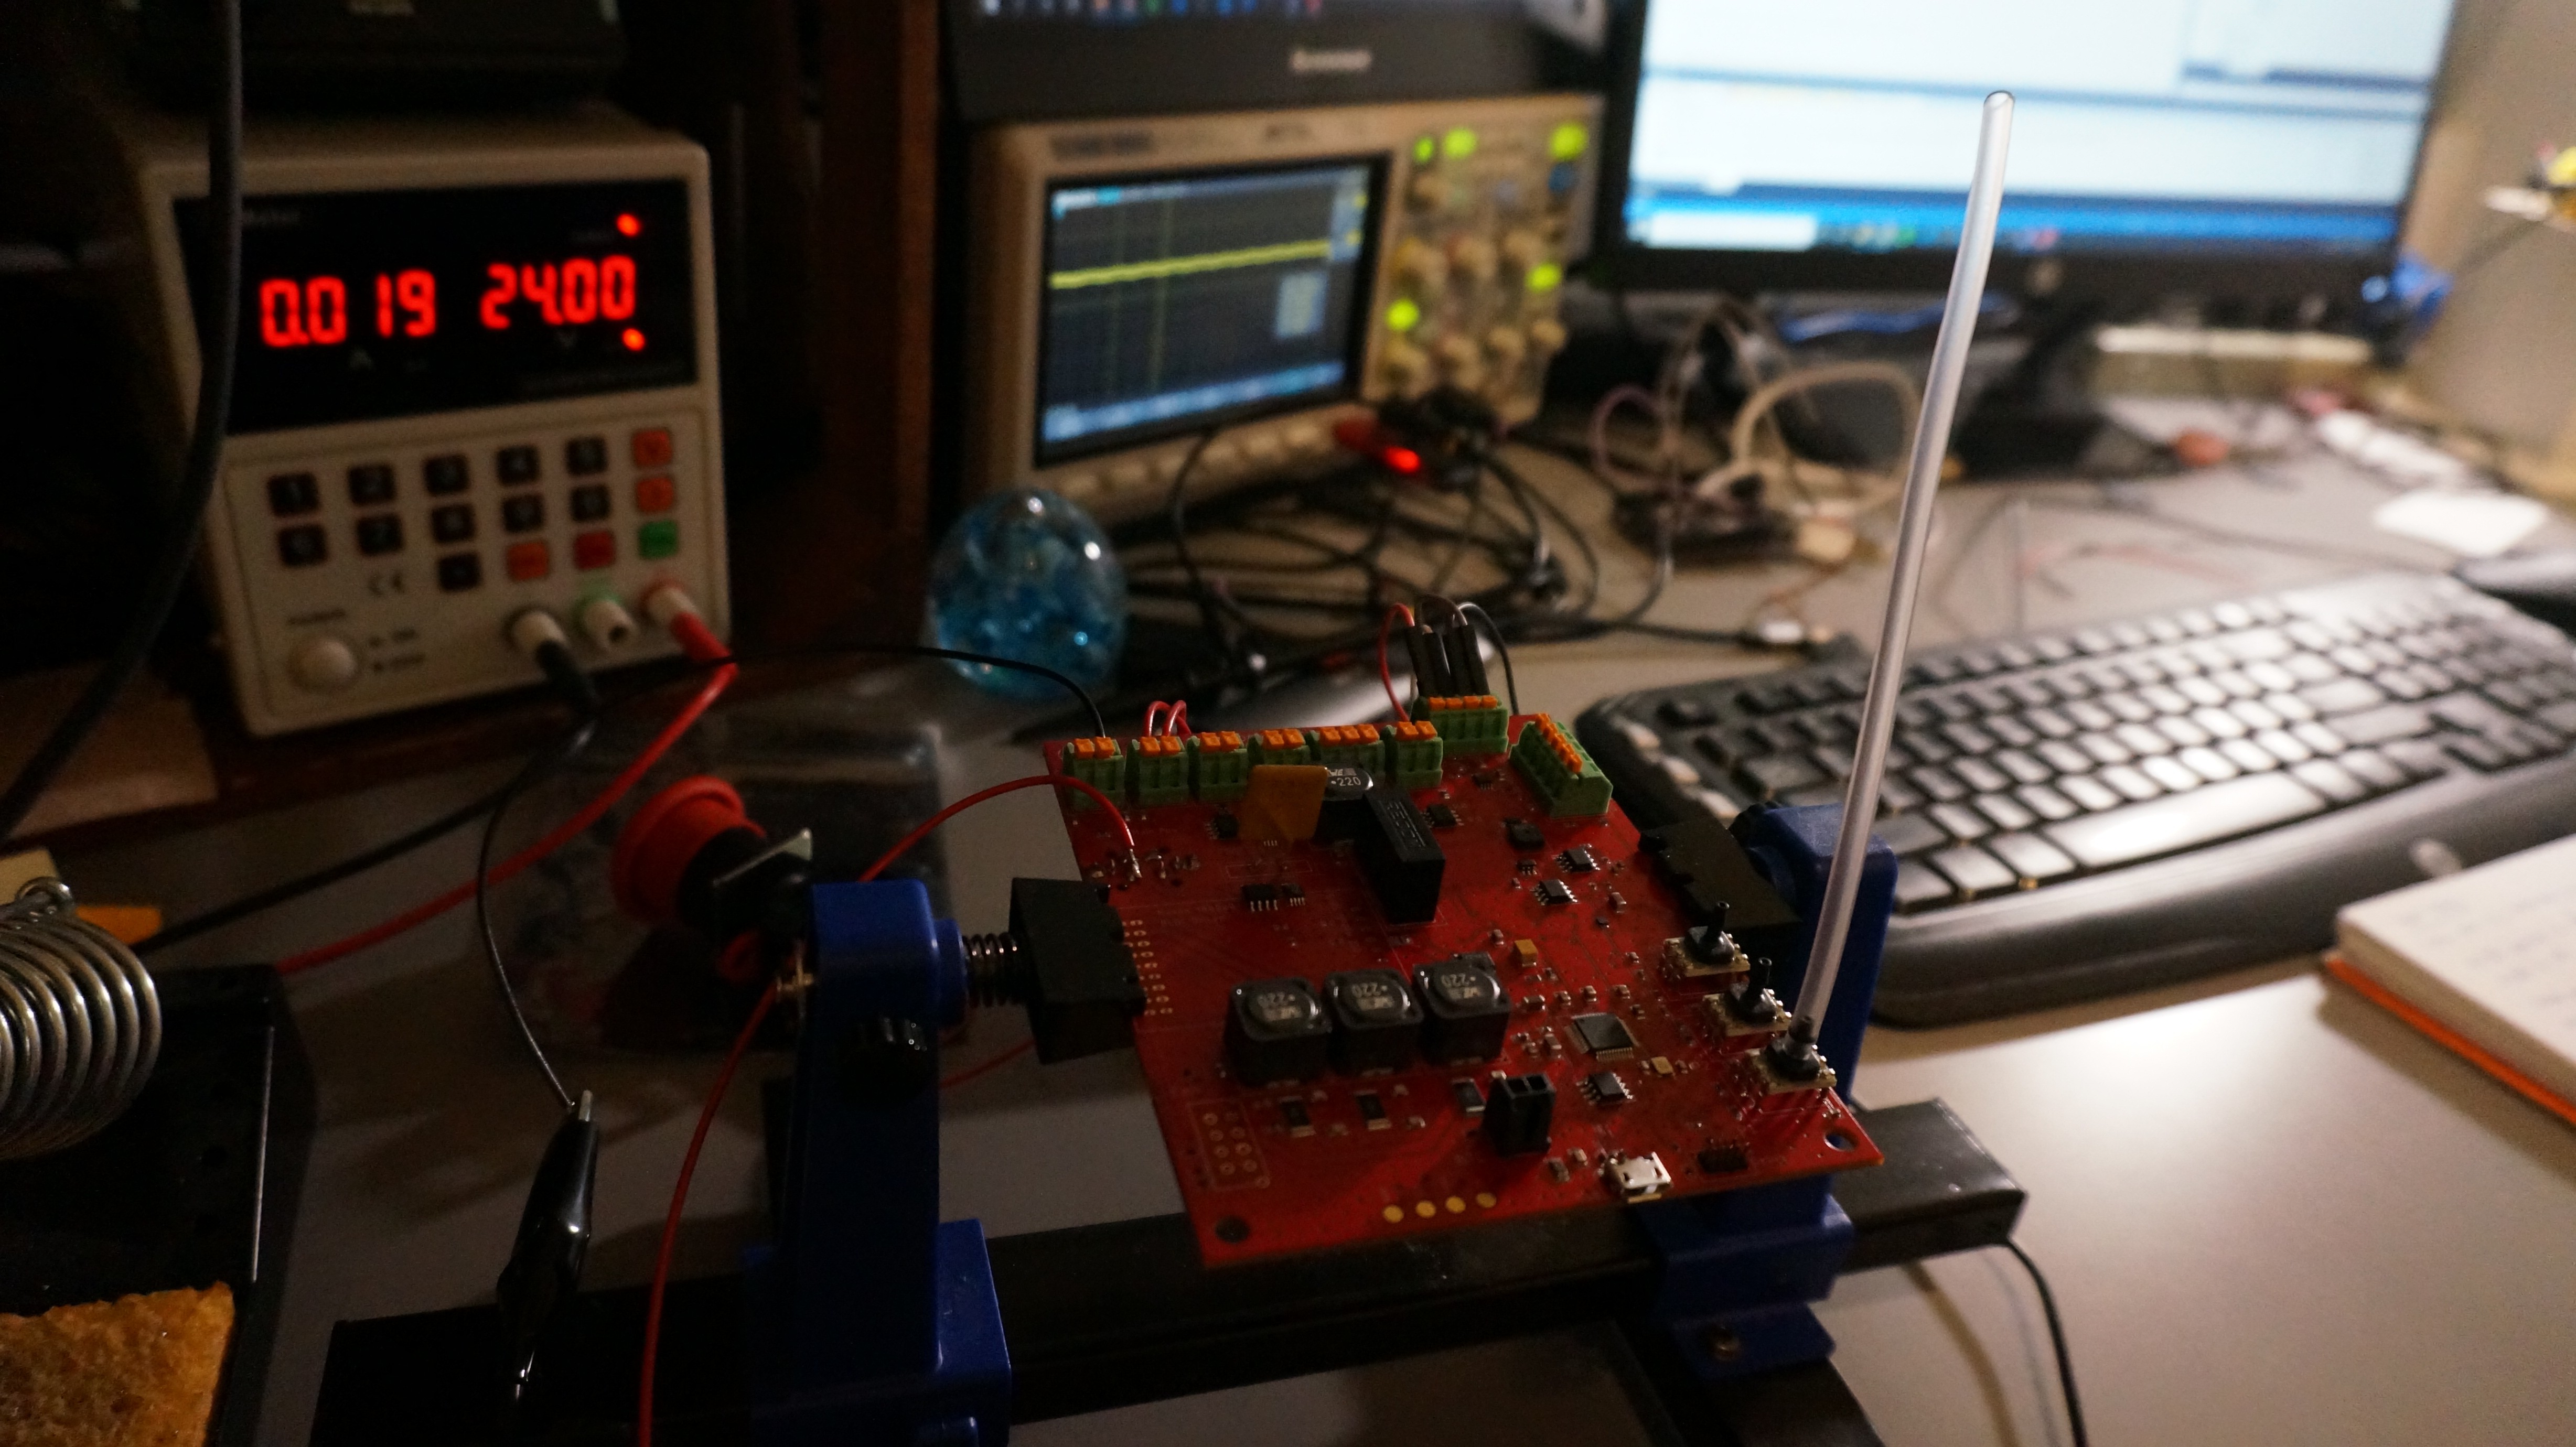
I hooked up a short tube to one of the pressure sensors to confirm that it was measuring pressure changes. It was. The nominal operational current is shown at 19mA at 24V, including the backlit LCD screen. The blower motor and its controller are not installed here.
![]()
This image more clearly shows the preliminary display format for the ventilator. This is very much subject to change in the future, but is a useful start,
![]()
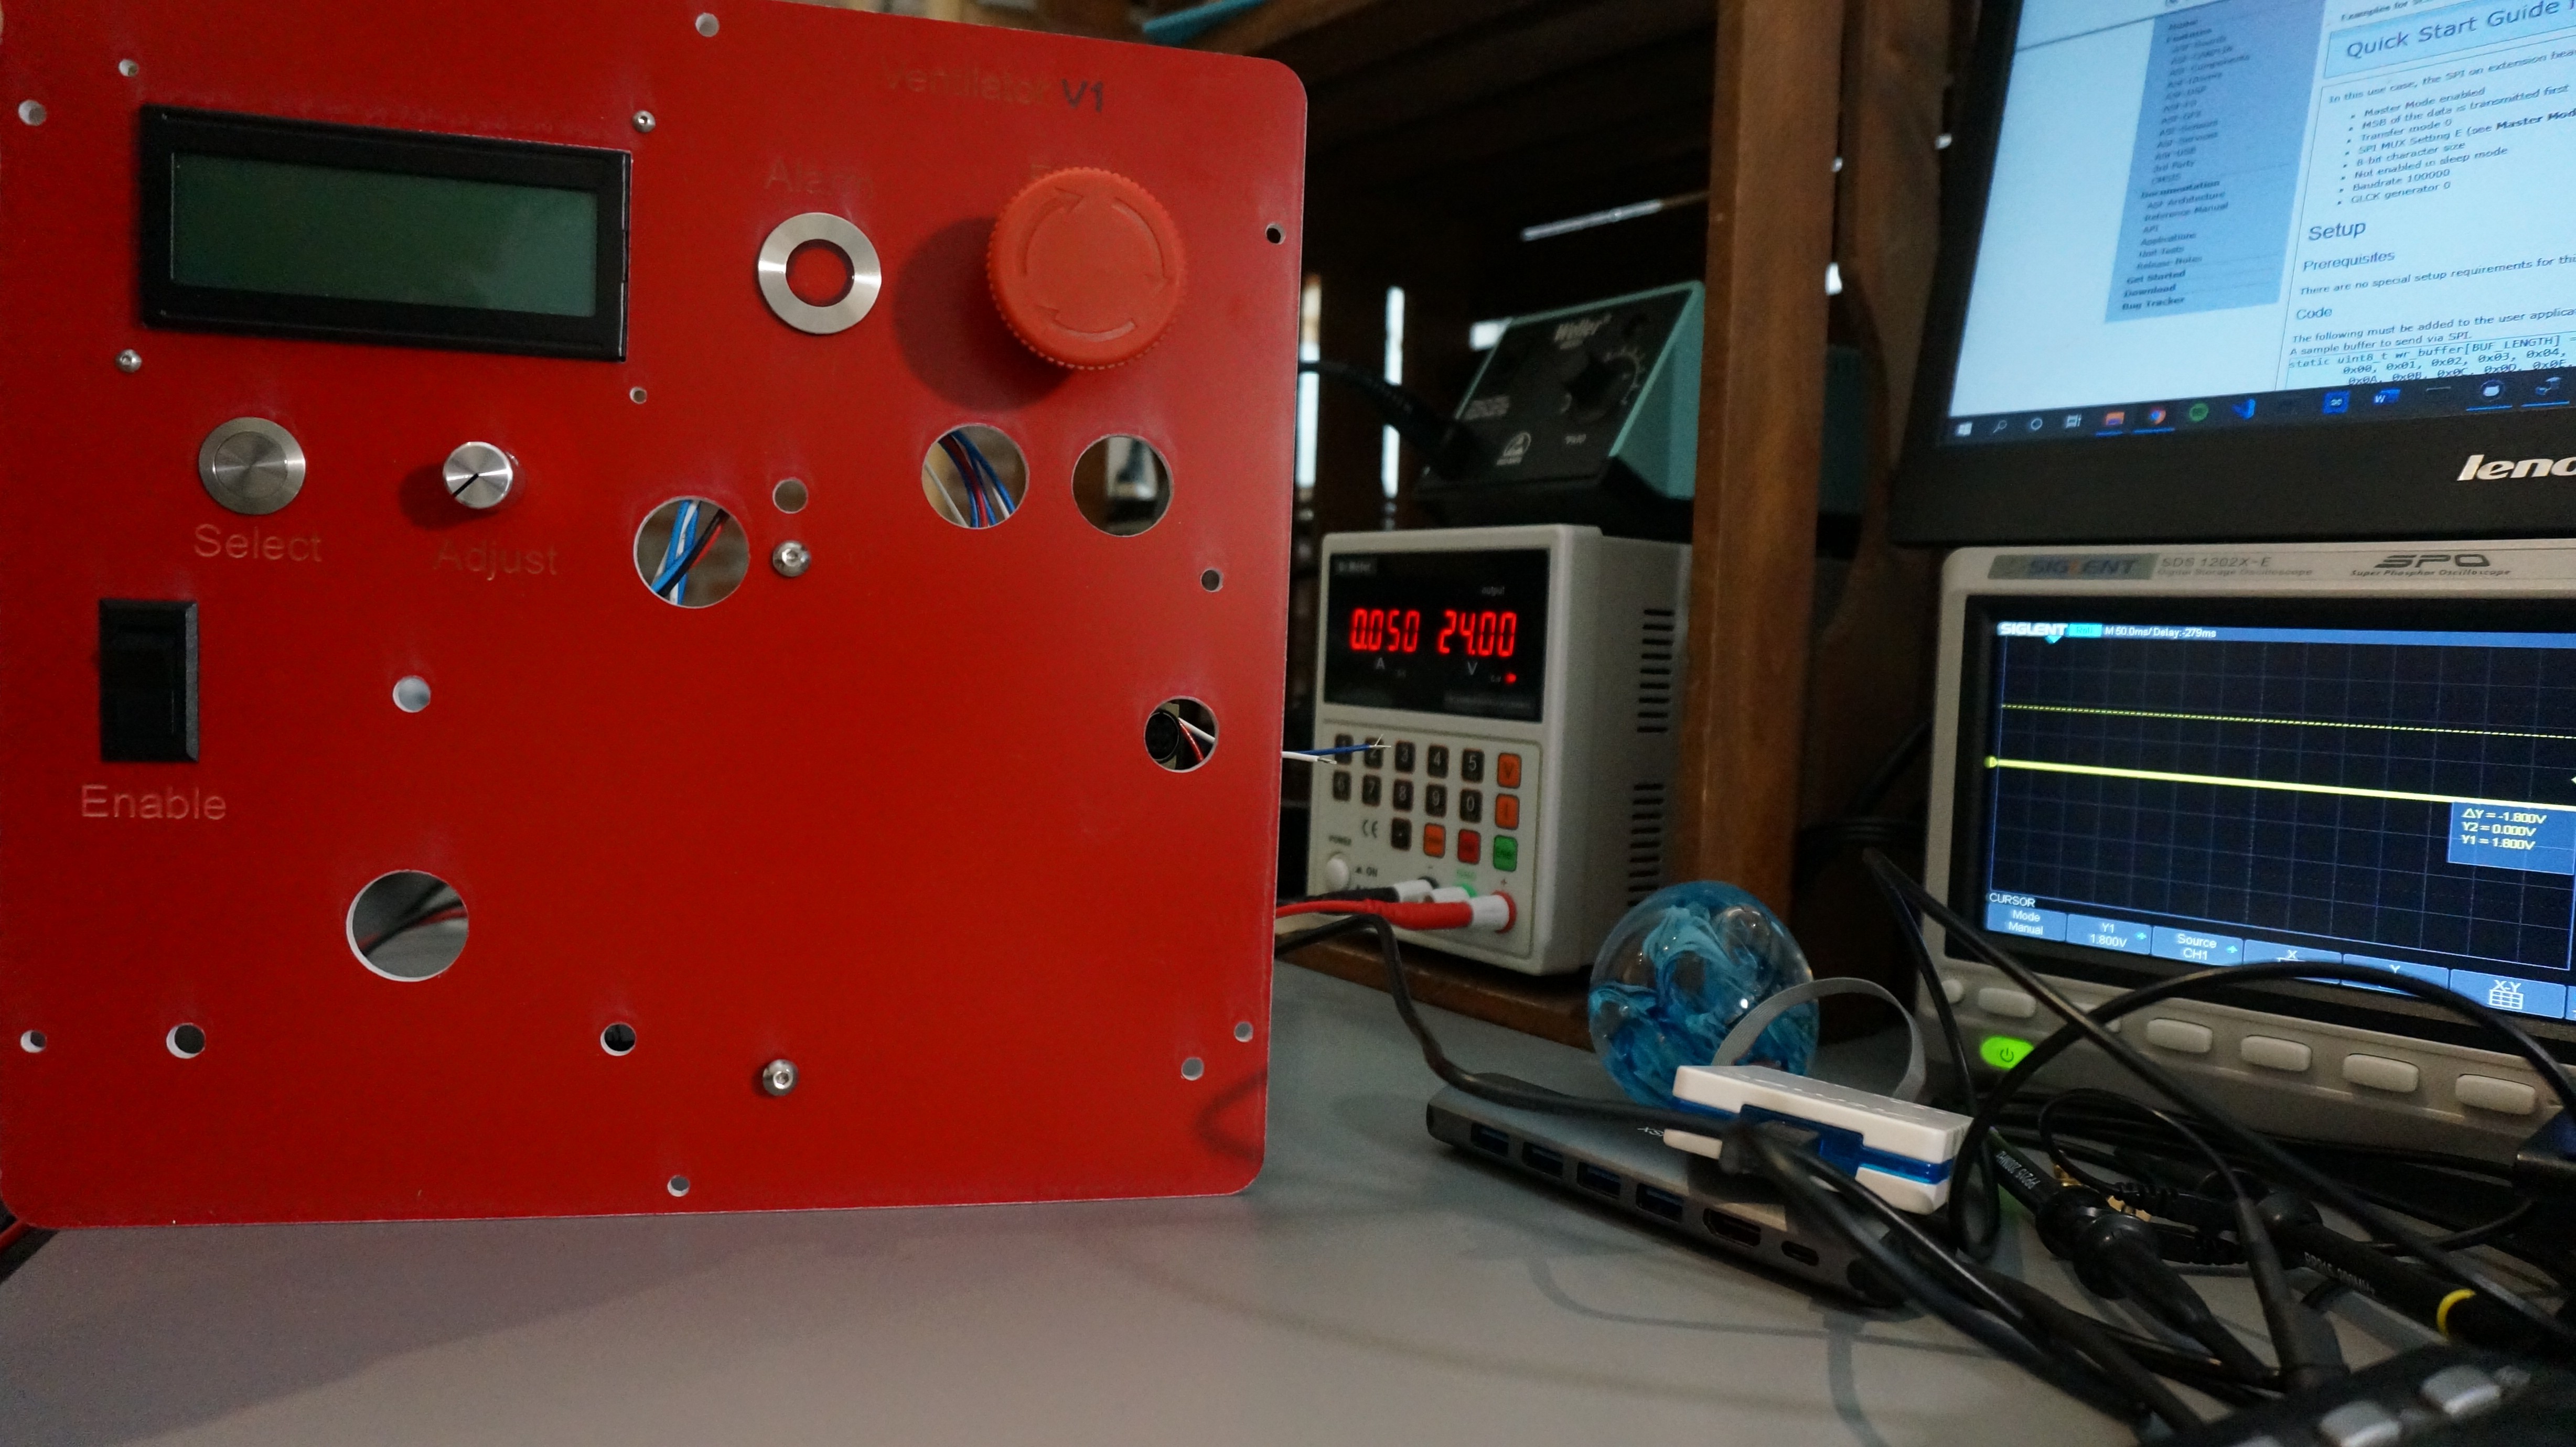
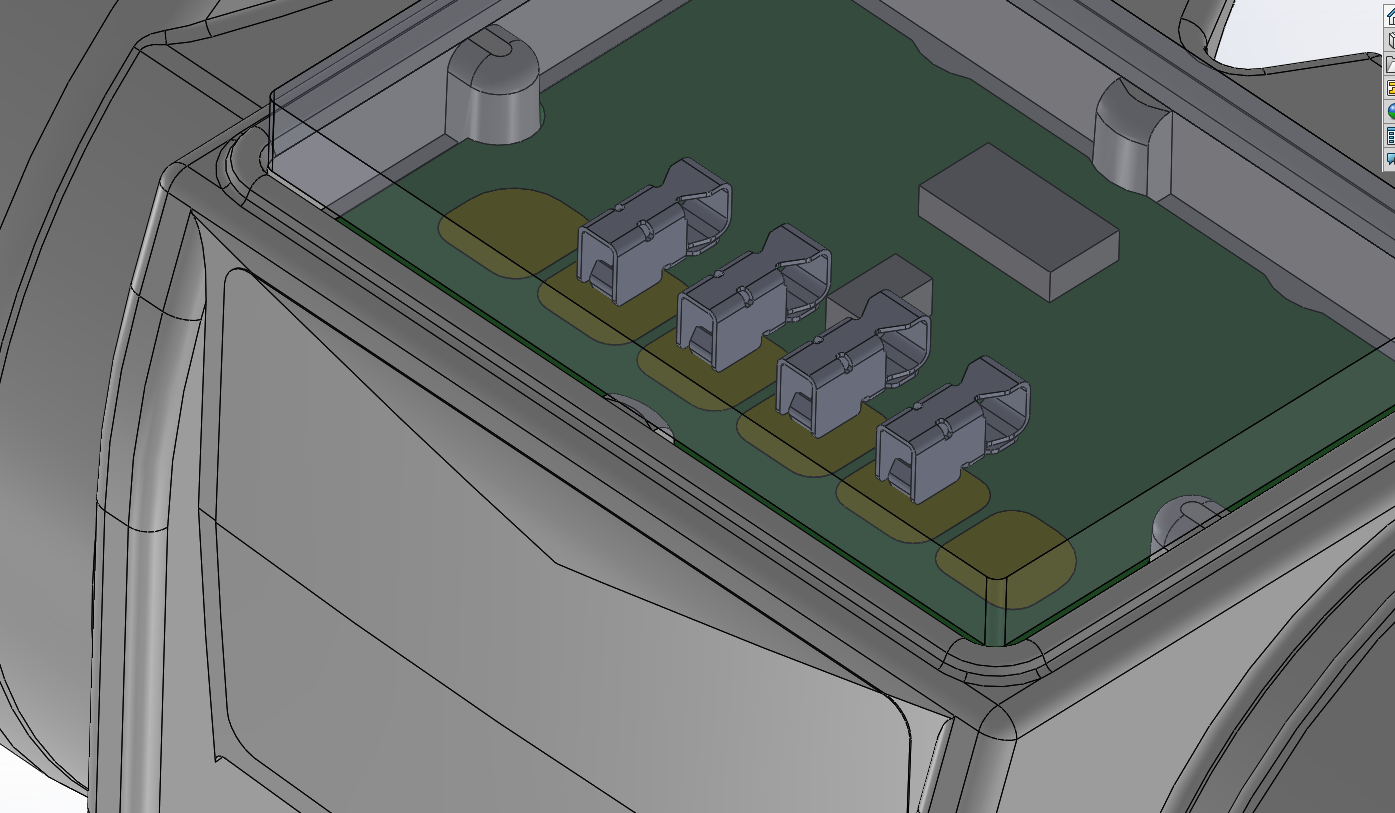
In order to simplify manufacturing, the LCV is designed around a COTS enclosure from Hammond. One of the front panels will be replaced by one of our own design. Therefore, the only main custom hardware element needed is a single "2D" part, easily produced on a laser cutter or waterjet. Our prototype panel is laser cut from acrylic, but acrylic should not be used for anything other than a prototype. Acrylic is damaged by alcohol, so it would be difficult to clean this system. The image below shows the PCBA roughly installed in its correct spot. The screws we bought were too short so it isn't fully installed yet, but the placement seems good. The enable toggle switch and the UI pushbutton and potentiometer are also installed and wired up. The alarm LED is installed on the panel between the LCD and the E-Stop switch, but not wired up. In testing, it seems to have a huge inrush current that we were not expecting, so we are choosing an alternative now.
![]()
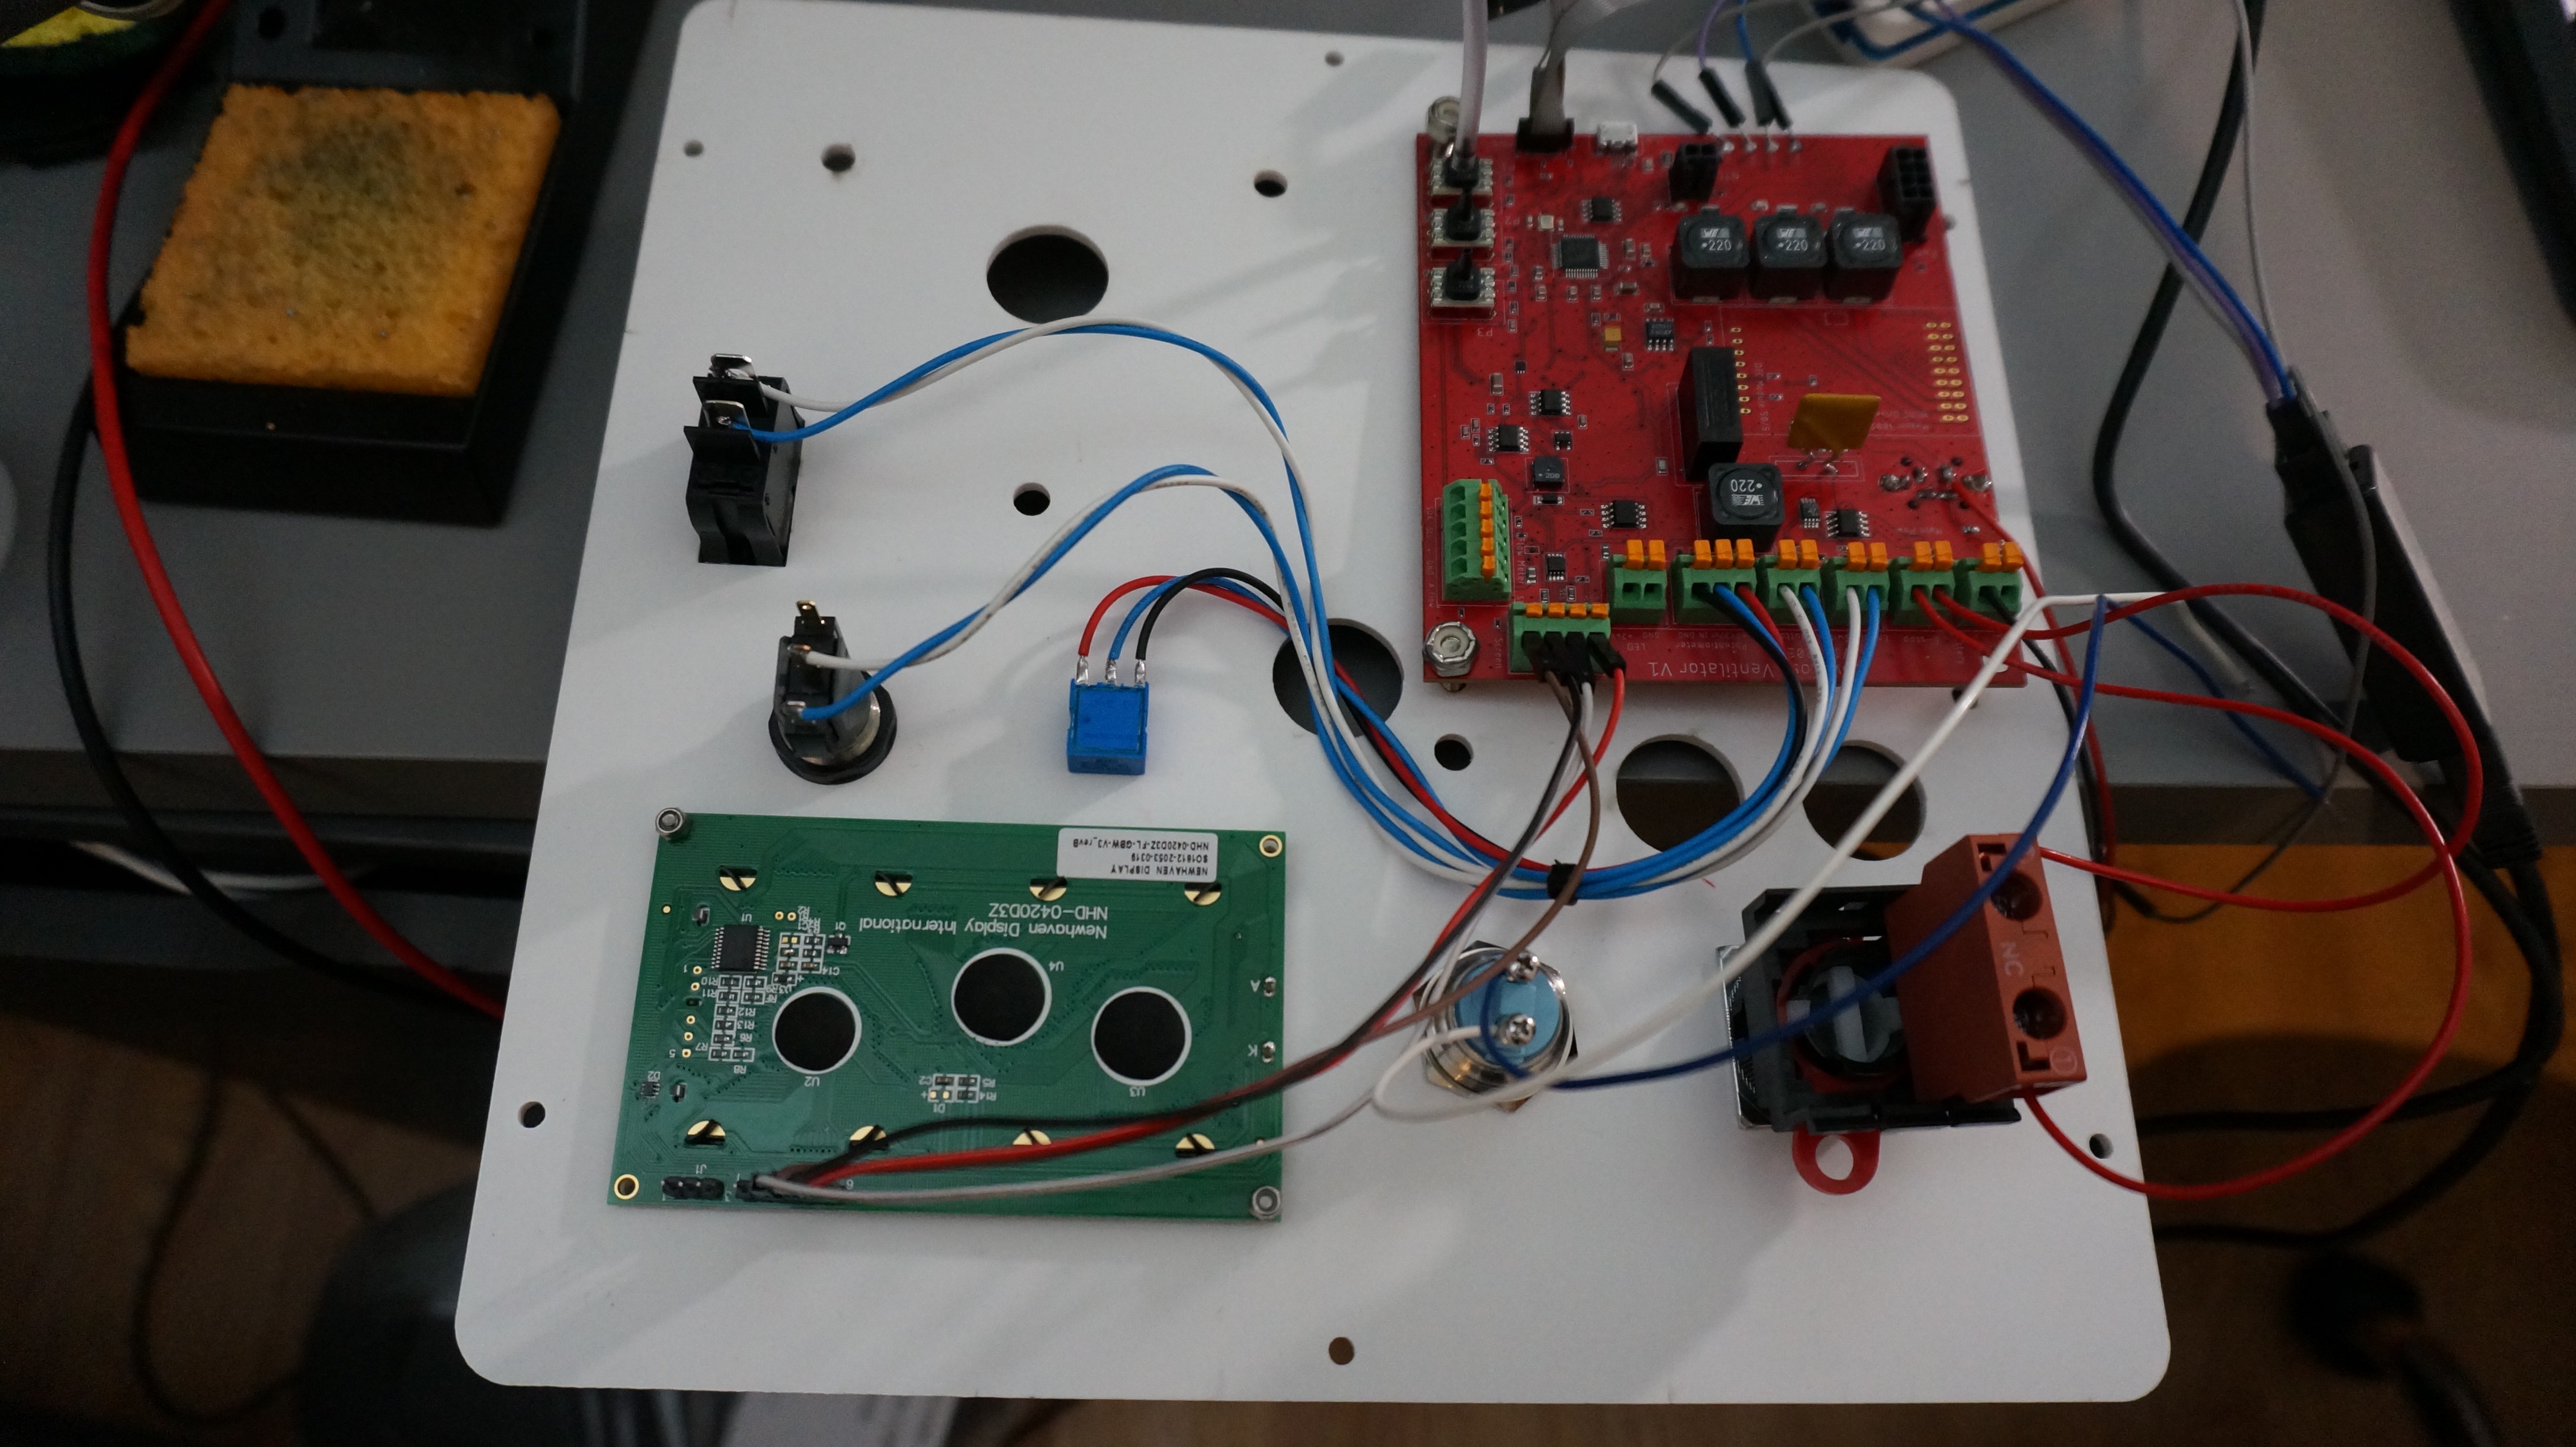
The image below shows the other side of the panel. The remaining holes in the panel are for the breathing circuit, which is not yet installed.
![]()
Overall, the hardware side of the project is progressing nicely!
FIRMWARE TESTING
Alongside the hardware build and testing, the firmware has also been under development. Because I had built a breadboard prototype with the correct MCU, LCD, and UI buttons and knobs, the main firmware was already ready to go. We are using FreeRTOS and the firmware is being written to use interrupts for peripheral interfacing wherever possible. The I2C interface to the LCD is done this way so that it cannot block and does not interfere with any other operation even though it is operated quite slowly (45kHz) and a lot of data is being sent (full 80 byte frame buffer at 30Hz + interfacing overhead).
There are a few main features that were not ready to go yet. The design has a separate hardware watchdog IC which must be "fed" by the microcontroller periodically. This is done by toggling a pin from the microcontroller to the watchdog. If this stops, the watchdog triggers the board mounted piezo buzzer and alarm LED to fire. In this way, if the microcontroller ever gets stuck, the operator will be notified. This is an important safety feature. When first powering on the system, I had forgot about the buzzer. The first power-up of any new design is scary, so when a loud buzzer immediately triggered, it startled me to say the least! Thankfully rather than an issue, this indicated the watchdog was operating as expected. Indeed, if I stop the MCU during debugging, the buzzer is triggered. While annoying for development, this is exactly what we designed it to do.
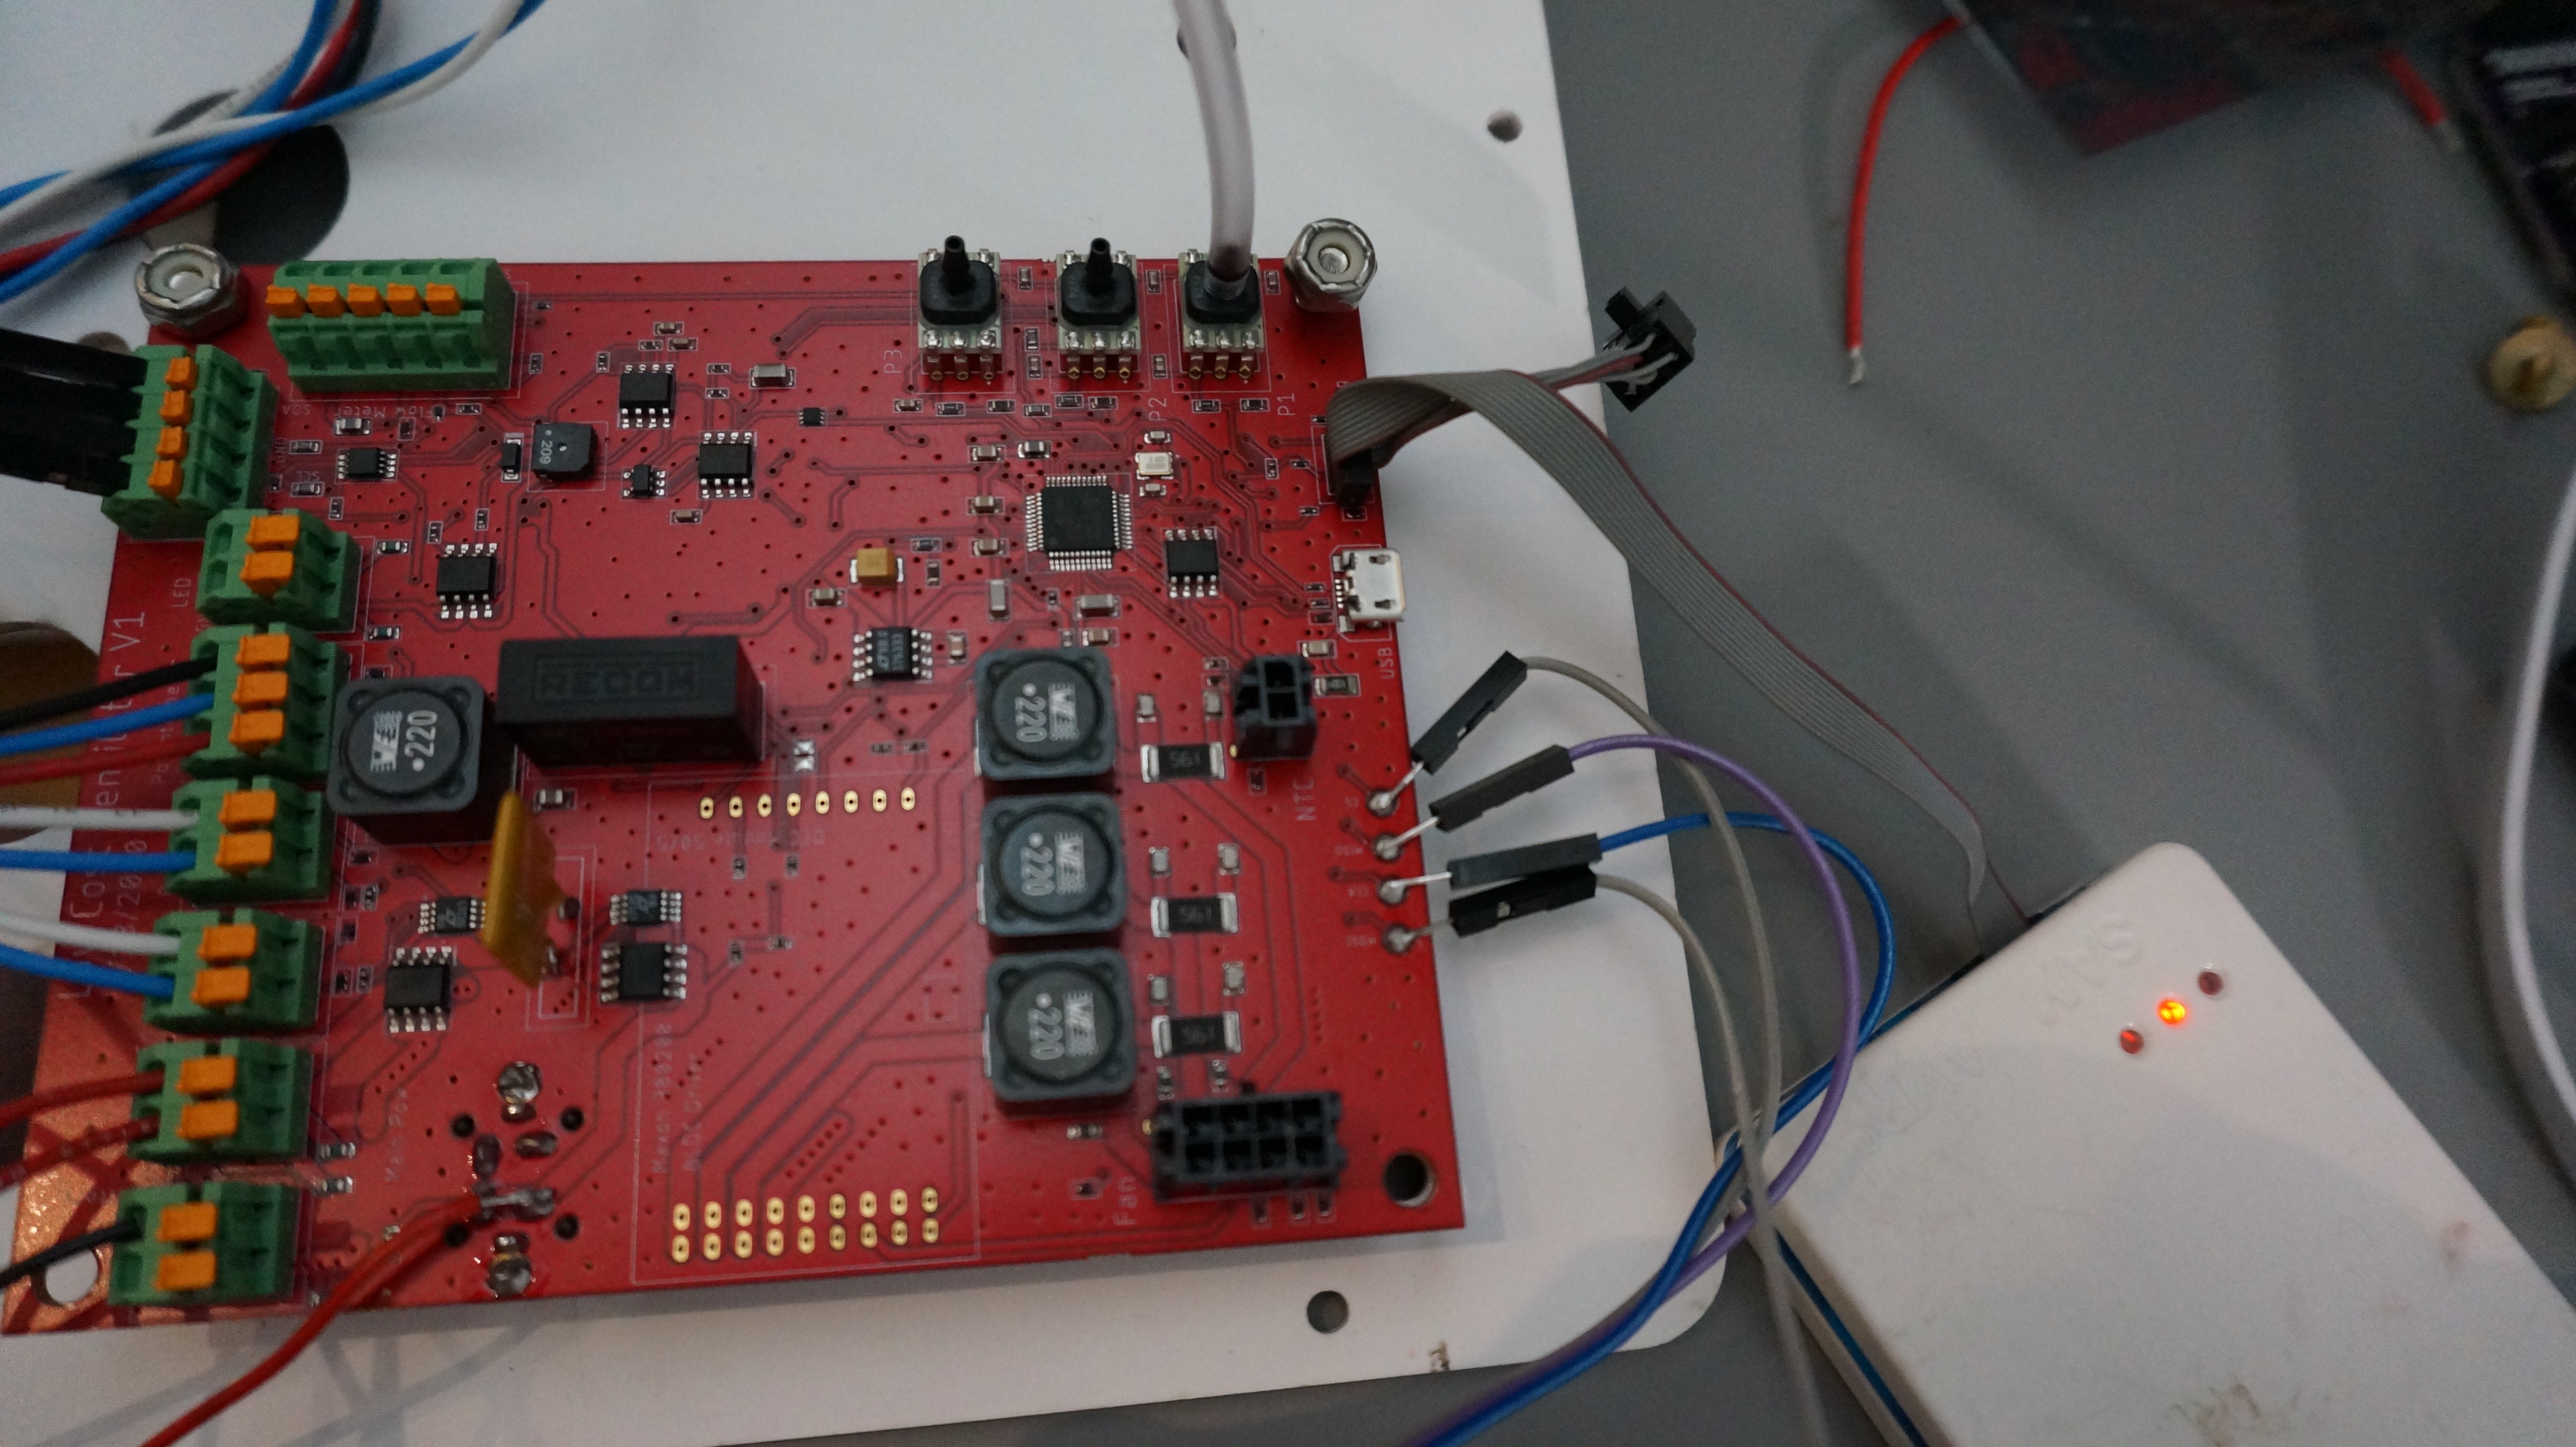
The other main feature not included in breadboard prototype is support for high-speed non-volatile storage. The microcontroller we are using is not one designed for safety critical systems. Nonetheless, we want to bring as much safety to the system as we can. One of the ways this is done is that the internal watchdog on the MCU is set to have a very short timeout. If the MCU locks for even a short time and the control loops is delayed, the MCU will be reset. However, when we do this, all operational state information and settings are lost. Therefore, the state information is periodically written onto fast, non-volatile FRAM storage during normal operation, and loaded on boot. Therefore the system can come back up in a known state and can continue operating safely. A CRC is used on the stored data to ensure its integrity. The FRAM we used is accessed through SPI, and can be operated at up to 20MHz. Unlike flash or EEPROM, it does not take extra time to write to it, it writes at the full bus speed. In addition, it has effectively infinite read and write cycles. Just like for the I2C interface to the LCD, the SPI interface here was written to be fully asynchronous and interrupt driven. It cannot block the operation of anything else. Therefore, we can periodically write to the storage during every control cycle and not worry about the overhead. Since we knew this would be a major firmware development that we couldn't easily prototype before, the board design included large test pads for all the SPI pins. The image below shows wires soldered to these pads that were then connected to a digital logic analyzer for debugging.
![]()
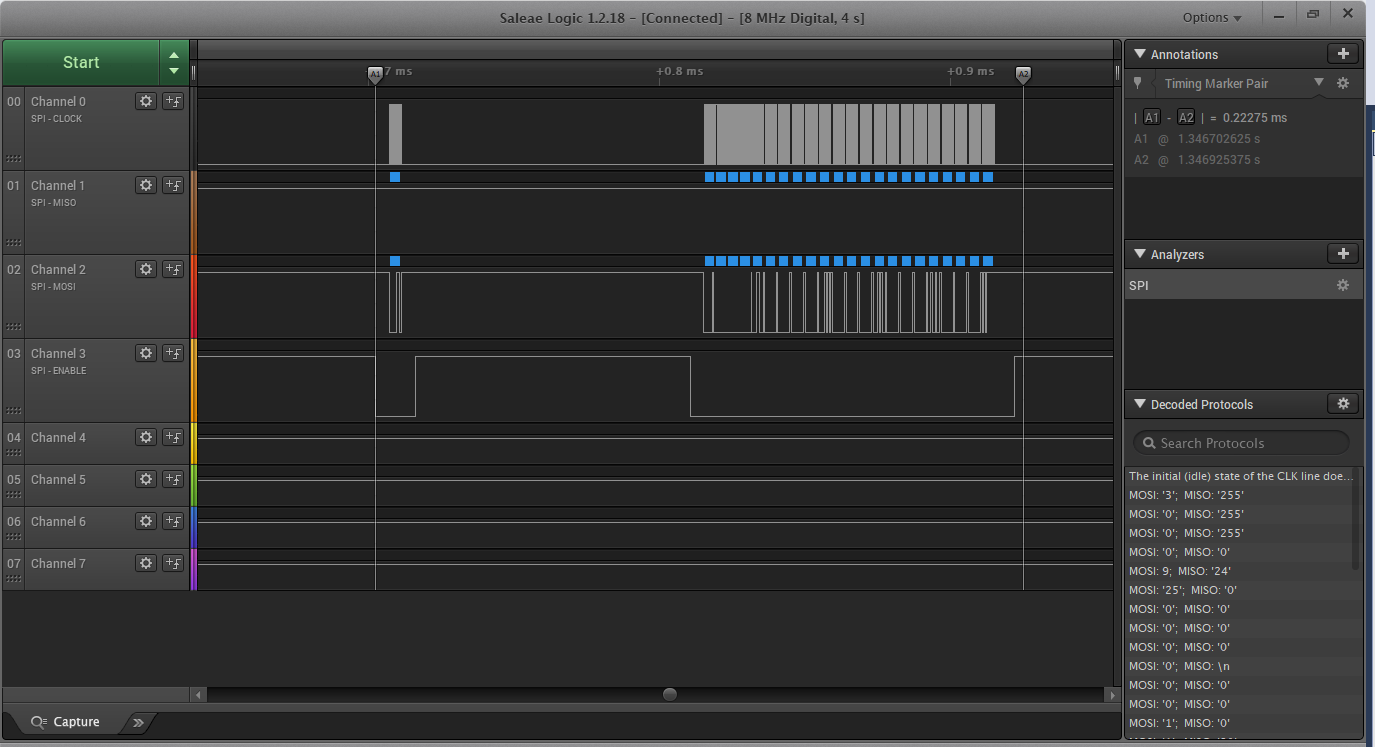
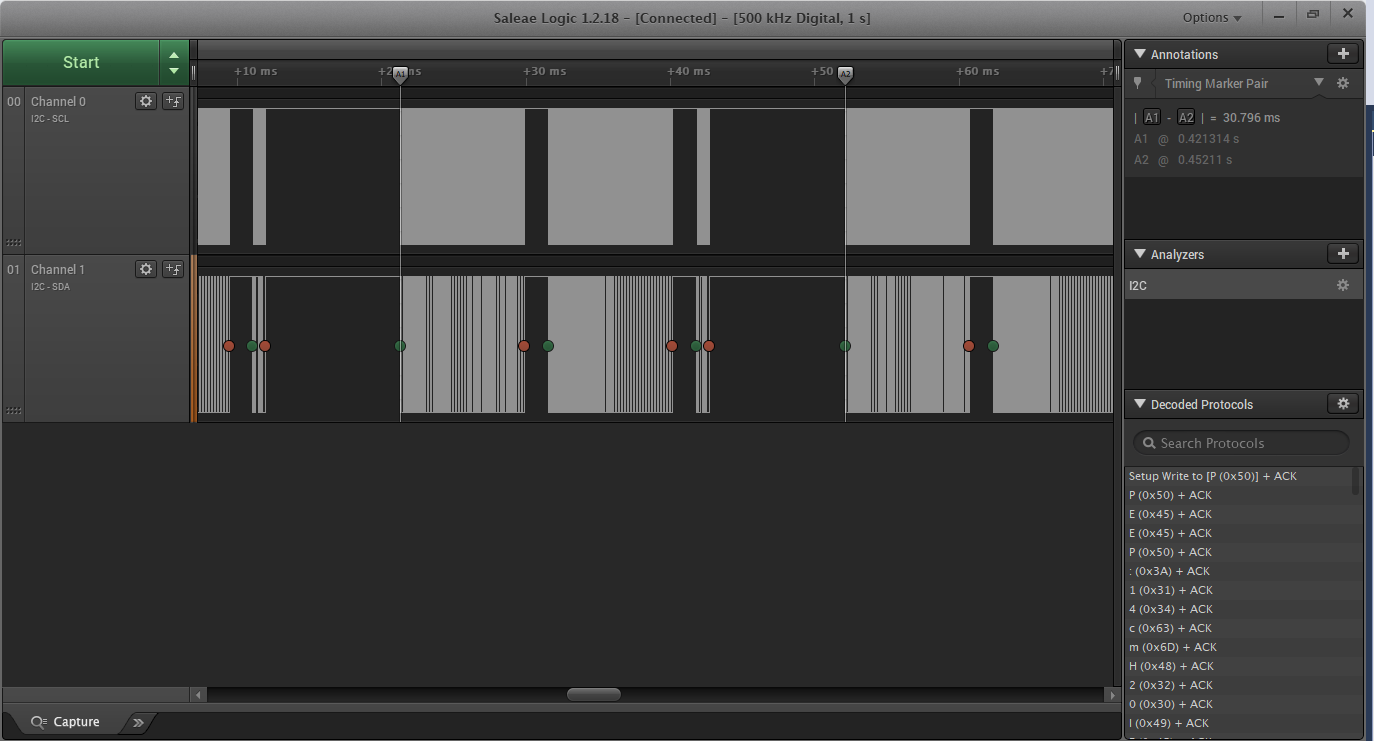
I am very thankful that we included these test pads. Debugging SPI can be very difficult without using a logic analyzer. In this case, it took some time, but I got it working. The image below is a screenshot of the logic analyzer data when a write occurs. The SPI bus is operated at 2MHz, and the entire write requires about 0.2ms. More optimization is certainly possible, but this is fine for now. This FRAM automatically locks itself from writes, so before any write a write enable command must be sent. That is what is seen here. The FRAM is unlocked and then the current settings are written to storage.
![]()
Operation Demo
A basic demo of the interface and operation of the system is shown in the video below:
NEXT STEPSWe are getting very close to hooking up the blower motor and the air circuit, and doing initial "breathing" tests! More to come.
-
Making the Jump to RTOS
04/13/2020 at 04:16 • 0 commentsWhile the Arduino platform is great for quick-and-dirty prototypes, everyone who has tried knows it is a huge pain to use it for relatively complex prototypes. We know this, and had been considering for a while moving to a more professional HW and firmware design for the microcontroller on the vent. Feedback from some other engineers, testing of the interface with our LCD, and this article all contributed to a fairly large change in the direction of the HW of this project. Instead of using an Adafruit Feather M4 daughter board and the Arduino platform, we moved to an ATSAMD21G18A microcontroller placed on our main PCB. At first glance, it may appear to be an odd choice. We were worried about capabilities and went backwards? The SAMD21 has a Cortex M0+ and runs at a maximum 48MHz. It is effectively the little brother of the SAMD51 with Cortex M4F that the Feather M4 has. However, it turns out that the extra horsepower is really not needed. What is needed is more careful and efficient control of the MCU peripherals which comes from moving away from Arduino.
If there was one picture that could explain the challenge with Arduino, it is the following. The LCD interface is I2C and the LCD does not support a frequency higher than 50kHz. The addressing of characters is not sequential on the LCD, so re-writing the entire screen requires 3 separate I2C transactions to set the 80 characters (4x20) on the LCD character display. Because the I2C speed is so limited, this causes a big challenge. To update the screen every 30ms, the I2C bus is heavily used. This image is of our updated hardware and firmware. The Arduino Wire library has a maximum buffer of 32 bytes, so it actually requires even more transactions!
![]()
Some more minor optimization could be done, and was done. I modified the firmware to only write any bytes that had changed, and not the entire buffer every time. However, we must consider the worst case, and in that case roughly 2/3 of the time is spent writing to the LCD. Using a blocking I2C driver like Arduino's Wire library, this would be a major challenge, and likely very dangerous. We cannot allow updates to the display to interfere with pressure control of the ventilator. As the linked article above notes, the answer is to use a Real Time Operating System (RTOS), and intelligently use the microcontroller's peripherals to prevent blocking and free up the CPU for other use. If you have never used an RTOS, give it a try. We are using FreeRTOS, one of the more commonly used RTOSs out there. An RTOS gives the developer access to all sorts of useful features such as multitasking (with defined task priorities), software timers, data queues, semaphores, and others which make developing complex systems far easier, faster, and more reliable.
In the case of the ventilator, we have screen buffers for various screens (currently a main and an alarm screen). A software timer switches between the two if any errors are detected. A separate software timer generates the needed I2C transactions to write the screen buffer to the LCD, and adds them to the queue. They are asynchronously pulled from the queue, and handled in the SERCOM I2C peripherals with extremely minimal CPU involvement. What used to be 2/3+ of the total loop time is now a negligible amount, and much easier to develop and understand.
On top of this, FreeRTOS allows easy prioritization. We can ensure that the control loop has higher priority than the HMI task, for example. We don't care if the LCD updates a few milliseconds later, but we want the control profile as perfect as possible.
At this point, we have most of the code structure up and running, and FreeRTOS running on Microchip's SAMD21 Xplained Pro development board. It updates the LCD at ~33Hz, handles settings inputs from our buttons and potentiometer, and runs an initial control loop depending on the parameters.
The "control loops" can be separated similar to how GN&C are separated out for flight software/robotics applications. The "guidance" portion determines where we need to go. For this application, it determines the desired pressure set-point. In general, "navigation" consists of determining where we are. Currently, this is simply trusting the flow sensor and redundant voting pressure sensors. But tubes can stretch and move, so in the future, this may involve more complicated estimators. Certainly we would like to detect attempted breathing, which would fall under "navigation." Finally, "control" is driving our blower to track or hold the desired pressure set-point at any point in time.
For now, the "navigation" section is set up to track trapezoidal pressure profiles. There are a low of parameters that can be adjusted. The breaths per minute (BPM), peak inspiratory pressure (PIP), positive-end expiratory pressure (PEEP), inspiratory to expiratory (IE) ratio, and rampup/rampdown times are all adjustable using the HMI button and knob. The correct profile is calculated and created over time.
The first controller set up is a PIDF controller designed with pressure as input and non-dimensional control effort from [0-1] as output. Some common-sense practical features such as integral anti-windup, integral-acting error range, and error derivative filtering are implemented. As we do not yet have any sensors or a blower to actually control, for initial validation only the feedforward term is used, which effectively multiplies the desired pressure setting by a constant to generate the control effort. This is mapped to 3.3V on the DAC, and we can see on the oscilloscope that the desired trapezoidal profiles are generated.
In the case below, the system was set for 20 BPM, or 3s per breath with an IE of 3:1. The internal oscillator on the MCU is used, so timing isn't perfect, but very close.
![]()
For safety, the system shuts off the motor if the enable switch is turned off. We need to be careful if the system is turned back on that there isn't retained memory of the pressure profile such that we jump straight to PIP level on re-enabling the system. The below image shows how the profile always restarts. In the future, we may add even softer ramp-up starts. Of course, the pressure increase won't be as sharp as the DAC output.
![]()
The case below shows the extremes we currently allow (although subject to future tuning), at 60BPM, maximum PIP, minimum PEEP. This case has IE of 2:1, although with the rise and fall times still at 200ms each, it is more difficult to see this. It also shows the system disabled at PIP, then re-enabled safely.
![]()
By using a professional development environment, and professional tools such as FreeRTOS, we bring more safety and reliability to this project.
-
LCD and Flowmeter Testing
03/29/2020 at 22:07 • 0 commentsIn support of our PCB design, and to test out some of the more uncertain concepts, we set up a breadboarded prototype of the LCD and the flowmeter. The main components in the prototype:
- Adafruit Feather M4 Express (SAMD51-based microcontroller development board
- SFM3300 flowmeter (+/-250 SLM full scale range, I2C interface)
- NHD-0420D3Z-FL-GBW-V3 LCD display (4x20 backlit LCD character display)
The prototype was set up as shown below. The flowmeter and LCD both require 5V power, but the flowmeter is compatible with 3.3V level I2C communication. The LCD requires logic level shifting up to 5V. The LCD also can only communicate at up to 50kHz SPI. For maximum use of this project, the hope was to set up the firmware to use Arduino API's where possible. Unfortunately, for the Feather M4, the I2C speed cannot be lowered below 100kHz using the Arduino "Wire.setClock()" interface. I had to lower the rate manually. For reference, the snippet of code for setting up the SAMD51 in slower I2C is as follows (and all this on our GitHub as we update it):
// Setup I2C at <50khz for LCD

    Wire.begin();                                     // Set-up the I2C port
    sercom2.disableWIRE();                            // Disable the I2C SERCOM

    GCLK->PCHCTRL[23].bit.CHEN = 0; // 23 is SERCOM2
    while(GCLK->PCHCTRL[23].bit.CHEN != 0);
	GCLK->PCHCTRL[23].bit.GEN = 0x04;			// Generic clock generator 4
	GCLK->PCHCTRL[23].bit.CHEN = 1;
	while(GCLK->PCHCTRL[23].bit.CHEN != 1);

    // TODO what is GCLK4 actually?
    SERCOM2->I2CM.BAUD.bit.BAUD = 48000000 / (50000) - 1;   // Set the I2C clock rate slow
    sercom2.enableWIRE();                             // Enable the I2C SERCOM
For the Feather M4 board, the I2C is set up for SERCOM2. The peripheral index for SERCOM2 is 23. I set up SERCOM2 to be run off of GCLK4. Underneath all the layers of Arduino, I am not quite sure yet what GCLK4's rate is. Nonetheless, I was able to get about 30kHz clock rate, as confirmed by my logic analyzer.
I set up the firmware to support:
- Display of current information
- Settings input mode using pushbutton to page between settings and knob to choose the particular setting's value.
- Read flowmeter, numerically integrate it and estimate tidal volume
The picture below shows the prototype setup and connections. The interface to the flowmeter was through a fairly long wire. In our design we will use an I2C driver specifically for long distance communication with high capacitance on the lines. This prototype does not have it, but still seemed reliable. The measurements have checksums and I did not see a checksum fail during testing. The flow measurements seem quite stable, and estimation of tidal volume from integrated flow rate seems reasonable.
![]()
-
Flow Meter Update
03/27/2020 at 02:30 • 0 commentsWe have been working hard to design a connector for the flow meter that can be made anywhere.
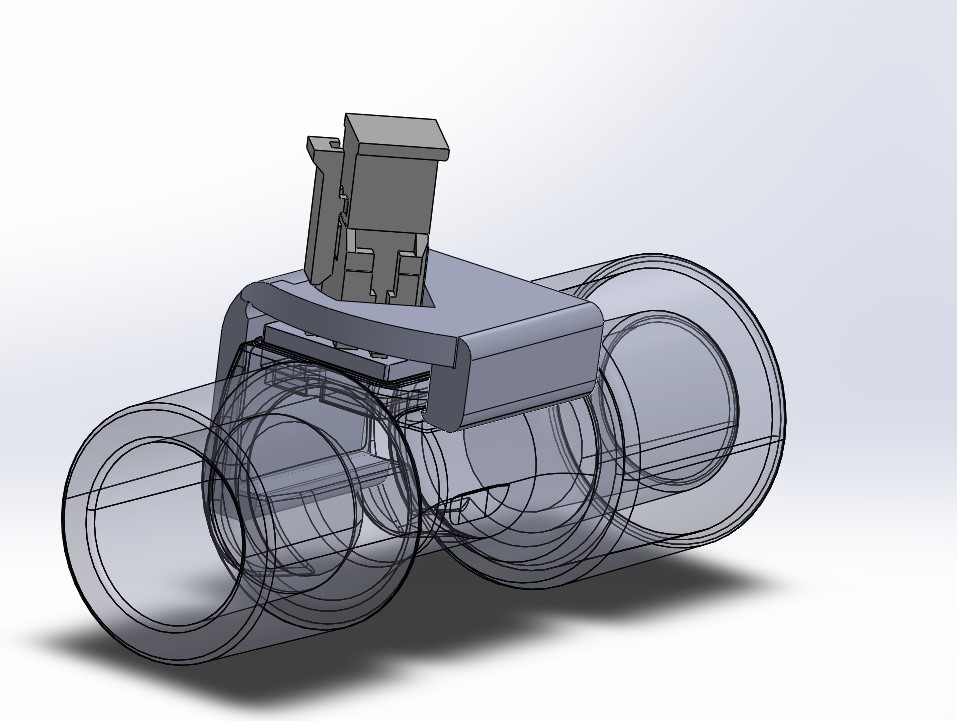
The Sensirion 3300-D flow meter communicates via I2C which is typically an on PCB communication protocol. We are using it at the patient wye which is about 1 meter from the ventilator. The likelihood of poor data quality was high, so we designed a solution using a Texas Instruments P82B715DR I2C bus extender on the main PCB as well as one on the flow meter PCB. This bus extender allows us to go off the board to much further distances without sacrificing data quality. The flow meter PCB is all SMD components. It has spring pins to connect to the pads on the flow meter, and a molex microfit 3.0 connector on top to connect to the main PCB via and off the shelf cable.![]()
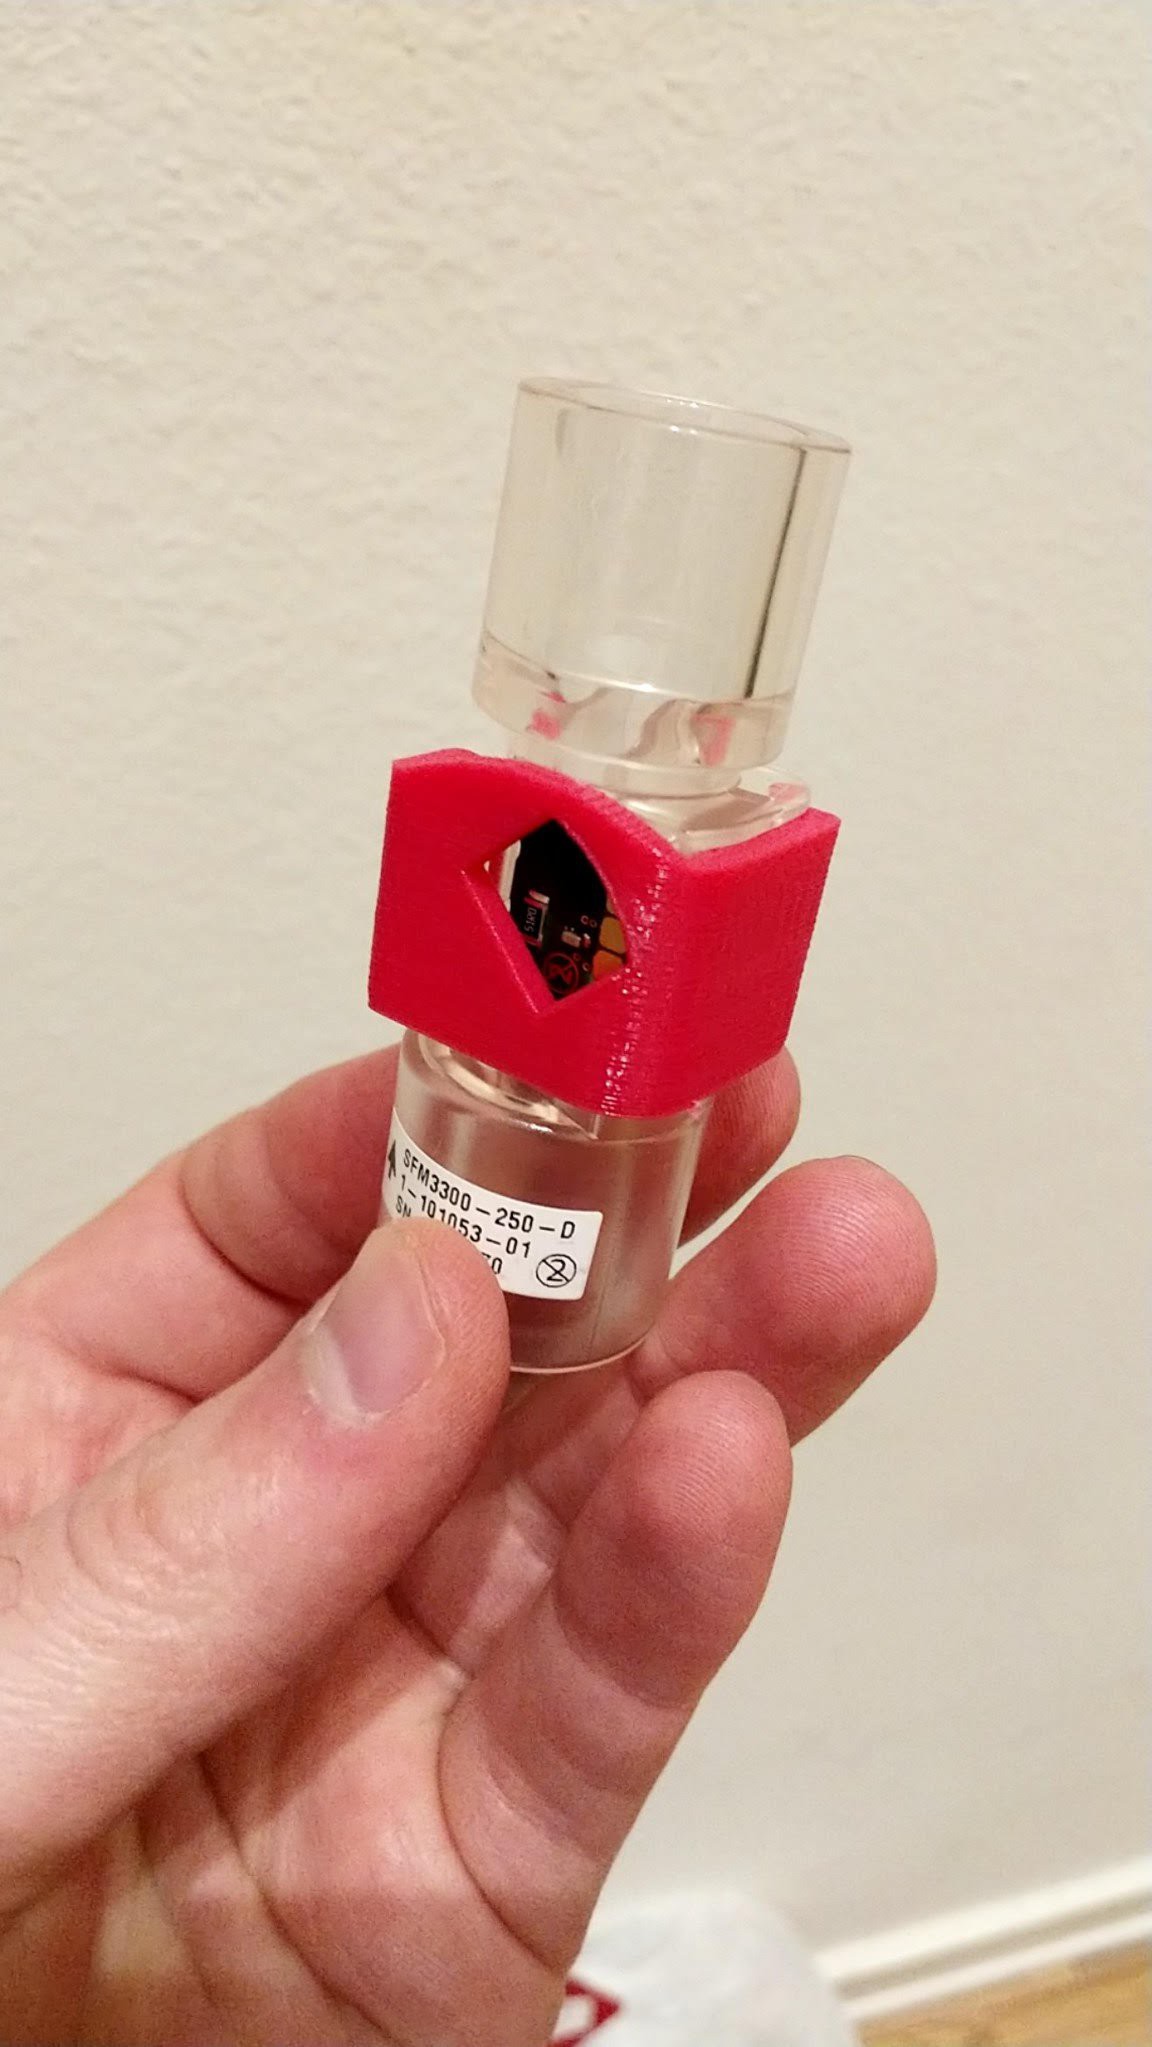
The PCB is held onto the flow meter by a 3D printed clip. Here is a picture of the full assembly.
![]()
Here is a picture of a test print and the clip on the flow meter.
![]()
-
Information Links
03/16/2020 at 02:54 • 0 commentsCovid-19 Ventilation Strategy - https://emcrit.org/ibcc/covid19/#invasive_mechanical_ventilation
APRV - http://rc.rcjournal.com/content/respcare/57/2/282.full.pdf
Spontaneous breathing - http://rc.rcjournal.com/content/respcare/57/2/282.full.pdf
-
To dos- rolling list
03/16/2020 at 02:28 • 0 commentsAdd 2 modes of ventilation that could be useful for Covid-19
- Pressure Control mode
- Inputs
- PIP- Peak Inspiratory Pressure (cmH2O)
- PEEP- Positive End Expiratory Pressure (cmH2O
- BPM - Breaths per minute
- FiO2
- Output
- Directs user as to flow rate setting for oxygen
- Inputs
- APRV- Airway Pressure Release Ventilation
- Inputs
- P-high (cmH2O)
- P-Low (cmH2O)
- T-high (seconds)
- T-Low (seconds)
- FiO2
- Output
- Directs user as to flow rate setting for oxygen
- Inputs
Add startup checks for the ventilator:
- Tightness test
- Turn on blower to max and ensure that the pressure increases to static pressure and hold for 1 minute to verify that flow does stop.
- Flow meter offset calibration
- The tubing and system will have air capacitance that needs to be subtracted to get correct tidal volumes. Pump up the system to max pressure and create a flows table. Do this 5 times and take average.
Add Alarms to ventilator- alarms to be published to cloud and sent out be sent out to hospital staff.
- Pressure Control mode
Low Cost Ventilator
Low cost ventilator for standalone use during the Covid-19 pandemic