Giulio Pons
-
Building from scratch
06/07/2020 at 16:12 • 0 commentsI've tried to build the oximeter from scratch, with a LTR-301 photo transistor and it doesn't work as expected.
The problem is the LTR-301 spectral response which is quite narrow around 940nm. So it doesn't receive the red light!
To build from scratch (without hacking a KY-039) we need to use a wide range photodiode, such as the LPT 80A which can receive both red (600 nm) and infrared (940 nm) light.
Maybe finding a phototransistor with Srel (Relative Spectral Sensitivity) value around 600nm very similar to the 940nm (in this one it's 50%) is also better:
![]()
-
New video with 3-leds oximeter sensor
05/10/2020 at 10:01 • 0 commentsI've improved the display visualization and this is a video with the sensor with 3 leds (white, red, IR).
It detects faster the beats and the measures now do not depend anymore on ambient light.
I've had also to re-calibrate the sensor.
-
Op amp
04/25/2020 at 21:24 • 0 commentsNow I think that I should add an op amp to read better signals and have more stable measures.
-
How to get more precise values?
04/25/2020 at 13:19 • 3 commentsI've got a big problem because this oximeter isn't effectively working fine. It works if there is enough ambient light from sun or from an electric lamp, but every time the light changes (just a shadow that passes over) the average value of the signals from the photodiode rise (less light) or fall (more light).
These changing cause problems (or impossibility) to have correct and stable measures of saturation in every situation.
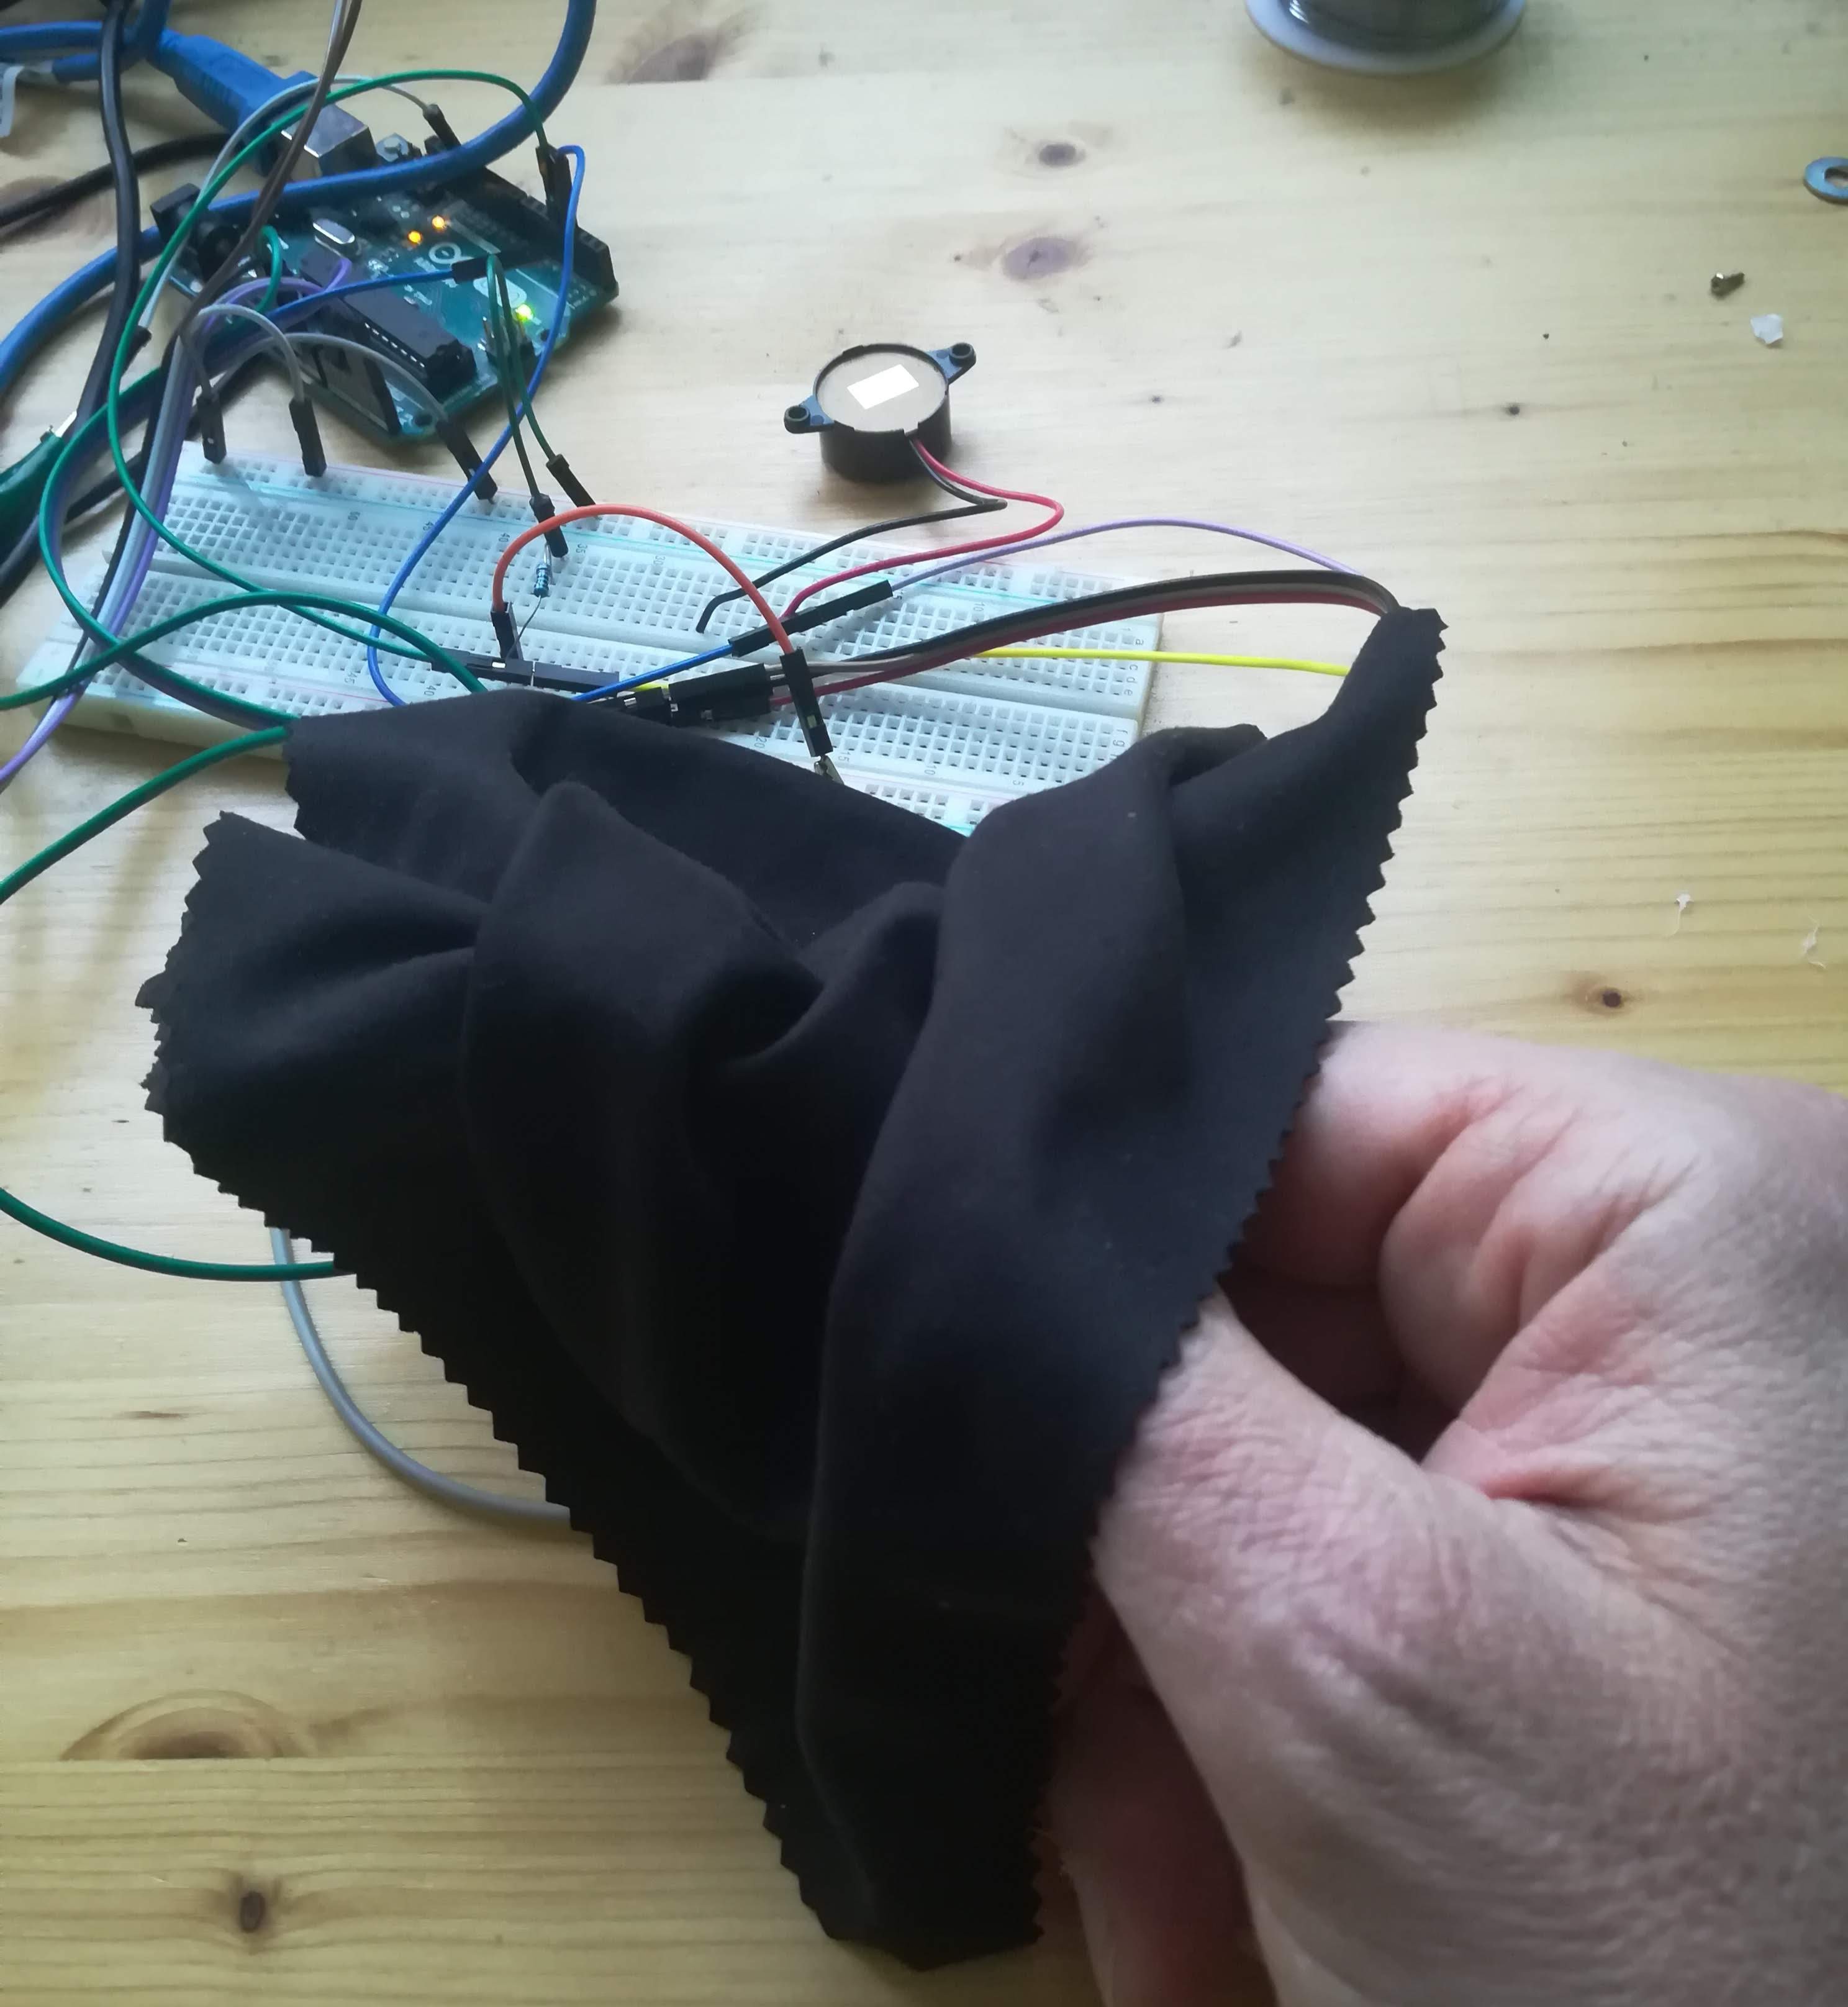
So I've tried to cover the finger, leds and sensor with a black cloth, but the result become also worst. The photodiode signal is really obfuscated with noise that prevents the code to find peaks and then bpm and SpO2.
Since it works better with some additional (ambient) light, I've added a third led, a white led. And decided to take measures with the black cloth covering all the stuff.
The result is better than black cloth without third led and I can read signals again, but now the reads should be independent from ambient light.
What do you think about it? Is this a bad idea?
How can I get better values from the sensor?
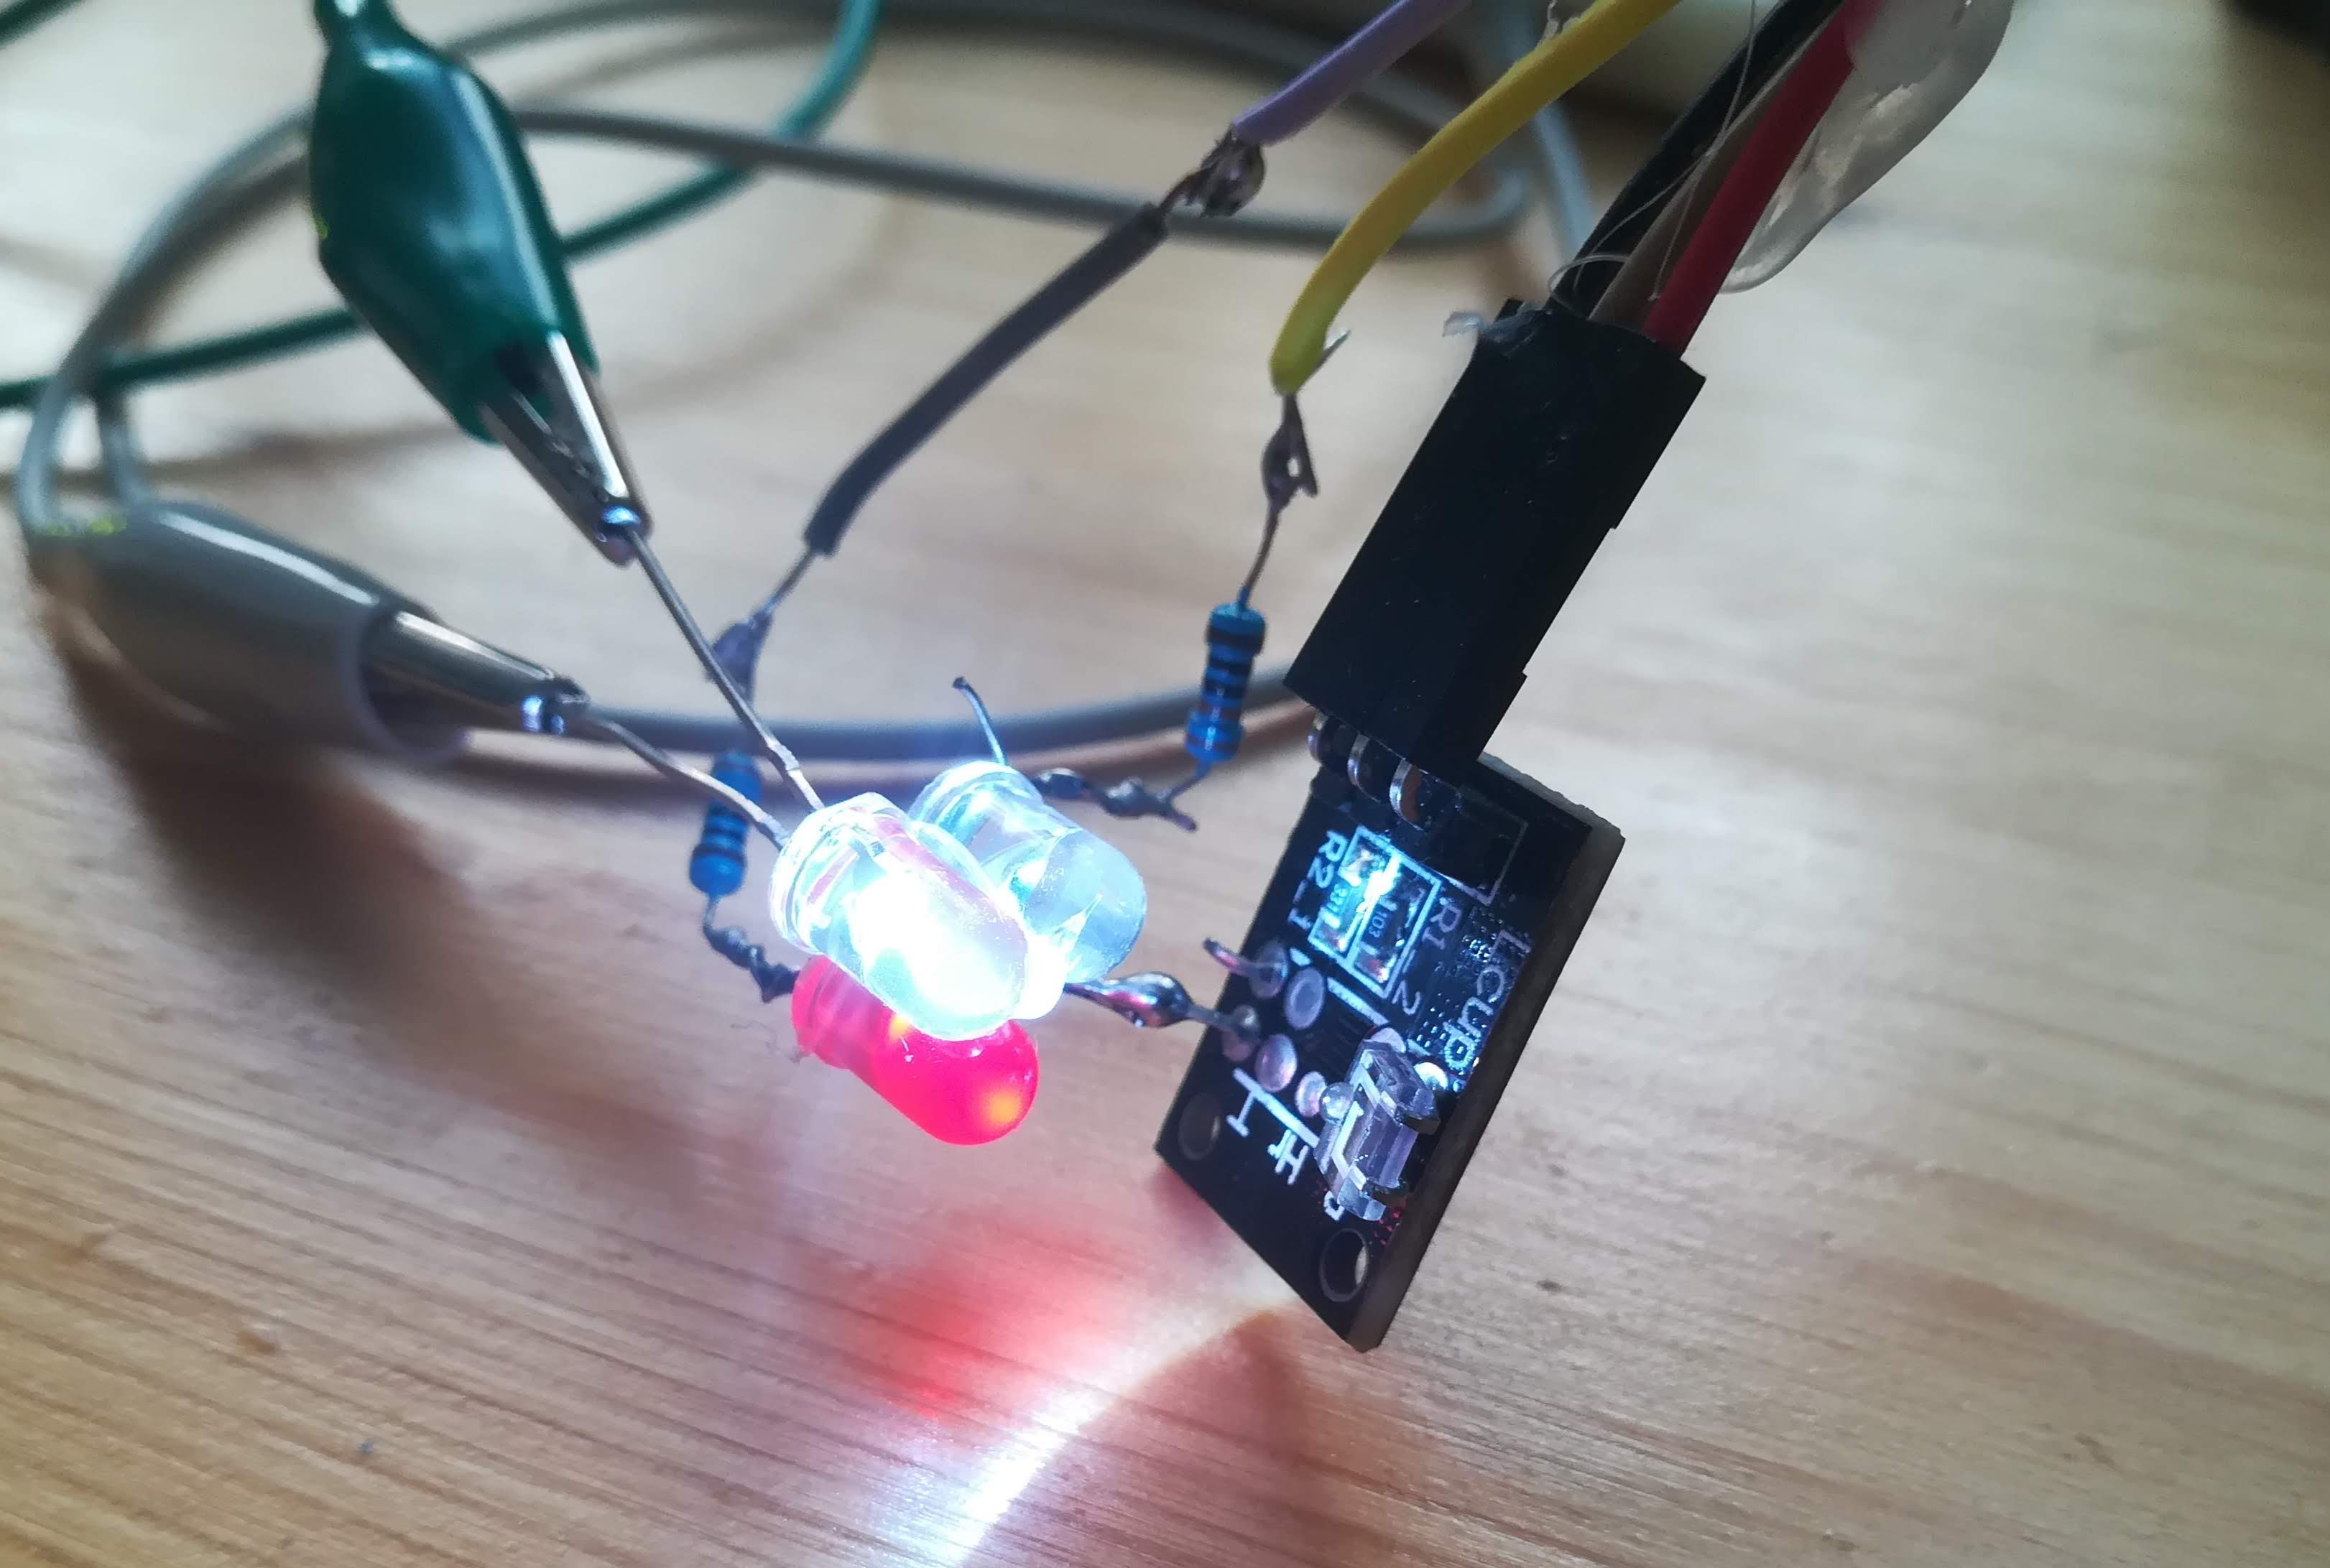
![]()
red - infrared - white leds ![]()
the sensor is covered with a black cloth to have always the same conditions -
Fixing erros
04/22/2020 at 07:33 • 0 commentsI've updated the project details, there were so many english errors, and some concepts were not cleared explained, I hope now it is more readable.
I've also uploaded the project to the The COVID-19 Detect & Protect Challenge on Hackster site, at this link.
-
Calibration of the homemade oximeter
04/18/2020 at 22:15 • 0 commentsIn past days I've made the calculation of Min and Max of both IR and RED led signals.
I've also calculated R and today I've found a working oximeter to calibrate mine.
So, just updated the the code and completed the details.
Next step: make a complete schematic with all the parts since in the project there is also a LCD display 16x2 to show bpm, SpO2%, and some other informations, while the plot of the signals is made with the PC.
-
Max, Min and R calculation
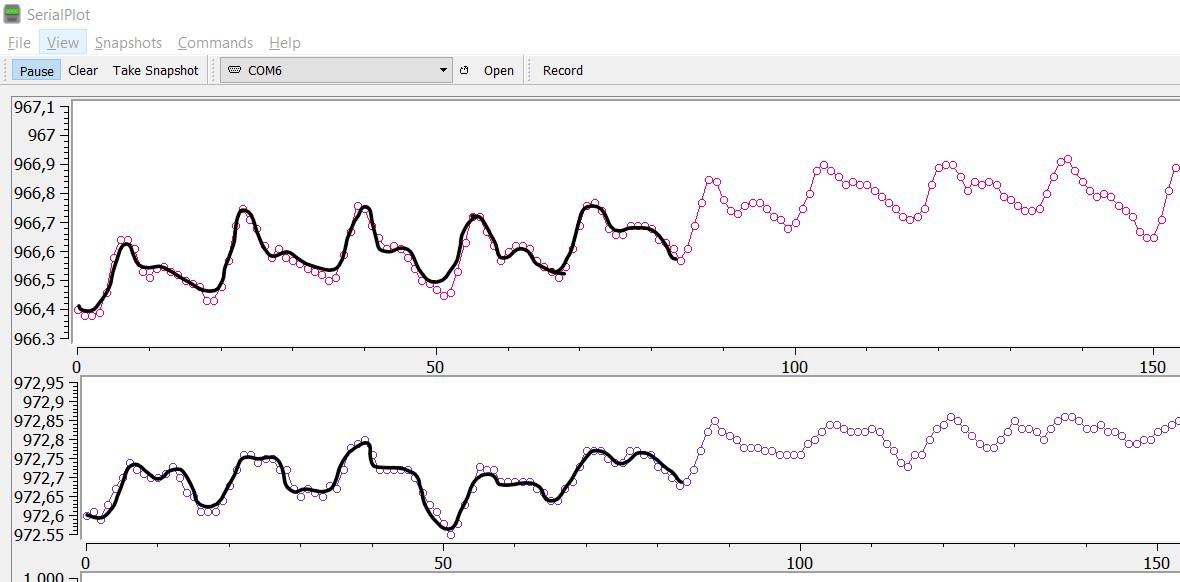
04/15/2020 at 21:45 • 0 commentsI've modified the sampling parameters, after the average on 20mmsec (to remove electric light noise) I use 1 sample to plot the chart. You can see better the typical "dicrotic notch".
![]()
Changing the number of samples that are averaged smooths the curves.
![]()
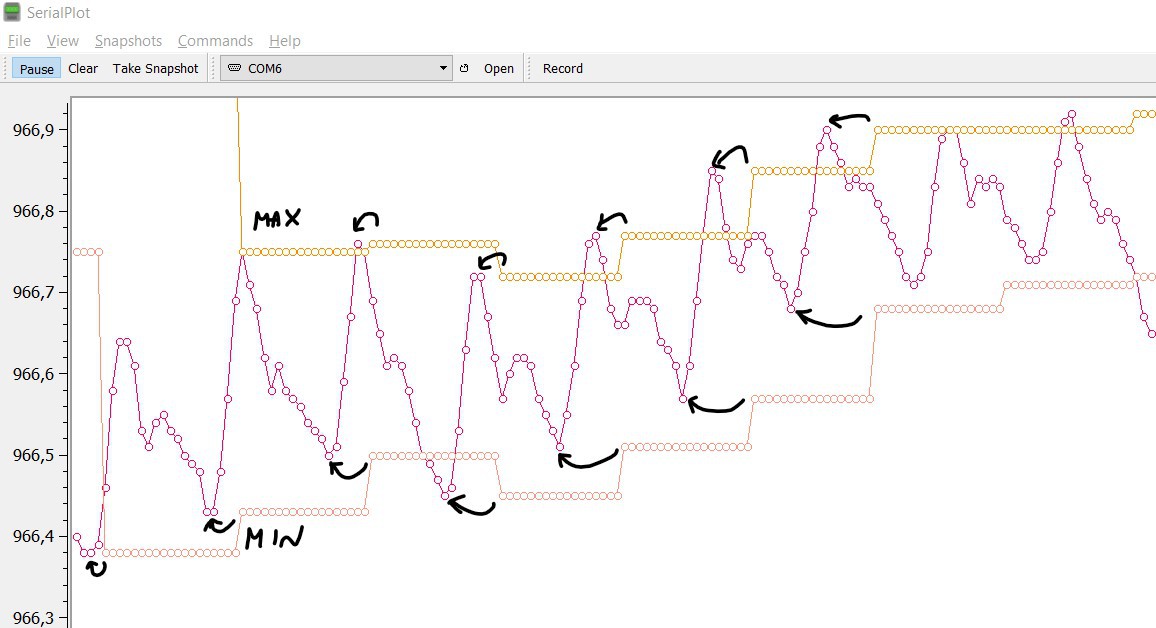
I count the peaks, so I can estimate the period of the heartbeat, the period is the time between two rising curves. Knowing the period and the times I sample the signal I can determine how many samples there are in a period: I make a sample for IR (20 mmsec) and a sample for RED (20 mmsec), so every sample happens every 40 mmsec (I suppose calculation time is enough small)
Knowing this number, I can search in the last N samples for Max value and Min value. N is period/40.
Now I have Min, Max and can determine every N samples the R coefficient.
The period, N and R are not fixed. They are continuously calculated.
I've tried to plot min and max, but when I plot they are not synchronized with the signals, because they are calculated a period later.
![]()
Now. I have to connect R with Sp02, this work is known as "calibration" of the oximeter.
Do I need another oximeter to calibrate mine?
-
Added the code
04/13/2020 at 10:08 • 0 commentsI've added the Arduino code for my oximeter.
At this moment it doesn't calculate SpO2 yet. It plots the two curves (IR and RED) and calculate BPM in two different ways. Next step: calculate the MIN and the MAX for each curve, calculate R and determine the function that connects R to SpO2.
-
Details updated
04/12/2020 at 15:39 • 0 commentsI've updated the details of the project, I've added how I've modified the KY-0039 heartbeat sensor to add another led and performs a double read, using both red and infrared leds.
Oximeter do it yourself
In this period of isolation, I'm trying to build an oximeter with parts already in house. An oximeter is made by two leds and a photodiode.