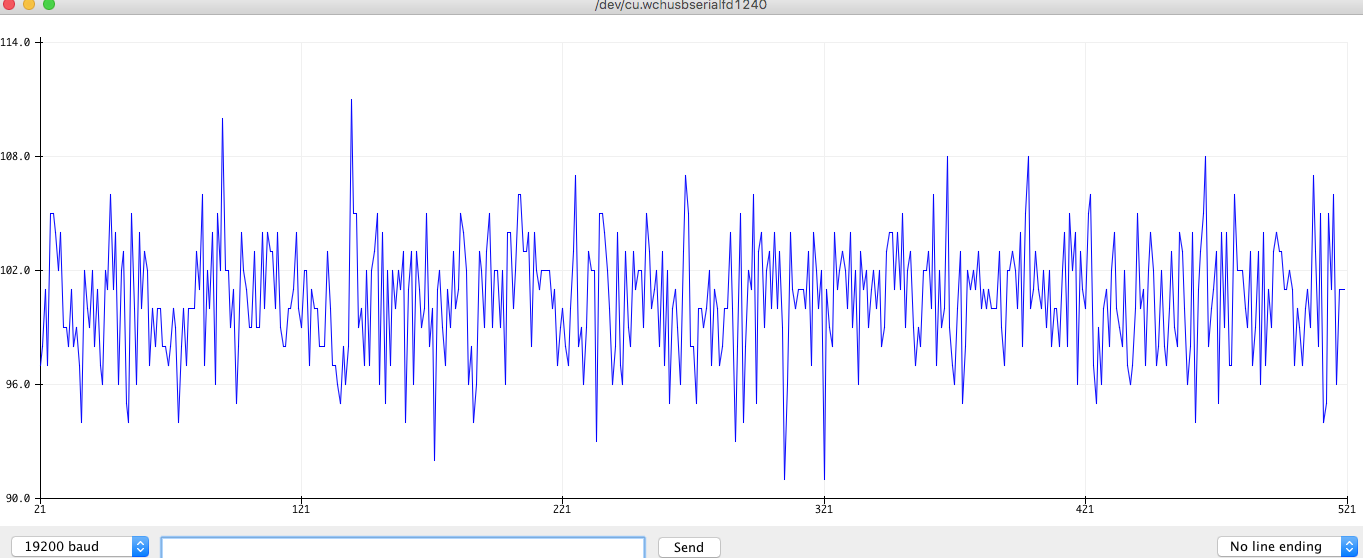
while working with the VL53L0x i have been dealing with issues with noise and wanted to have a cleaner signal for several measurements at different distances. it was taking up to a minute for the signal to stabilize to a near flat value and repeat values from using a default low pass digital filter
i have included code for the arduino that has a hybrid filter that changes its amount of filtering depending on the rate of change in the signal. it does not us RC or π math, just averaging and some scaling, and some conversion of floats to longs. there is a function called filternoisereductionbox( ) that can take a noisy signal and output a clean one, it also does not take forever to adjust to change.
the arduino code, can do a few things. it can filter analog inputs, it can respond to changes quickly and when near wave peak it can provide more filtering to reduce noise further, and it can let you know when the signal is stable and no longer changing within a set amount. this is useful for measuring devices, and analog signals where there is a lot of noise, or where accurate measurement of values is needed over a shorter time.
this is really just a fancy band pass filter with a sharp cut off. with measurements there still could be slow drifts that are not accounted for, temp, air moisture level, surrounding static charge, magnetism, moon gravitational pull. just a few out of a million things that effect analog devices. for the TOF flight sensor I am using for my projects i want it to have an accuracy of +/-0.5mm. since it is only able to measure 1mm differences, the noise in the environment will help with fuzzy readings to get +/-0.5mm.
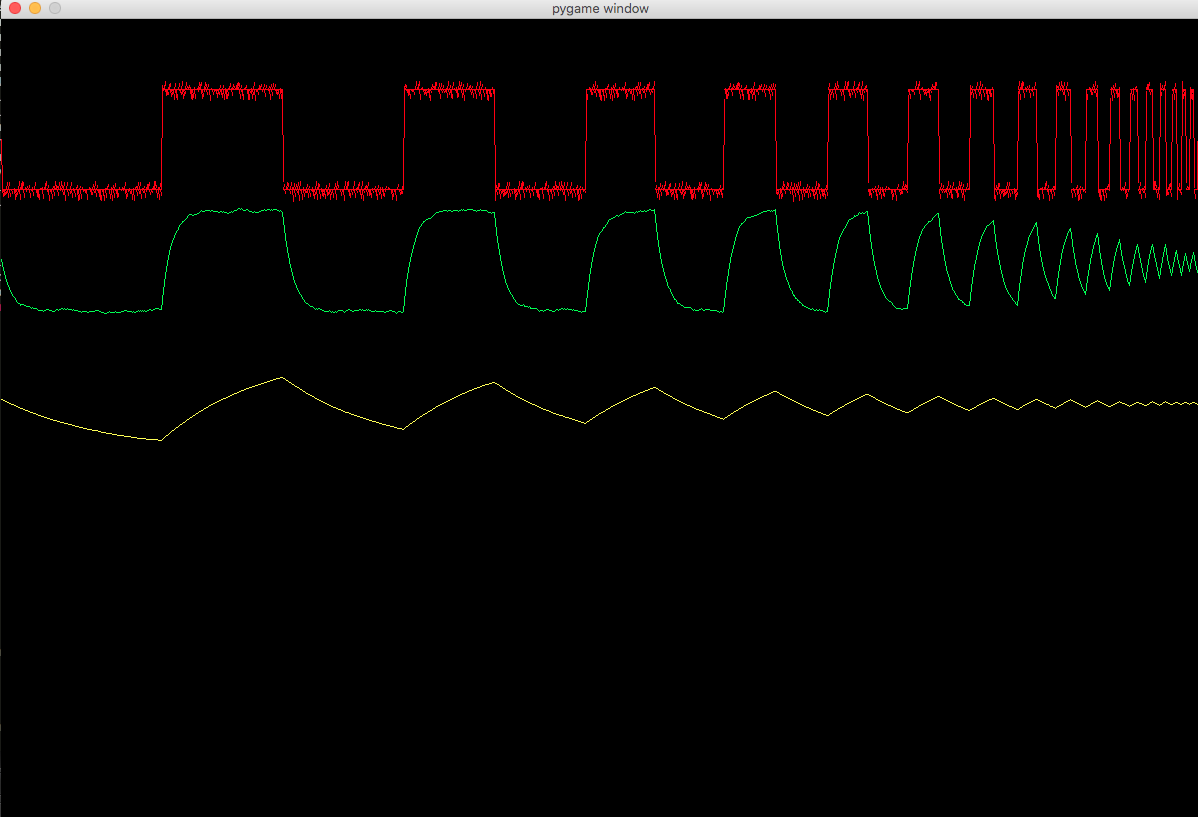
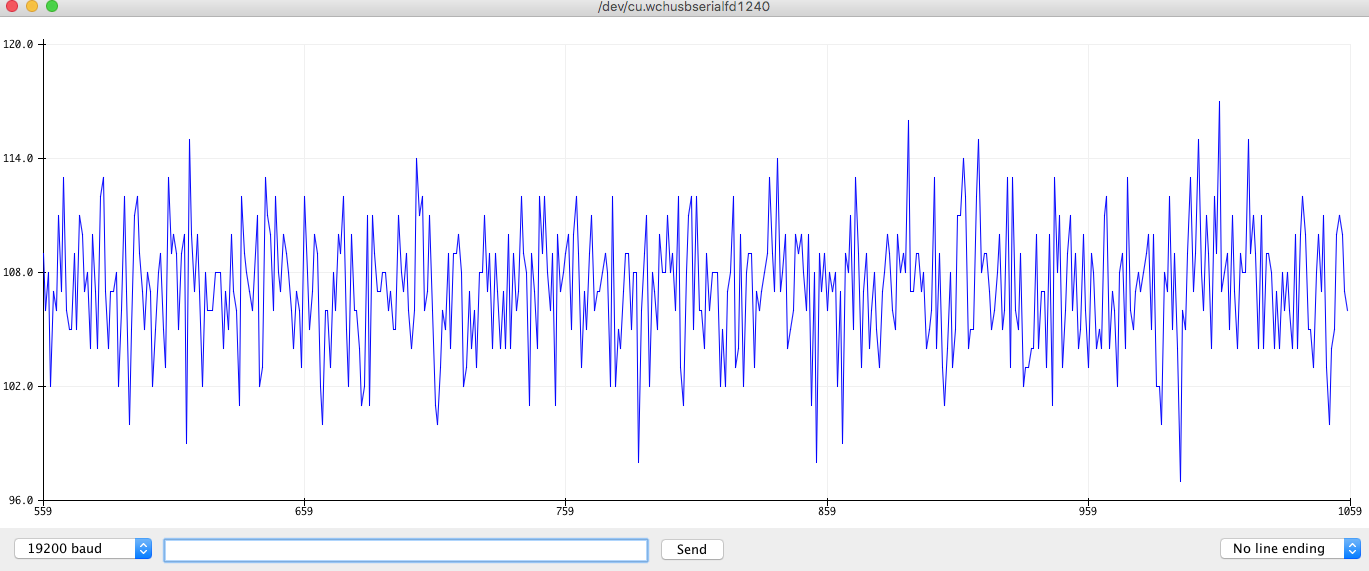
included below is a program called lowpassfilter.py it does a few things. first it includes actual random noise from a sample of random.org of lightning strike data. it is as random as you can get. noise has been reduced to be less than 10% of signal. in this example filtering is done from a low pass filter that
just takes samples and averages them by 10 samples on green line and by 100 samples on yellow line.
the low pass filter is often used to reduce noise, but at a cost of response times. the more samples are averaged, details are lost if looking for the same speed of measurement. you would normally need twice as many samples as averaged for reliable data such as range finders, distance, or a dc analog value to be at a value that could be accurate. this graphing shows frequency with over 7 times increase in rate with same samples of averaging 10 and samples of 100. you can still see noise samples in the sample of 10.
samplehold=(samplehold*99 +ref_from_signal*1)/100 even simpler is
samplehold=samplehold*0.99+ref_from_signal*0.01
now if we look at data, we can also look at rate of change of signal by taking
signalA=signalA*0.49 +ref_input*0.51 and taking signalB=signalB*0.51+ref_input*0.49
and then taking difference is= (signalA -signalB) *2 *10 to get change in signal up or down
we then take the absolute value and we come up with data that can represent the real time rate of change
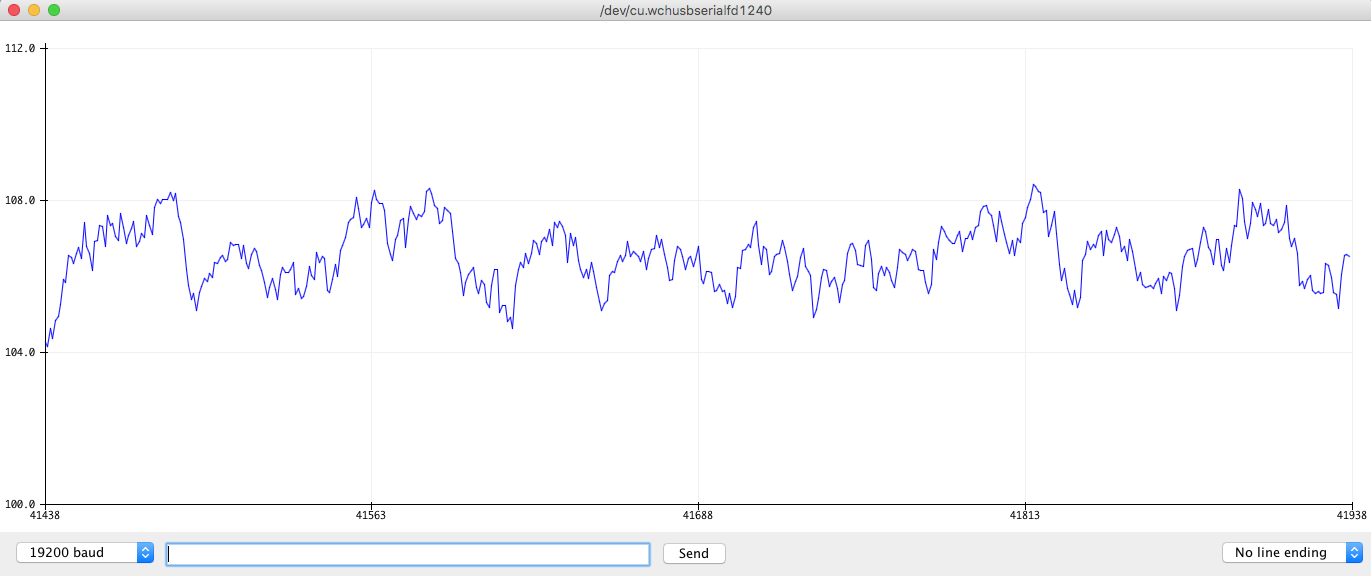
it does a few things. 1 it shows us the rate of data change with above graph. rate of change increases as difference in signal changes. also these are peak to peak waves. when taking measurements changes can be smaller than lowest and highest values
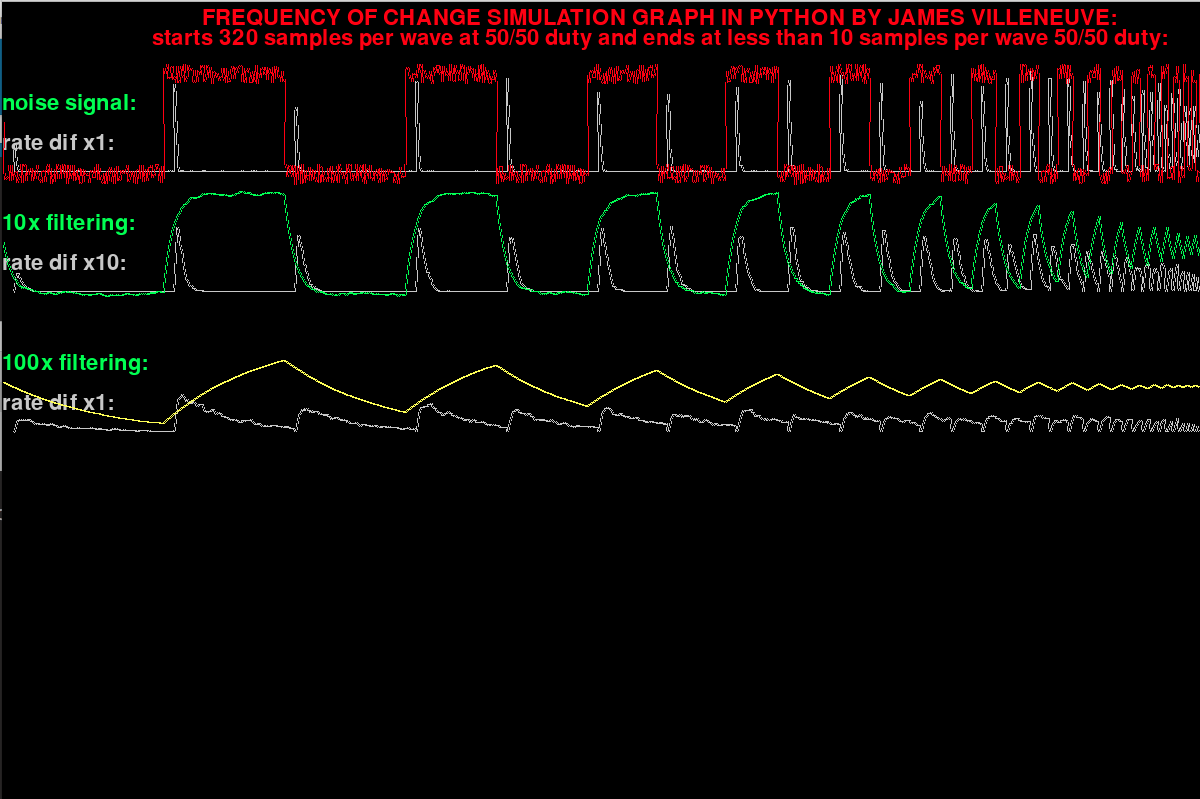
and it allows us to see a few patterns. when the change rate is low, the signal is stable, and we know when the signal is not stable, it has a higher rate of change. the 100x filtering signal will almost never become stable in the times given in these examples. but it also is the most filtered and least noise signal.
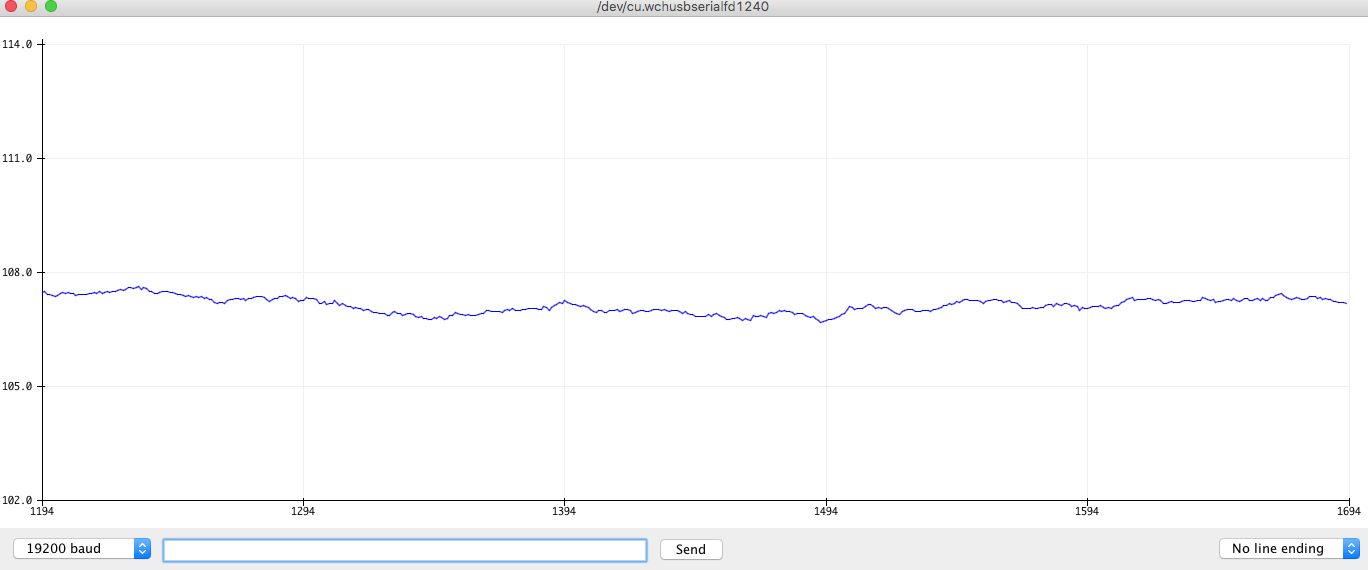
here is a graph from program called bandpassfilterWdetectionOfStability.py that shows how detecting rate of change can show you a stability in signal for a time to measure. but in 100x sample rate of change is still too slow.
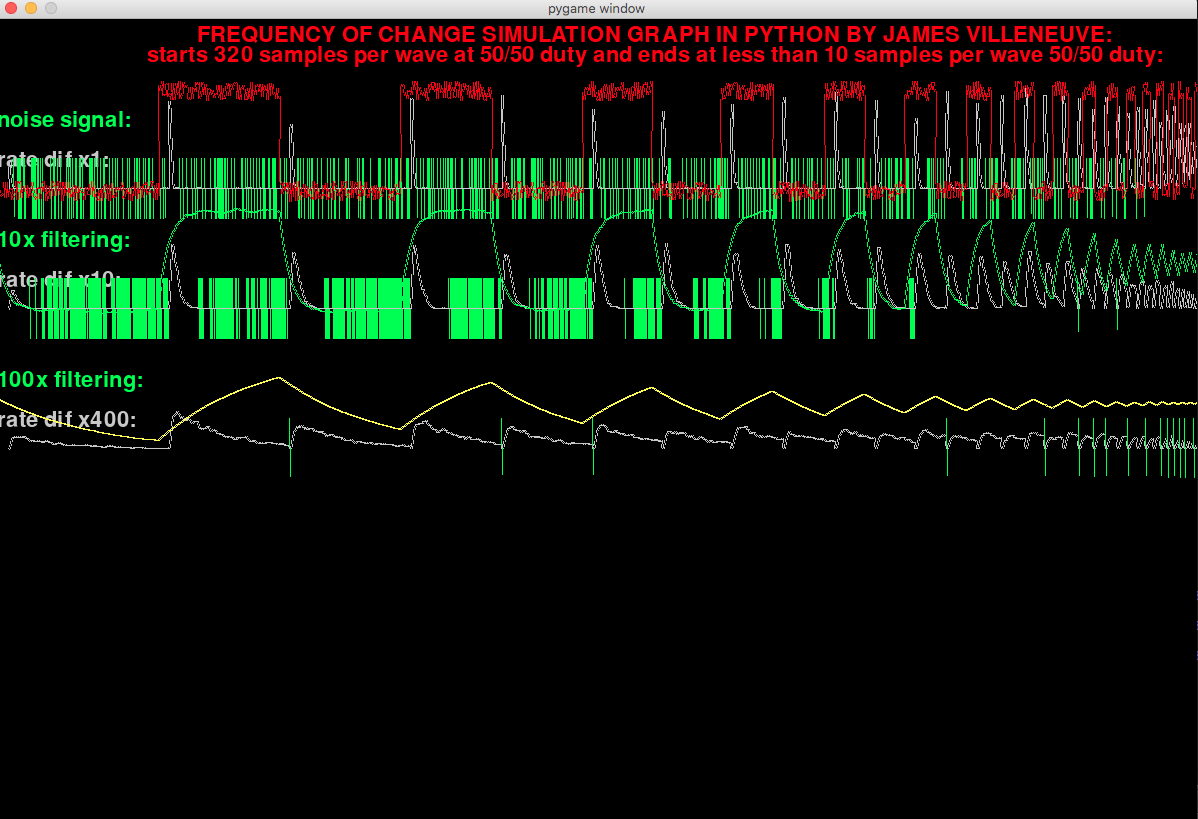
the green line slashes are areas that the...
Read more »

 will.sweatman
 MS-BOSS