Close
0%
0%

Rodriguez - The World's Slowest IV Tracer

A simple semiconductor current/voltage trace plotter. It requires only an Arduino and a handful of passive components.

Similar projects worth following
This IV tracer started as a simple one off for a specific purpose, and sort of mushroomed.
From a simple circuit and software to plot the current and voltage curve of a single diode junction, it has grown into a functional (if limited) current and voltage tracer that can be used to design small transistor amplifiers.

Rodriguez started as a nameless project I used to make a point in an online discussion about the shape of the current/voltage plot of the base/emitter junction of an NPN transistor.

I started it on a Saturday evening and needed it done quickly, so I could only use the parts I had at hand.  That's a pile of passive components, and an Arduino Nano.

The initial version was intended to investigate this circuit:
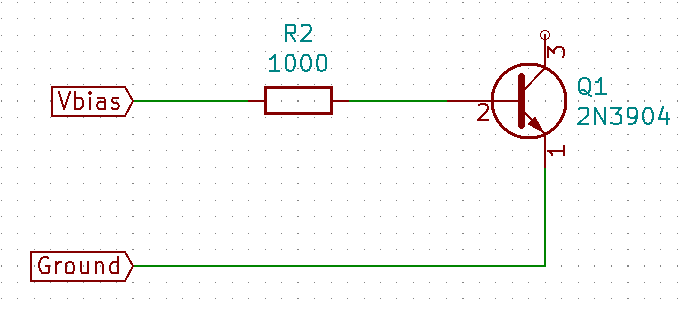
The idea was to plot Vbias against the base current.

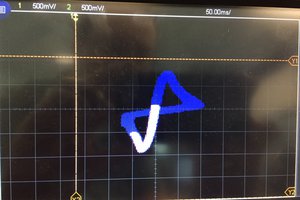
This is the result:

Once I had that working, I realized that I had solved all of the problems involved in making a current/voltage tracer for transistors.

Current/voltage traces are used in designing transistor amplifiers using the load line method of design.

A current/voltage plot of a typical transistor looks like this:

enter image description here

(Note:  That's from an earlier version of Rodriguez.  The base current display still had some bugs.)

A current/voltage tracer consists of a couple of current sources and some voltmeters.

Arduinos have some low resolution analog to digital converters, and PWM outputs that can be used to generate analog voltages and currents.

Here's the circuit I built for Rodriguez using just a few passive components and an Arduino:
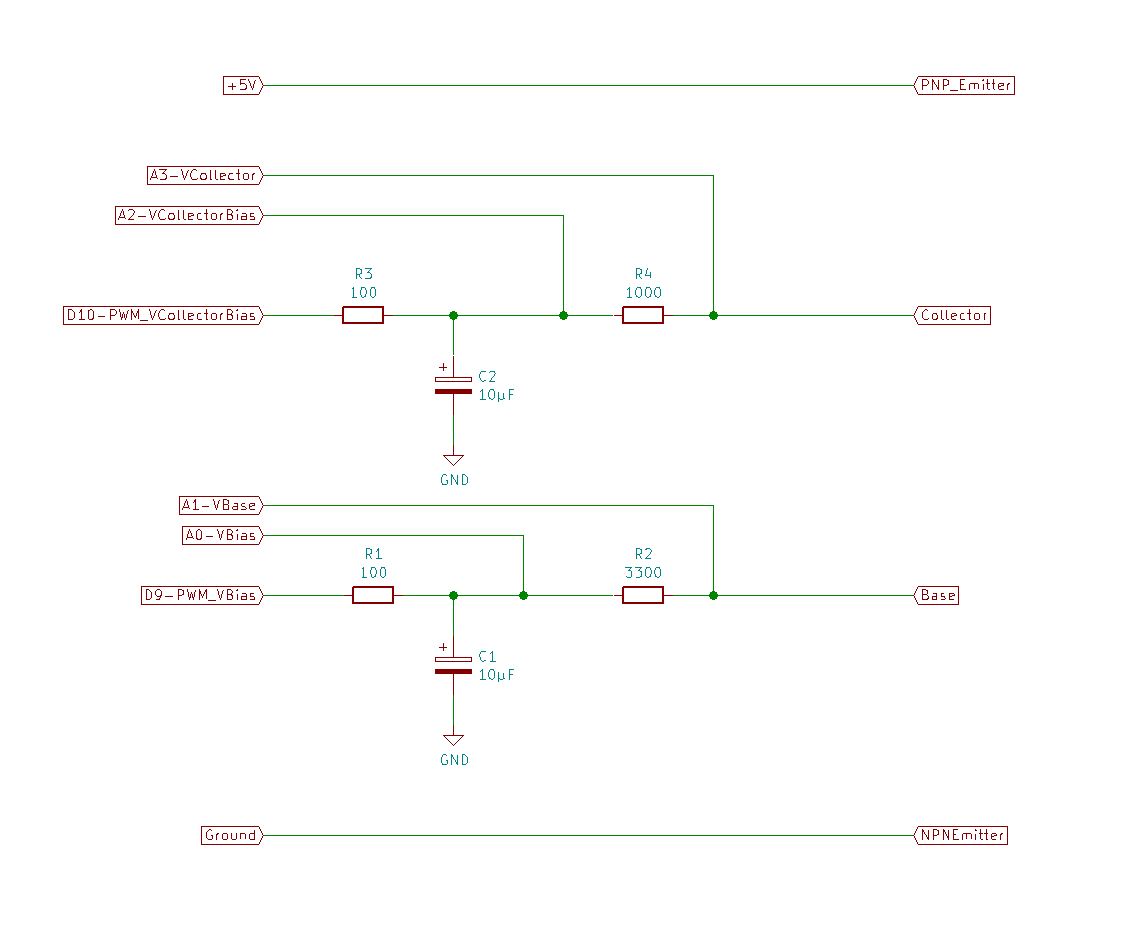
The standard Arduino PWM outputs are rather coarse.  They have only 256 steps, and the standard PWM frequency is rather low.

The analog to digital converters are only capable of 10 bits of resolution.

Neither the PWM outputs nor the ADC inputs are up to the job of generating microamperes or measuring millivolts - unless you get clever.


Rodriguez uses a couple of tricks to get usable results out of its very crude hardware.

To get better resolution on the signals generated by the PWM outputs, it uses the Timer1 library.  The Timer1 library allows a (pretty much) free choice of the PWM frequency and 10 bits of resolution for the pulse width (that's 1024 steps.)  With a PWM frequency of 10kHz, Rodriguez can get by with a very simple low pass filter to make the analog signals.  With 1024 steps, the plots are smoother than they would be with just 256 steps.

Rodriguez makes use of oversampling to get the equivalent of 14 bits of resolution out of the 10 bit ADCs.  For the really fine measurements of the base current, it goes further and oversamples the oversampling.  It oversamples by 256 for most measurements.  The base current measurements are oversampled 256 times the regular oversampling.


The oversampling gets Rodriguez enough resolution to be useful, but also makes the program very slow.

A trace using 5 base current levels will take several minutes to complete.

Rodriguez's main "claim to fame" is the simplicity of the circuit.

All you need is two capacitors, 5 resistors, and an Arduino of any flavor.

It can be assembled by anyone using whatever is at hand.

I built mine as a sort of 3D sculpture on the pin header of the Nano.  It could just as easily be assembled on a solderless breadboard.  Perfboard would work as well.  An etched PCB would be rather overkill, but whatever floats your boat.

The software is in a github repository, which also includes a schematic of the required circuit.

I used Qt and Python on the PC side.  The Arduino program is also in the repository.

For now, Rodriguez can make current/voltage plots of bipolar junction transistors and diodes. I've used it on 2N3904, 2N3906, and 2N2222 transistors.  I've used it on LEDs of various colors, as well as regular diodes (1N4148, 1N4001.)

This is the lV trace with load line markings that I used to design a simple single transistor amplifier:
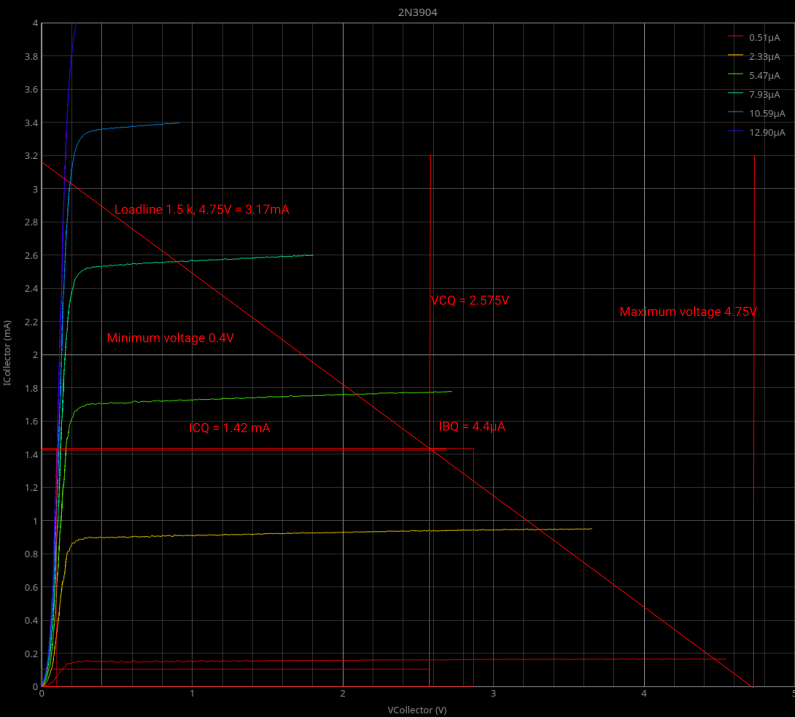
Rodriguez plotted the current and voltage repsonse of the 2N3904 transistor, and I used Inkscape to draw the load line and determine the bias current for the base.

I even went so far as to order some tunnel diodes just to see what would happen.  It turns out that Rodriguez can't plot the negative resistance range of the...

Read more »

  • 1 × Arduino
  • 2 × 100 ohm resistors
  • 2 × 10 µF capacitors
  • 1 × 1k resistor
  • 1 × 3.3k resistor

View all 6 components

  • Expanded the Rodriguez wiki

    Joseph Eoff06/03/2021 at 16:12 0 comments

    After putting up a Rodriguez binary last week, I find that I have people actually trying to use Rodriguez.

    Rodriguez is intended for beginners, and it seems that they like breadboards but don't quite know how to wire them.

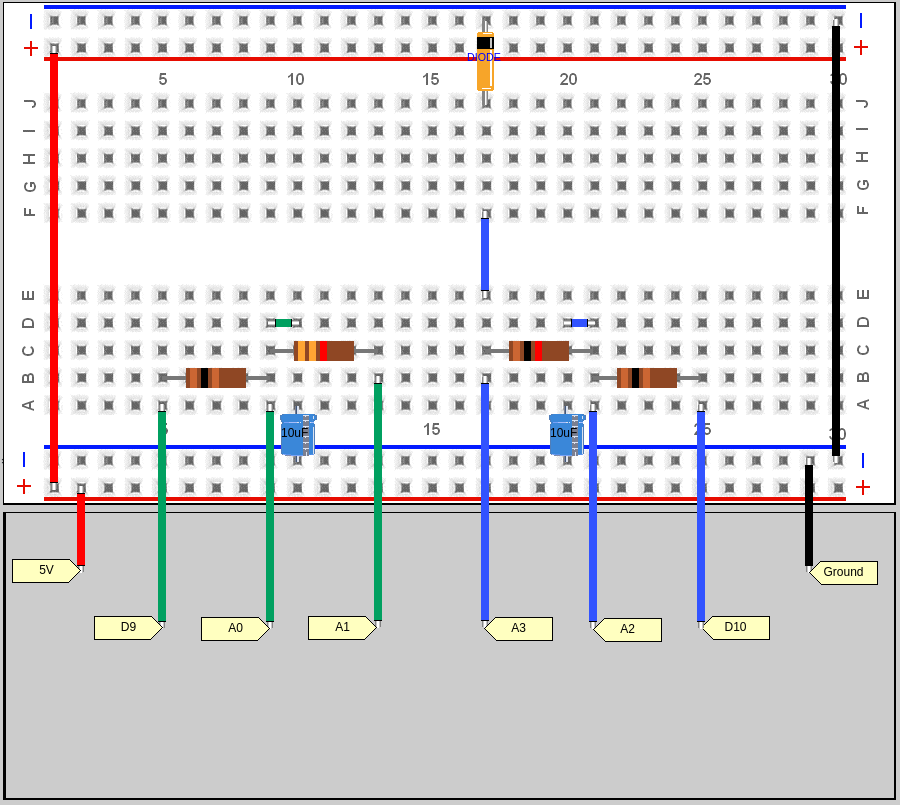
    I've extended the Rodriguez wiki with wiring diagrams to be used with a breadboard, and I've added some instructions on using Rodriguez.

    I used PEBBLE to make the wiring diagrams.

    Here's an example of connection an Arduino to do diode traces:


  • Binary release of Rodriguez

    Joseph Eoff05/27/2021 at 19:13 0 comments

    As I did with my D43 oscilloscope camera software, I have setup the Rodriguez GitHub repository to build binary releases to make the software more accessible.

    No longer do you have to install Python and all of Rodriguez's dependencies by following the Rodriguez wiki.

    Just download the correct file for your operating system and start the downloaded program.

    Download files:

    • Rodriguez (Linux)
    • Rodriguez.exe (Windows)
    • Rodriguez.zip (macOS)

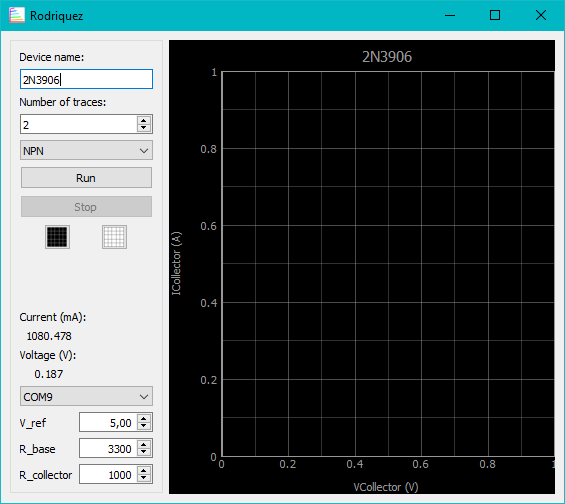
    Here's the Rodriguez binary running on Windows:


    It looks pretty much just like it does under Linux.  That's kind of the point of cross platform development with Qt.

    If you have a way to test it on macOS, drop me a line here or in the comments of the blog and let me know how it turns out.

    Linux users need to make sure that their system uses GLIBC version 2.27 or higher.

    I've tested the Windows version on Windows 10.  It ought to work on other versions, but it is untested.


  • A home for Rodriguez

    Joseph Eoff02/20/2021 at 20:45 0 comments

    Despite its beginning as a temporary lash up, Rodriguez appears to be here to stay.

    In honor of its new found permanency, I've given Rodriguez a permanent home.  No longer will it have to fear for its wiring.

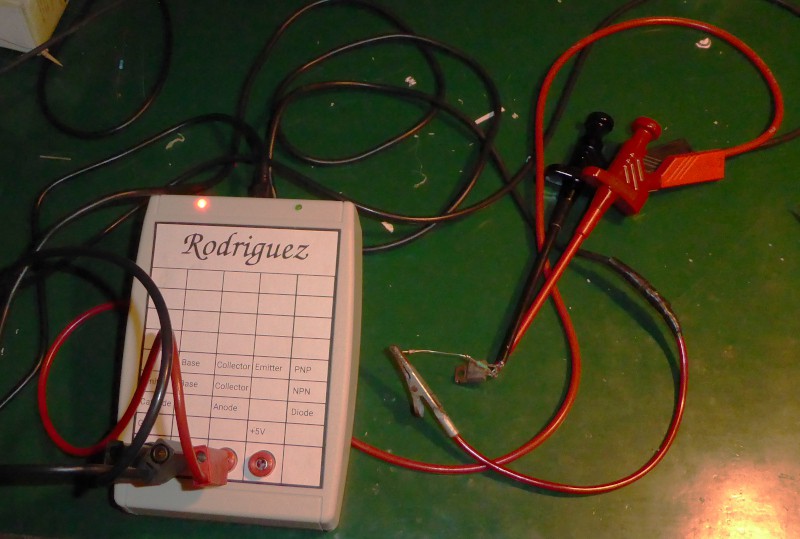
    That's Rodriguez doing its thing with a 2N6288 NPN transistor.

    The chart on the front is to remind me what each lead does.  I'll expand it when I add the FET trace functions.

View all 3 project logs

  • 1
    Get the software
    1. Download the Rodriguez files from the Rodriguez repository.
    2. Load the Rodriguez.ino file in the Arduino IDE and flash it to your Arduino.
    3. Install Python and the required libraries following the instructions in the Rodriguez wiki.
    4. Alternatively, download a Rodriquez binary from the Rodriguez release page. For Linux, download "Rodriguez." For Windows, download "Rodriguez.exe." For macOS, download "Rodriguez.zip."
  • 2
    Assemble the circuit
    Assemble the following circuit and connect it to your Arduino.
    The flags on the left start with the name of the pin to connect to on the Arduino.
    The flags on the right connect to the transistor or diode you are testing.
    Between the flag marked "Base" and the base of the transistor, you will need to insert a fairly large value resistor.  Depending on the gain of the transistor, you may need up to 200k of additional resistance.
  • 3
    Run a trace

    1. Connect the Arduino to the PC

    2. Start the Rodriguez program

    3. Select the serial port of your Arduino (lower left corner of the Rodriguez window.)

    4. Set the correct values for R_base (R2 from the diagram) and R_collector (R1 from the diagram) resistors in the Rodriguez window.  Do NOT enter the value of the additional base series resistor.

    5. Measure the 5V output from the Arduino, and enter that value in the V_ref field.

    6. Connect the transistor according to the diagram.  Diodes are tested between ground (NPN emitter) and collector.

    7. Enter the name or model number of the part in the "Device Name" field.

    8. Select the type of trace you want (NPN, PNP, diode)

    9. For transistors, select the number of base current steps you want plotted.

    10.  Click "Run"

    11. Take a coffee break while Rodriguez does its thing

View all 4 instructions

Enjoy this project?

Share

Discussions

Similar Projects

Does this project spark your interest?

Become a member to follow this project and never miss any updates