-
Test Waveforms
05/12/2021 at 17:56 • 3 commentsTime has come to poke at the display and see what color comes out. The simplest test that we can do, is to apply a constant voltage for an x amount of frames.
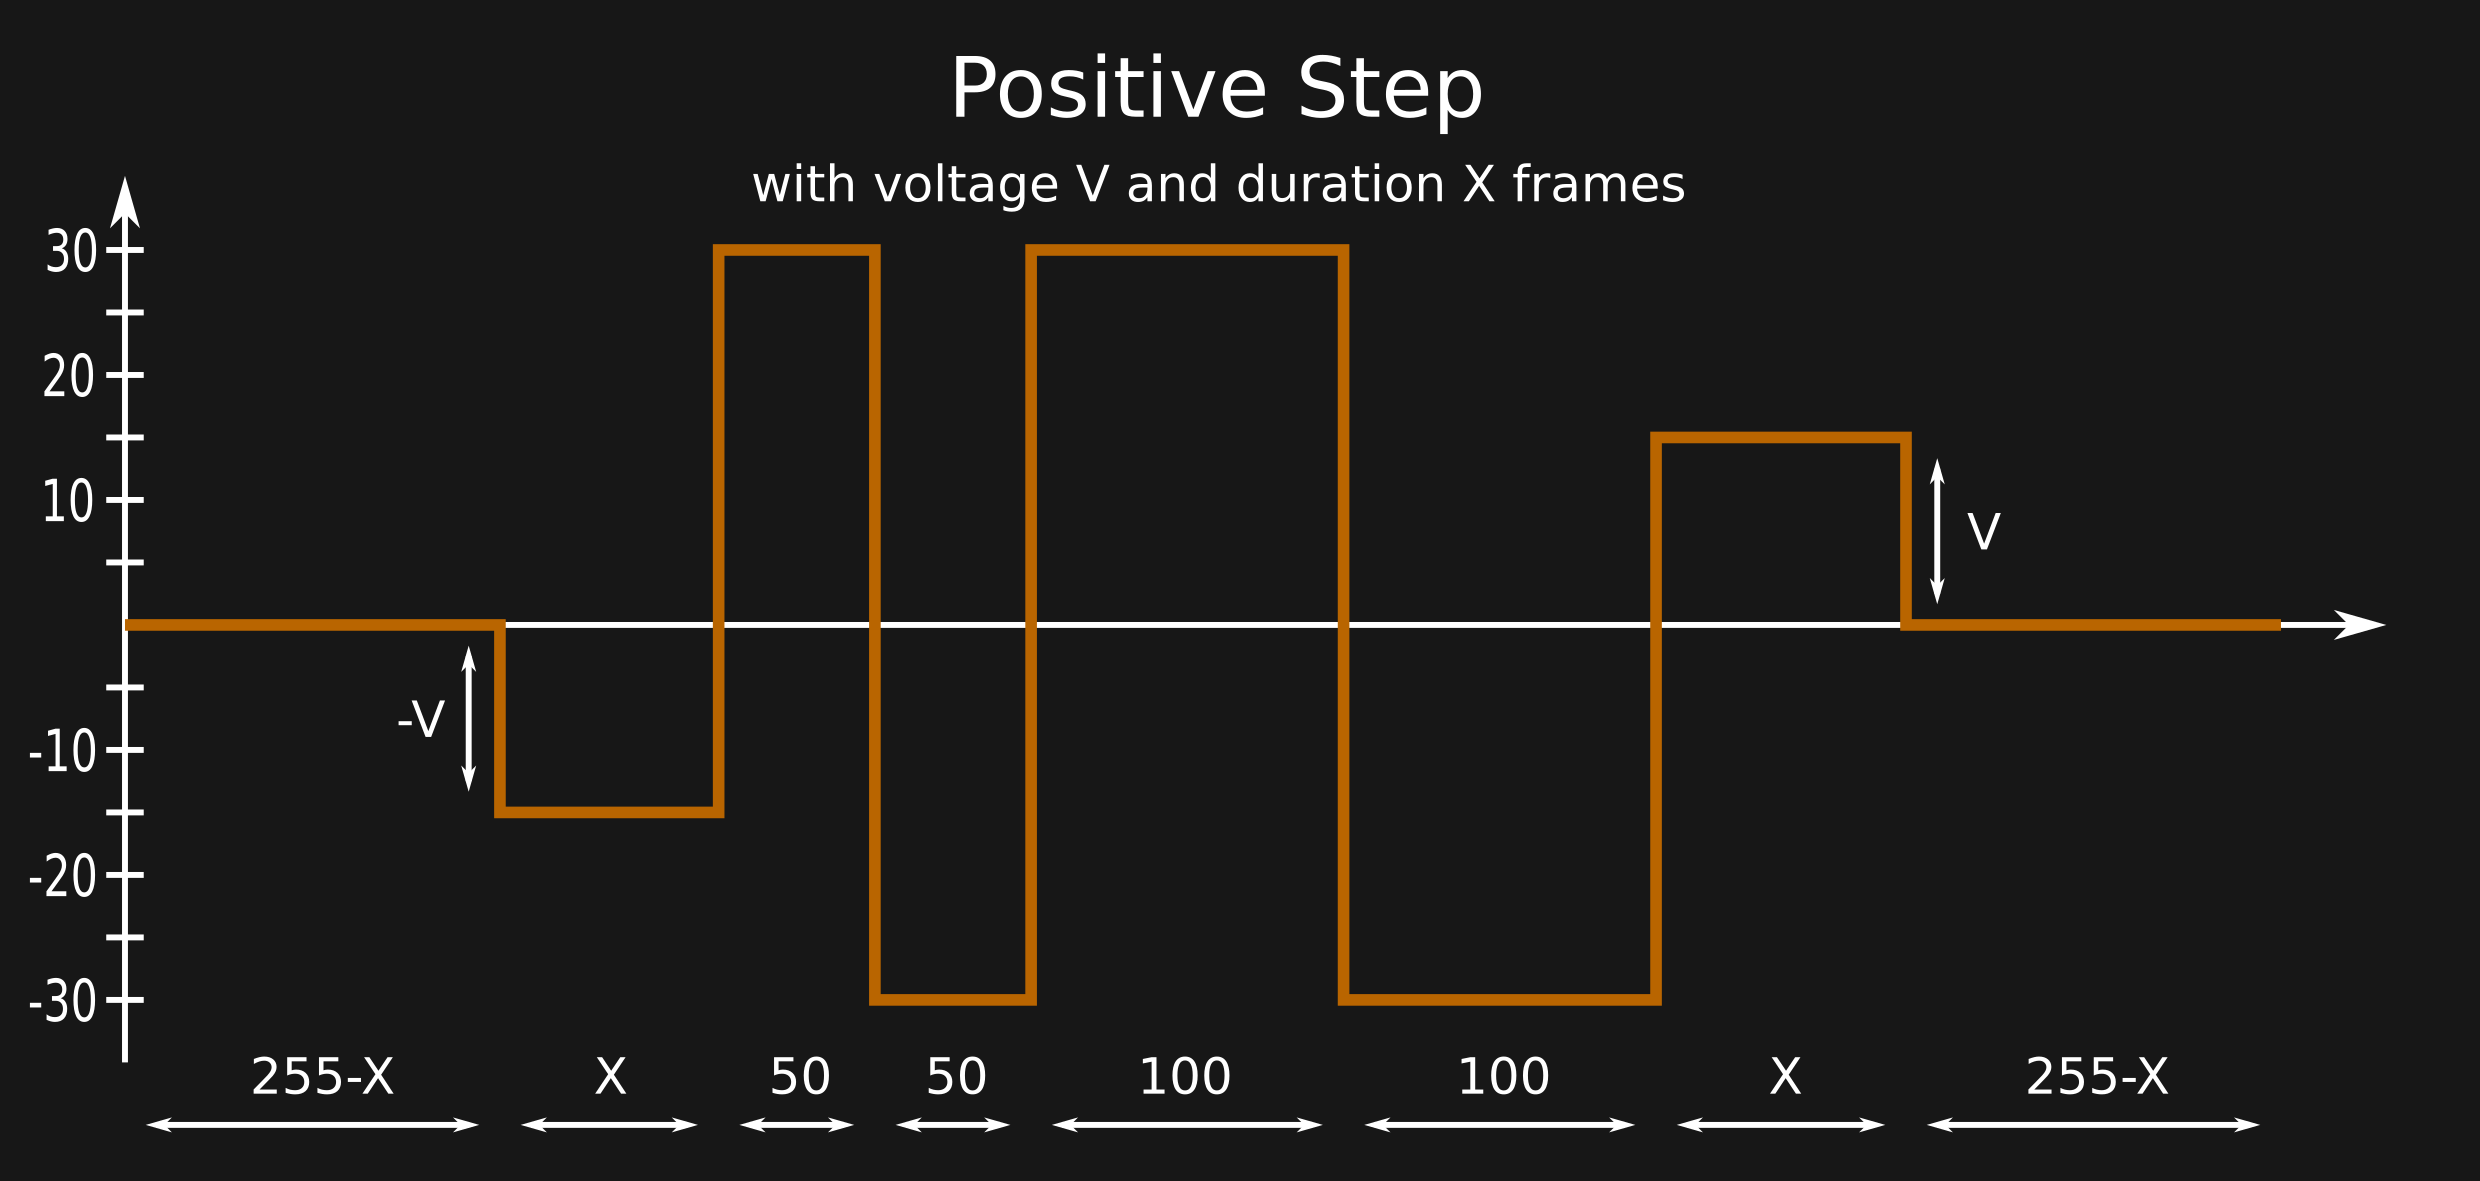
The controller can apply 9 different voltages (-30V -25V -15V -5V 0V +5V +15V +25V +30V). We already know that 0V doesn't do anything, so we can focus on the other values. I made two sets of waveforms one positive and one negative.Starting with the positive one. The picture below shows the waveform. It is made up of 3 phases. The first one is to prevent any DC buildup in the panel. The second serves to drive the particles ard towards the top and bottom layers, leaving the display in the extreme optical state. The last phase applies the target voltage for the desired number of frames.
![]()
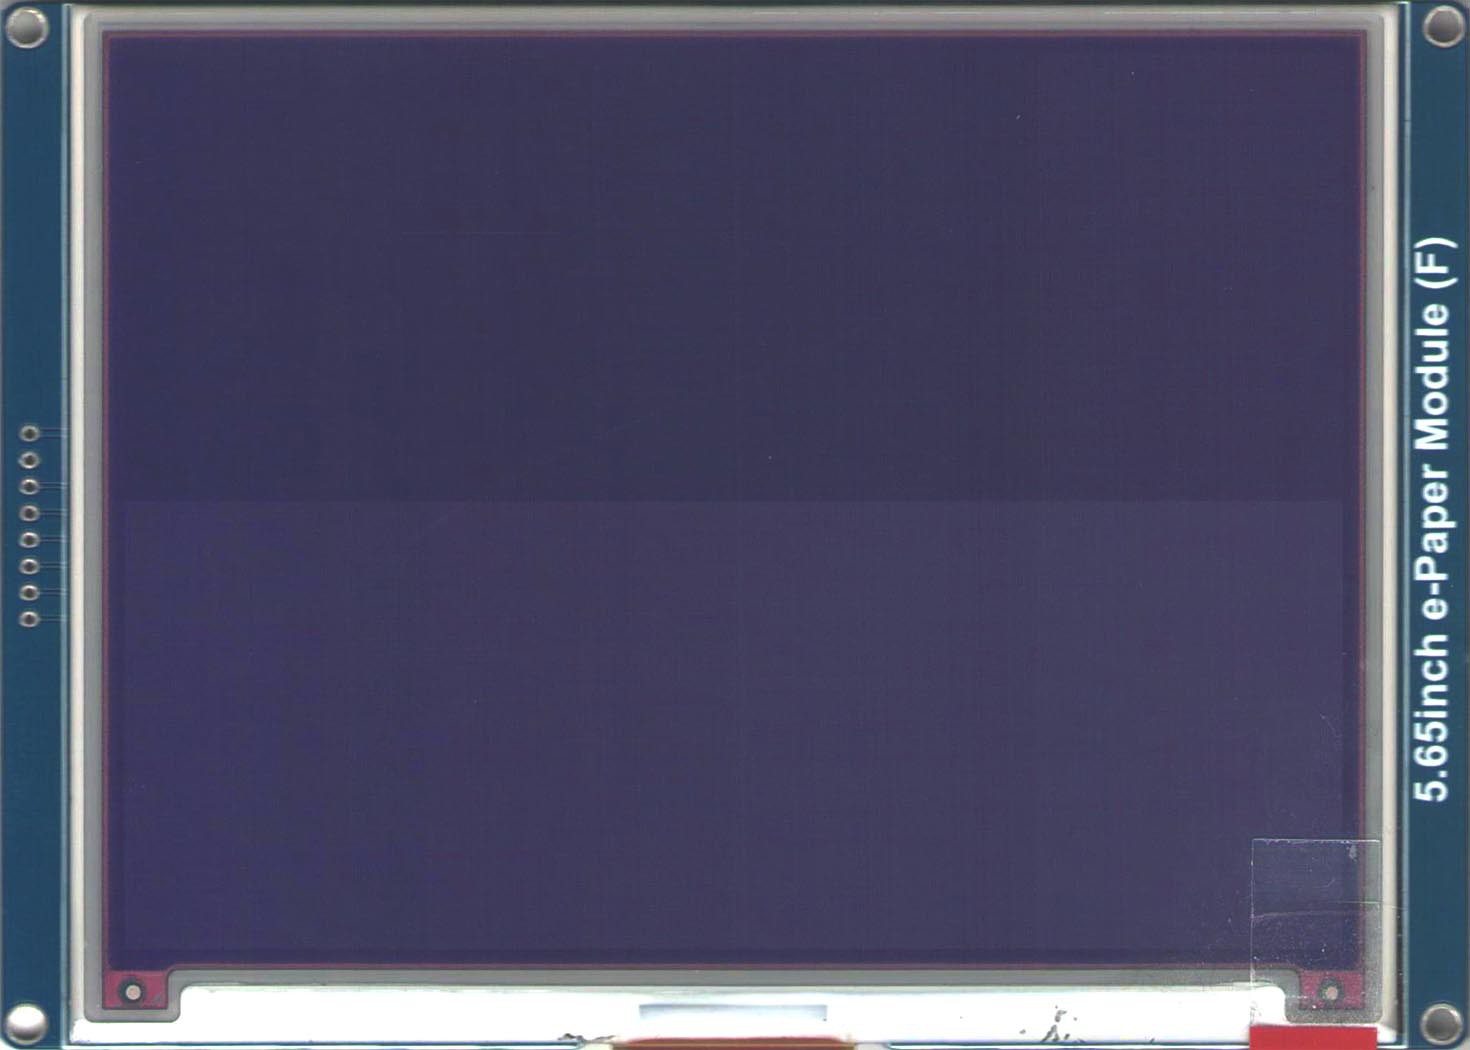
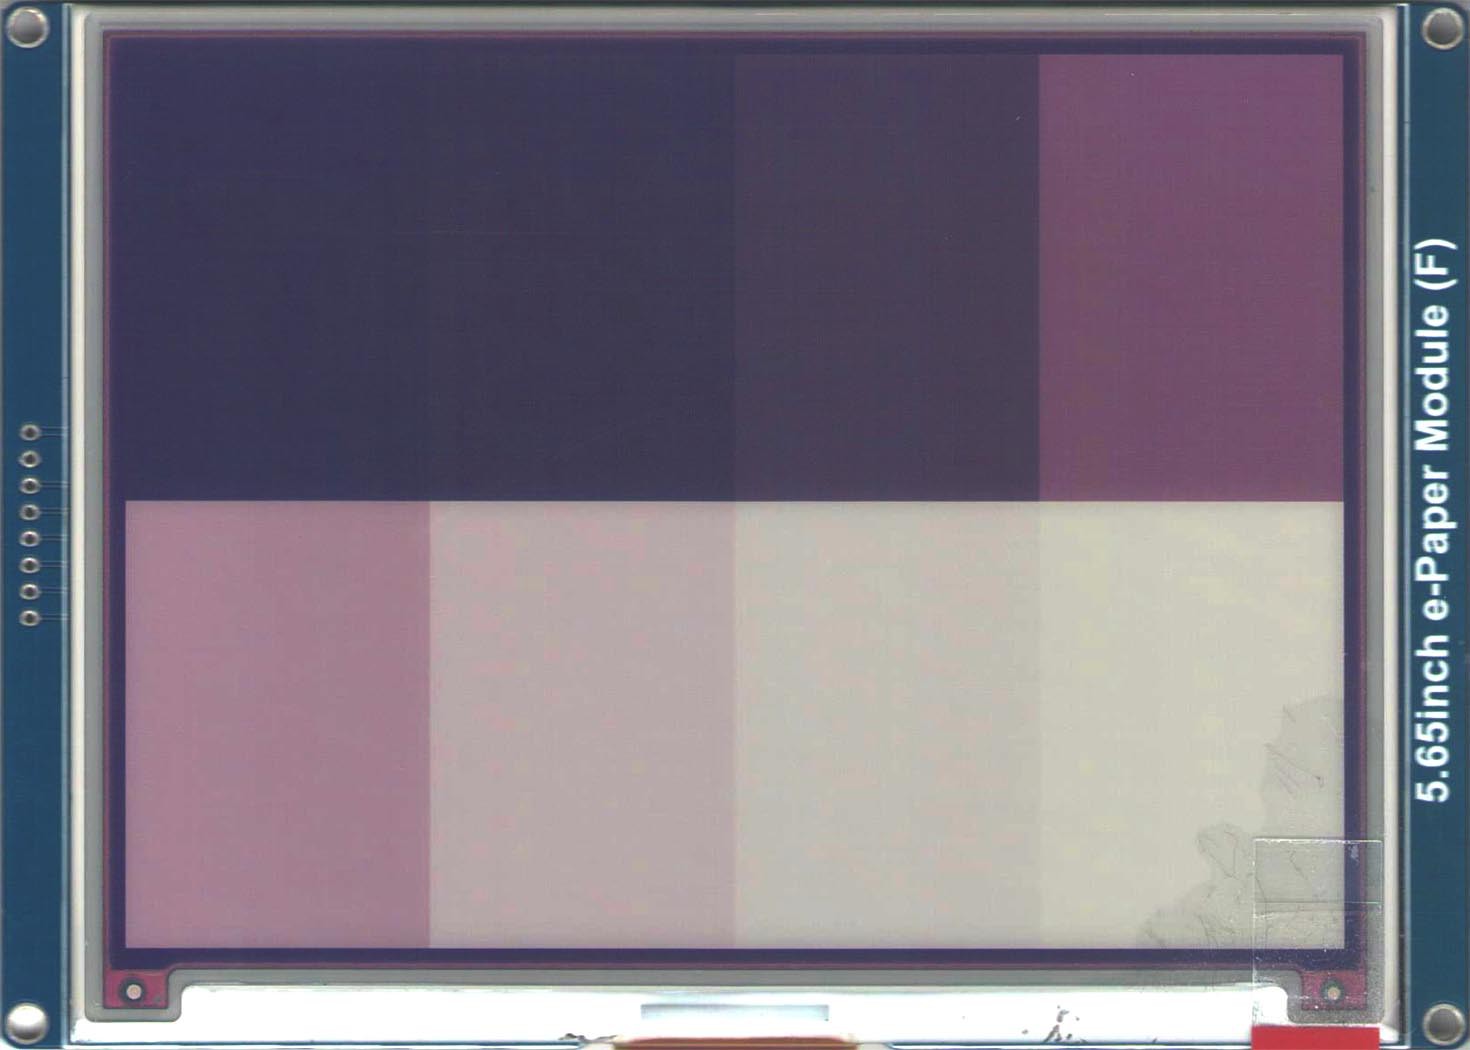
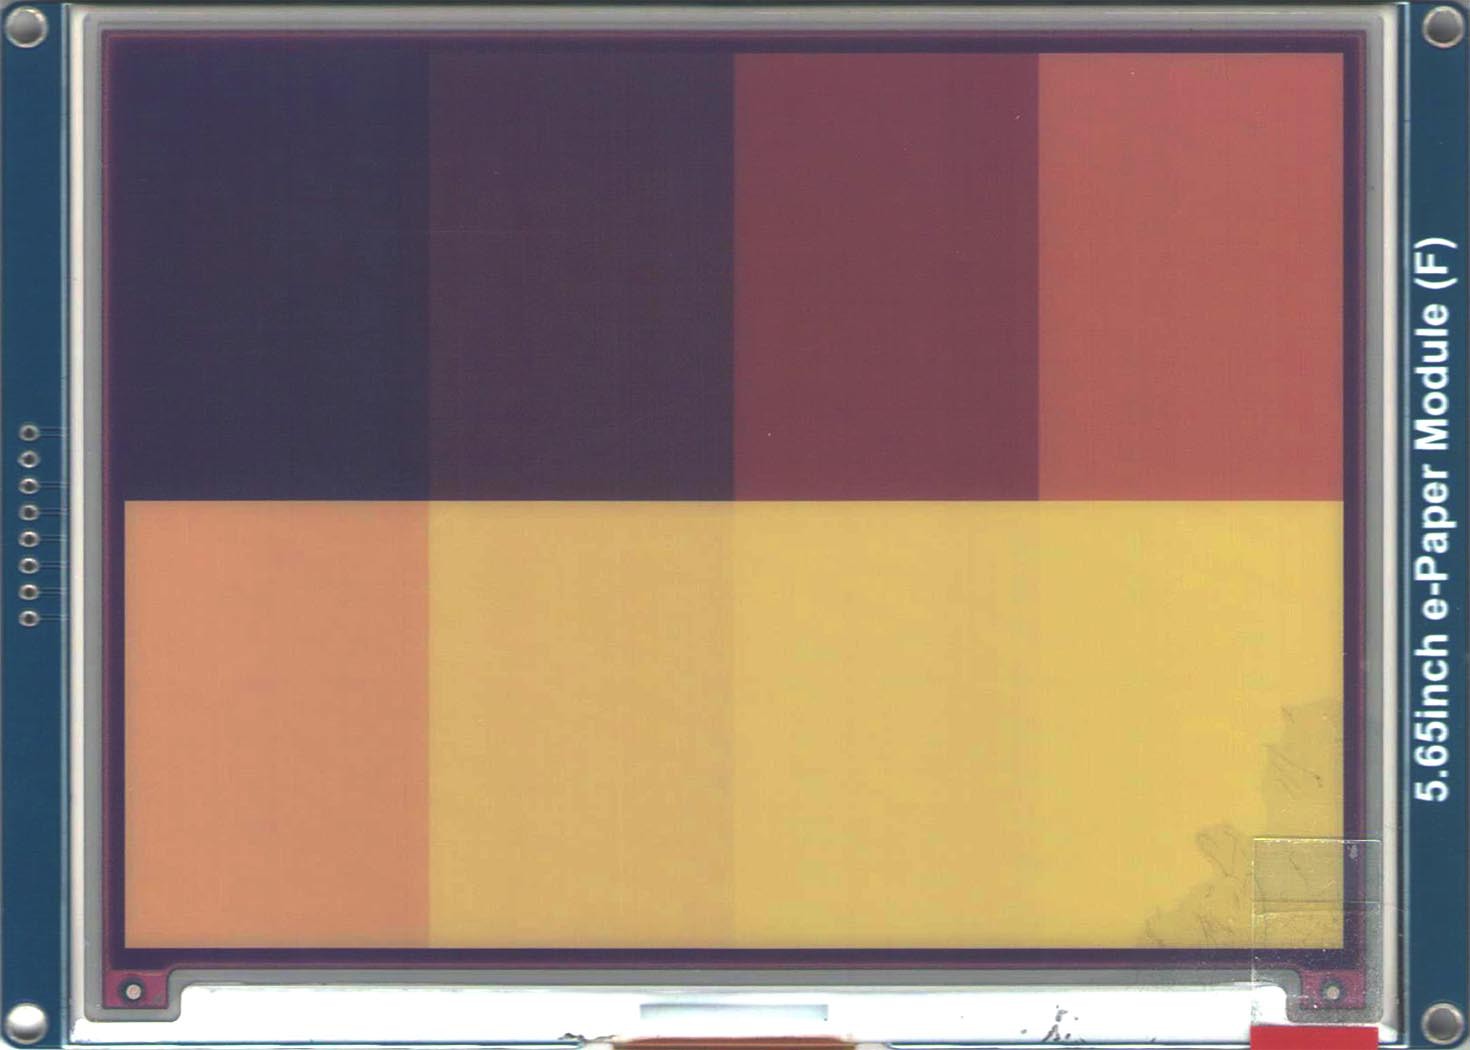
Below are the results of the experiments. For each experiment, starting from the top left and ending at the bottom right, the voltage is applied for 2, 4, 8, 16, 32, 64, 128, 255 frames.
Testing is done at 21°C, framerate is 50Hz.
![Positive 5V Step Positive 5V Step]()
Positive 5V step ![Positive 15V step Positive 15V step]()
Positive 15V step ![Positive 25V step Positive 25V step]()
Positive 25V step ![Positive 30V step Positive 30V step]()
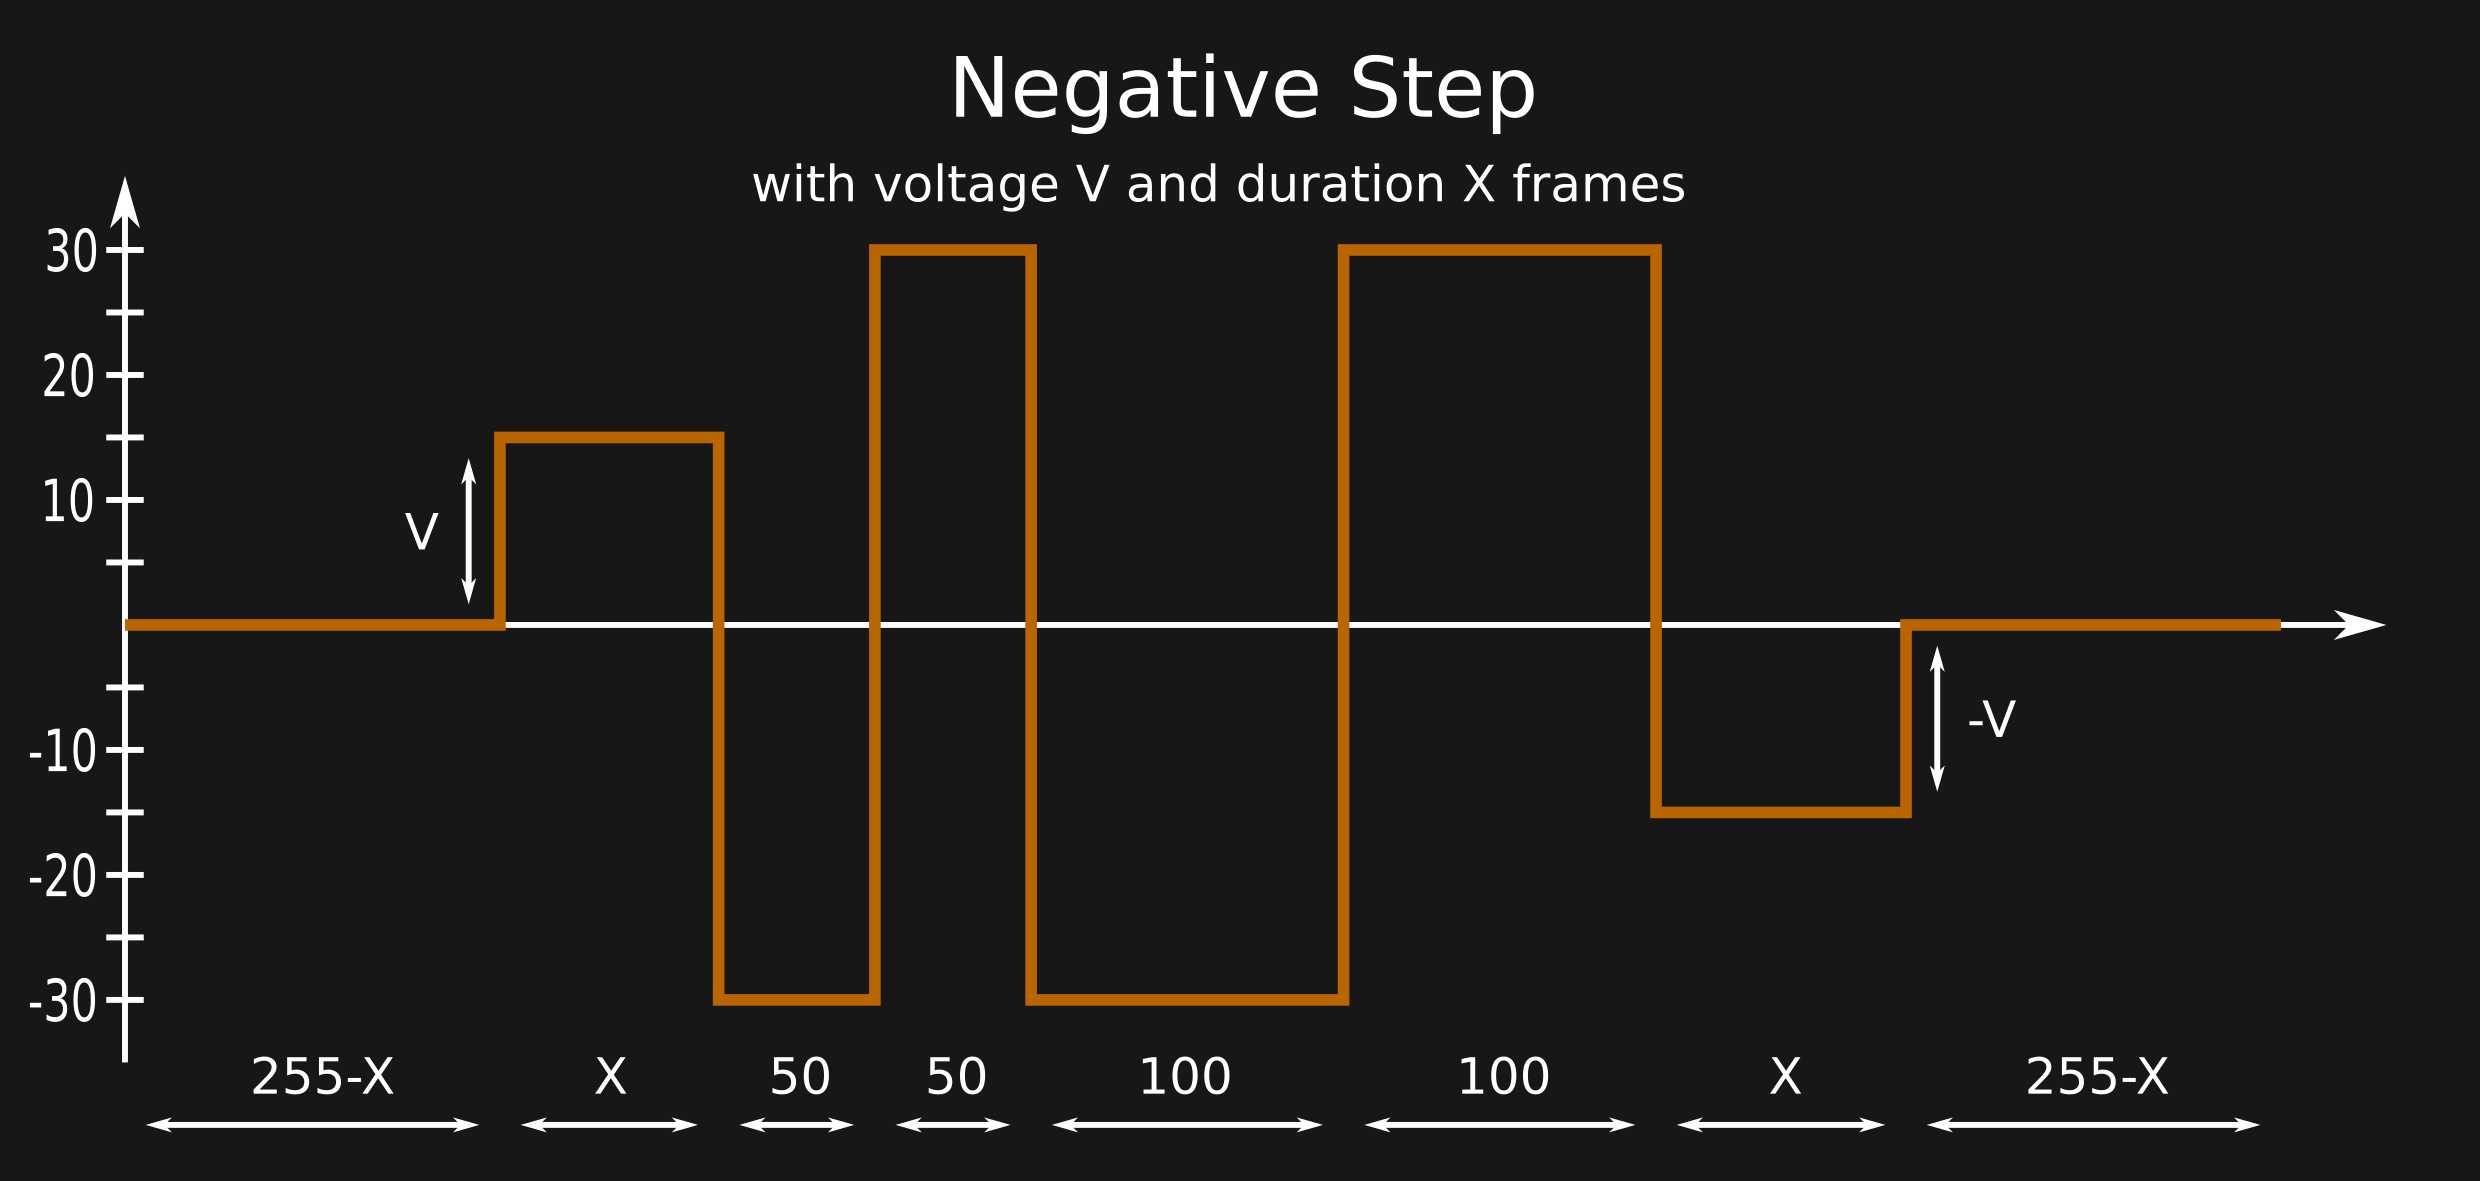
Positive 30V step The negative waveform is the same as above, with all the polarities reversed. It is made up of the same 3 phases. The first one is to prevent any DC buildup in the panel. The second serves to drive the particles ard towards the top and bottom layers, leaving the display in the extreme optical state. The last phase applies the target voltage for the desired number of frames.
![]()
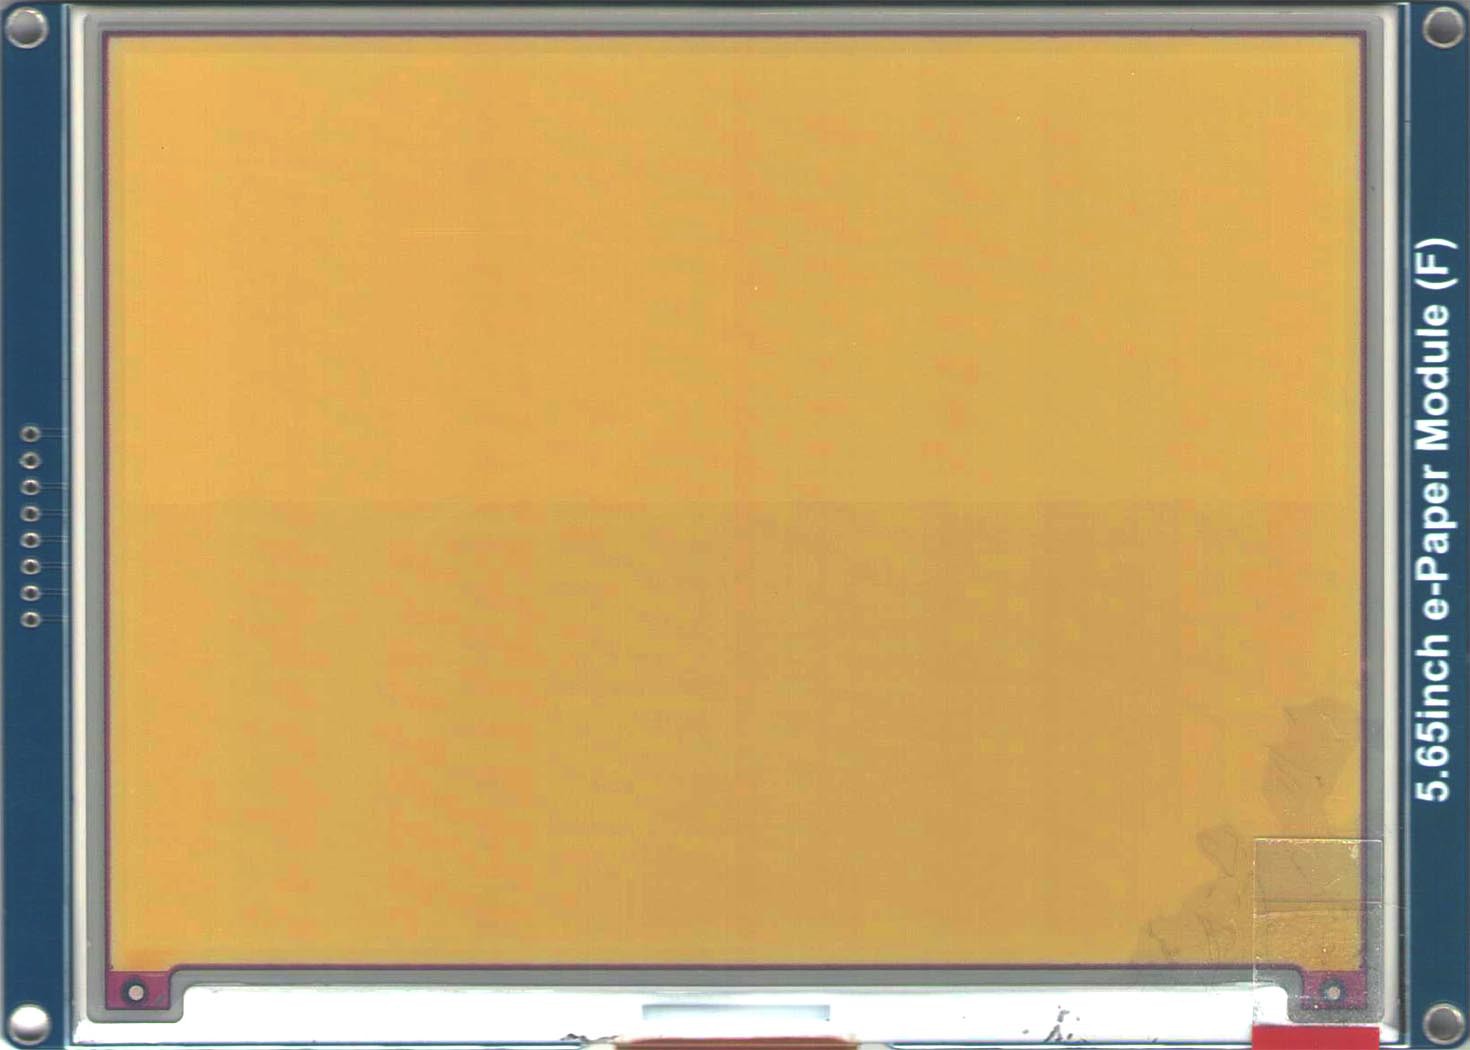
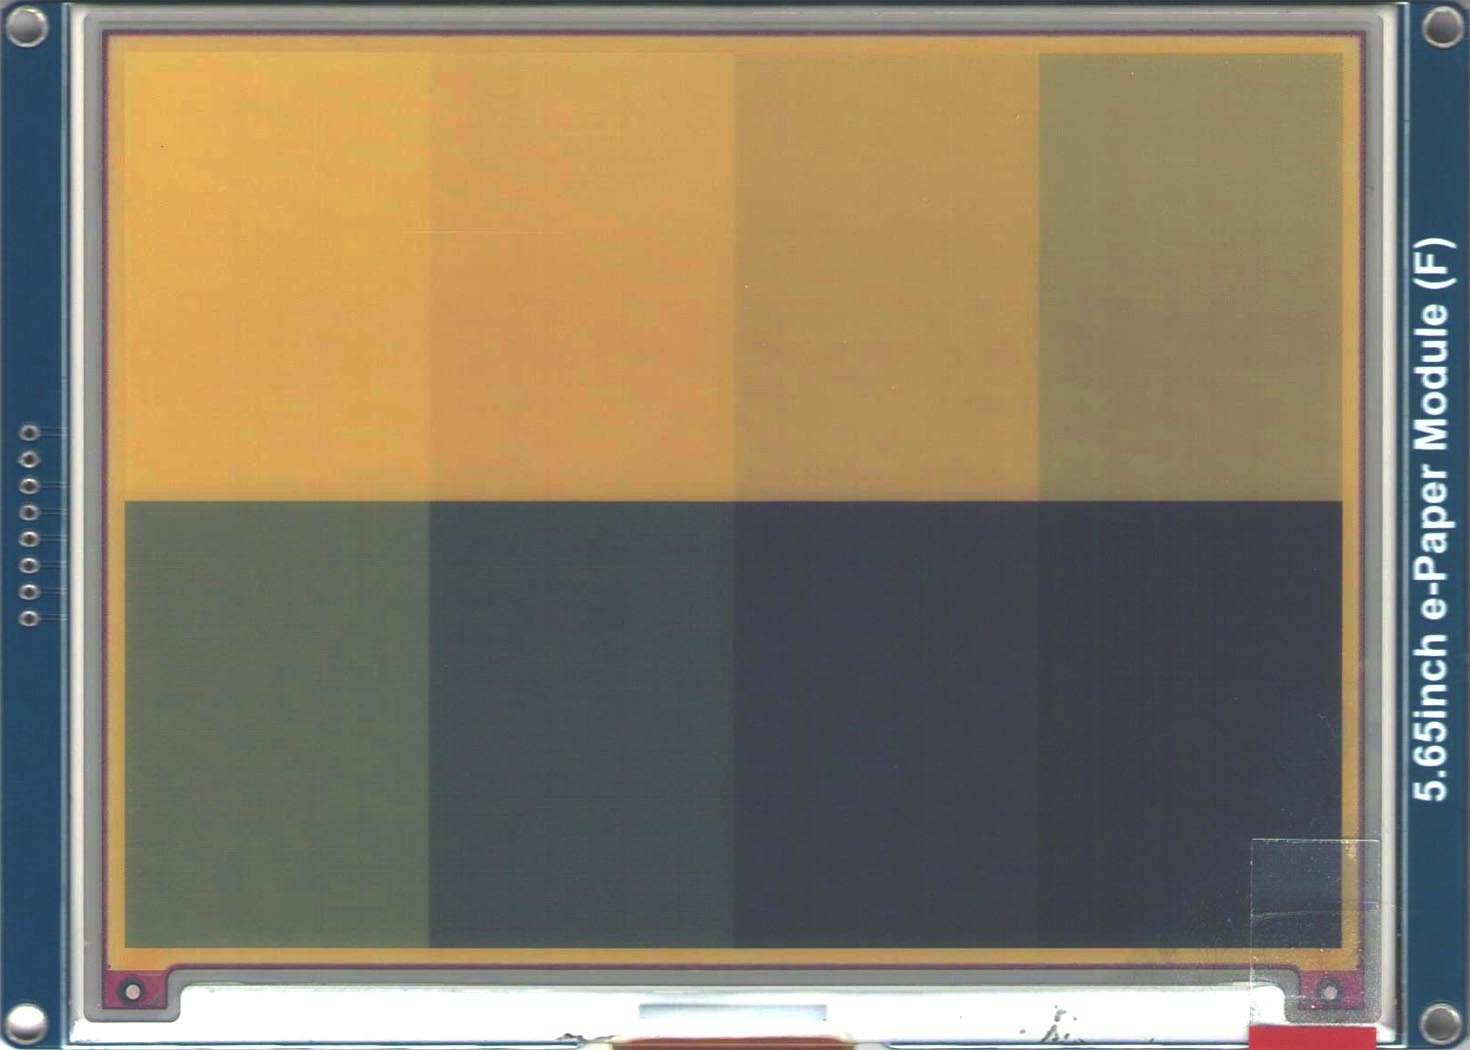
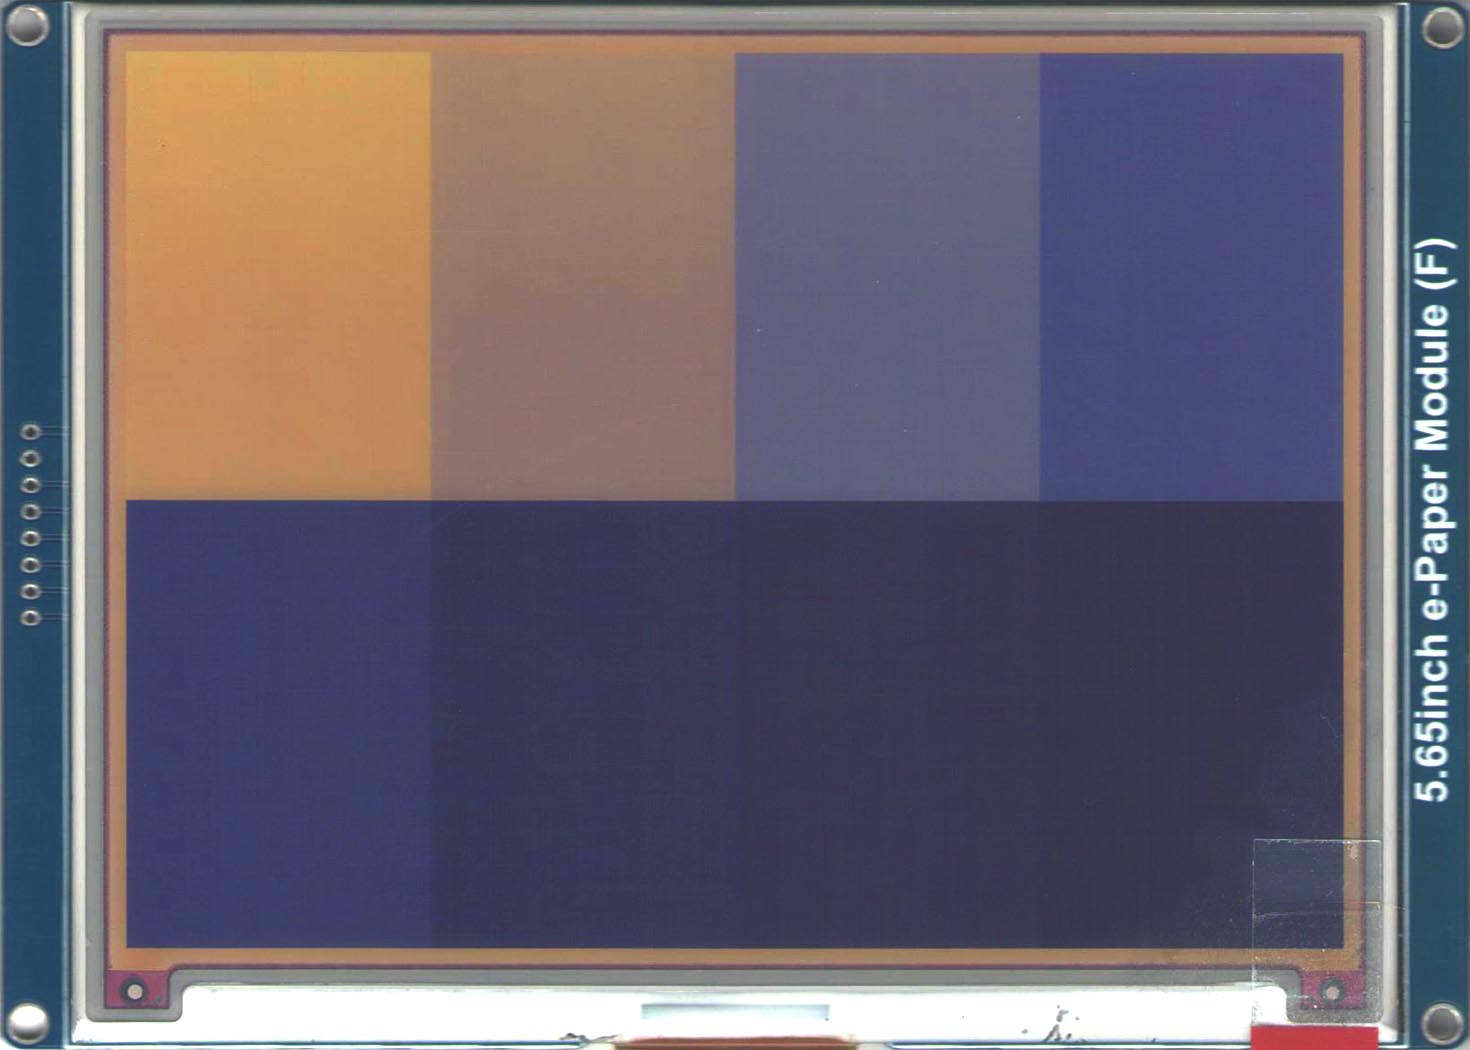
Below are the results of the experiments. For each experiment, starting from the top left and ending at the bottom right, the voltage is applied for 2, 4, 8, 16, 32, 64, 128, 255 frames.
Testing is done at 21°C, framerate is 50Hz.
![Negative 5V step Negative 5V step]()
Negative 5V step ![Negative 15V step Negative 15V step]()
Negative 15V step ![Negative 25V step Negative 25V step]()
Negative 25V step ![Negative 30V step Negative 30V step]()
Negative 30V step Conclusions
What can we derive from the positive step?
- There isn't much change at 5V.
- We can clearly see that white and yellow particles are negatively charged.
- The yellow ones are faster than the white ones, but only if the applied voltage is at least 25V.
- White particles are quite slow, at 25V they take 255 frames to reach the top.
- Cyan seems to be faster than magenta, at 15V the initial dark blu color becomes pink before fading to white.
What can we derive from the positive step?
- At 15V yellow fades to green, which indicates that cyan rises faster than magenta.
- At 25V and 30V yellow goes away quickly, leaving cyan.
What do you see? leave a comment below.
-
Extracting Factory LUTs
05/02/2021 at 07:15 • 1 commentExtracting LUTs from embedded FLASH
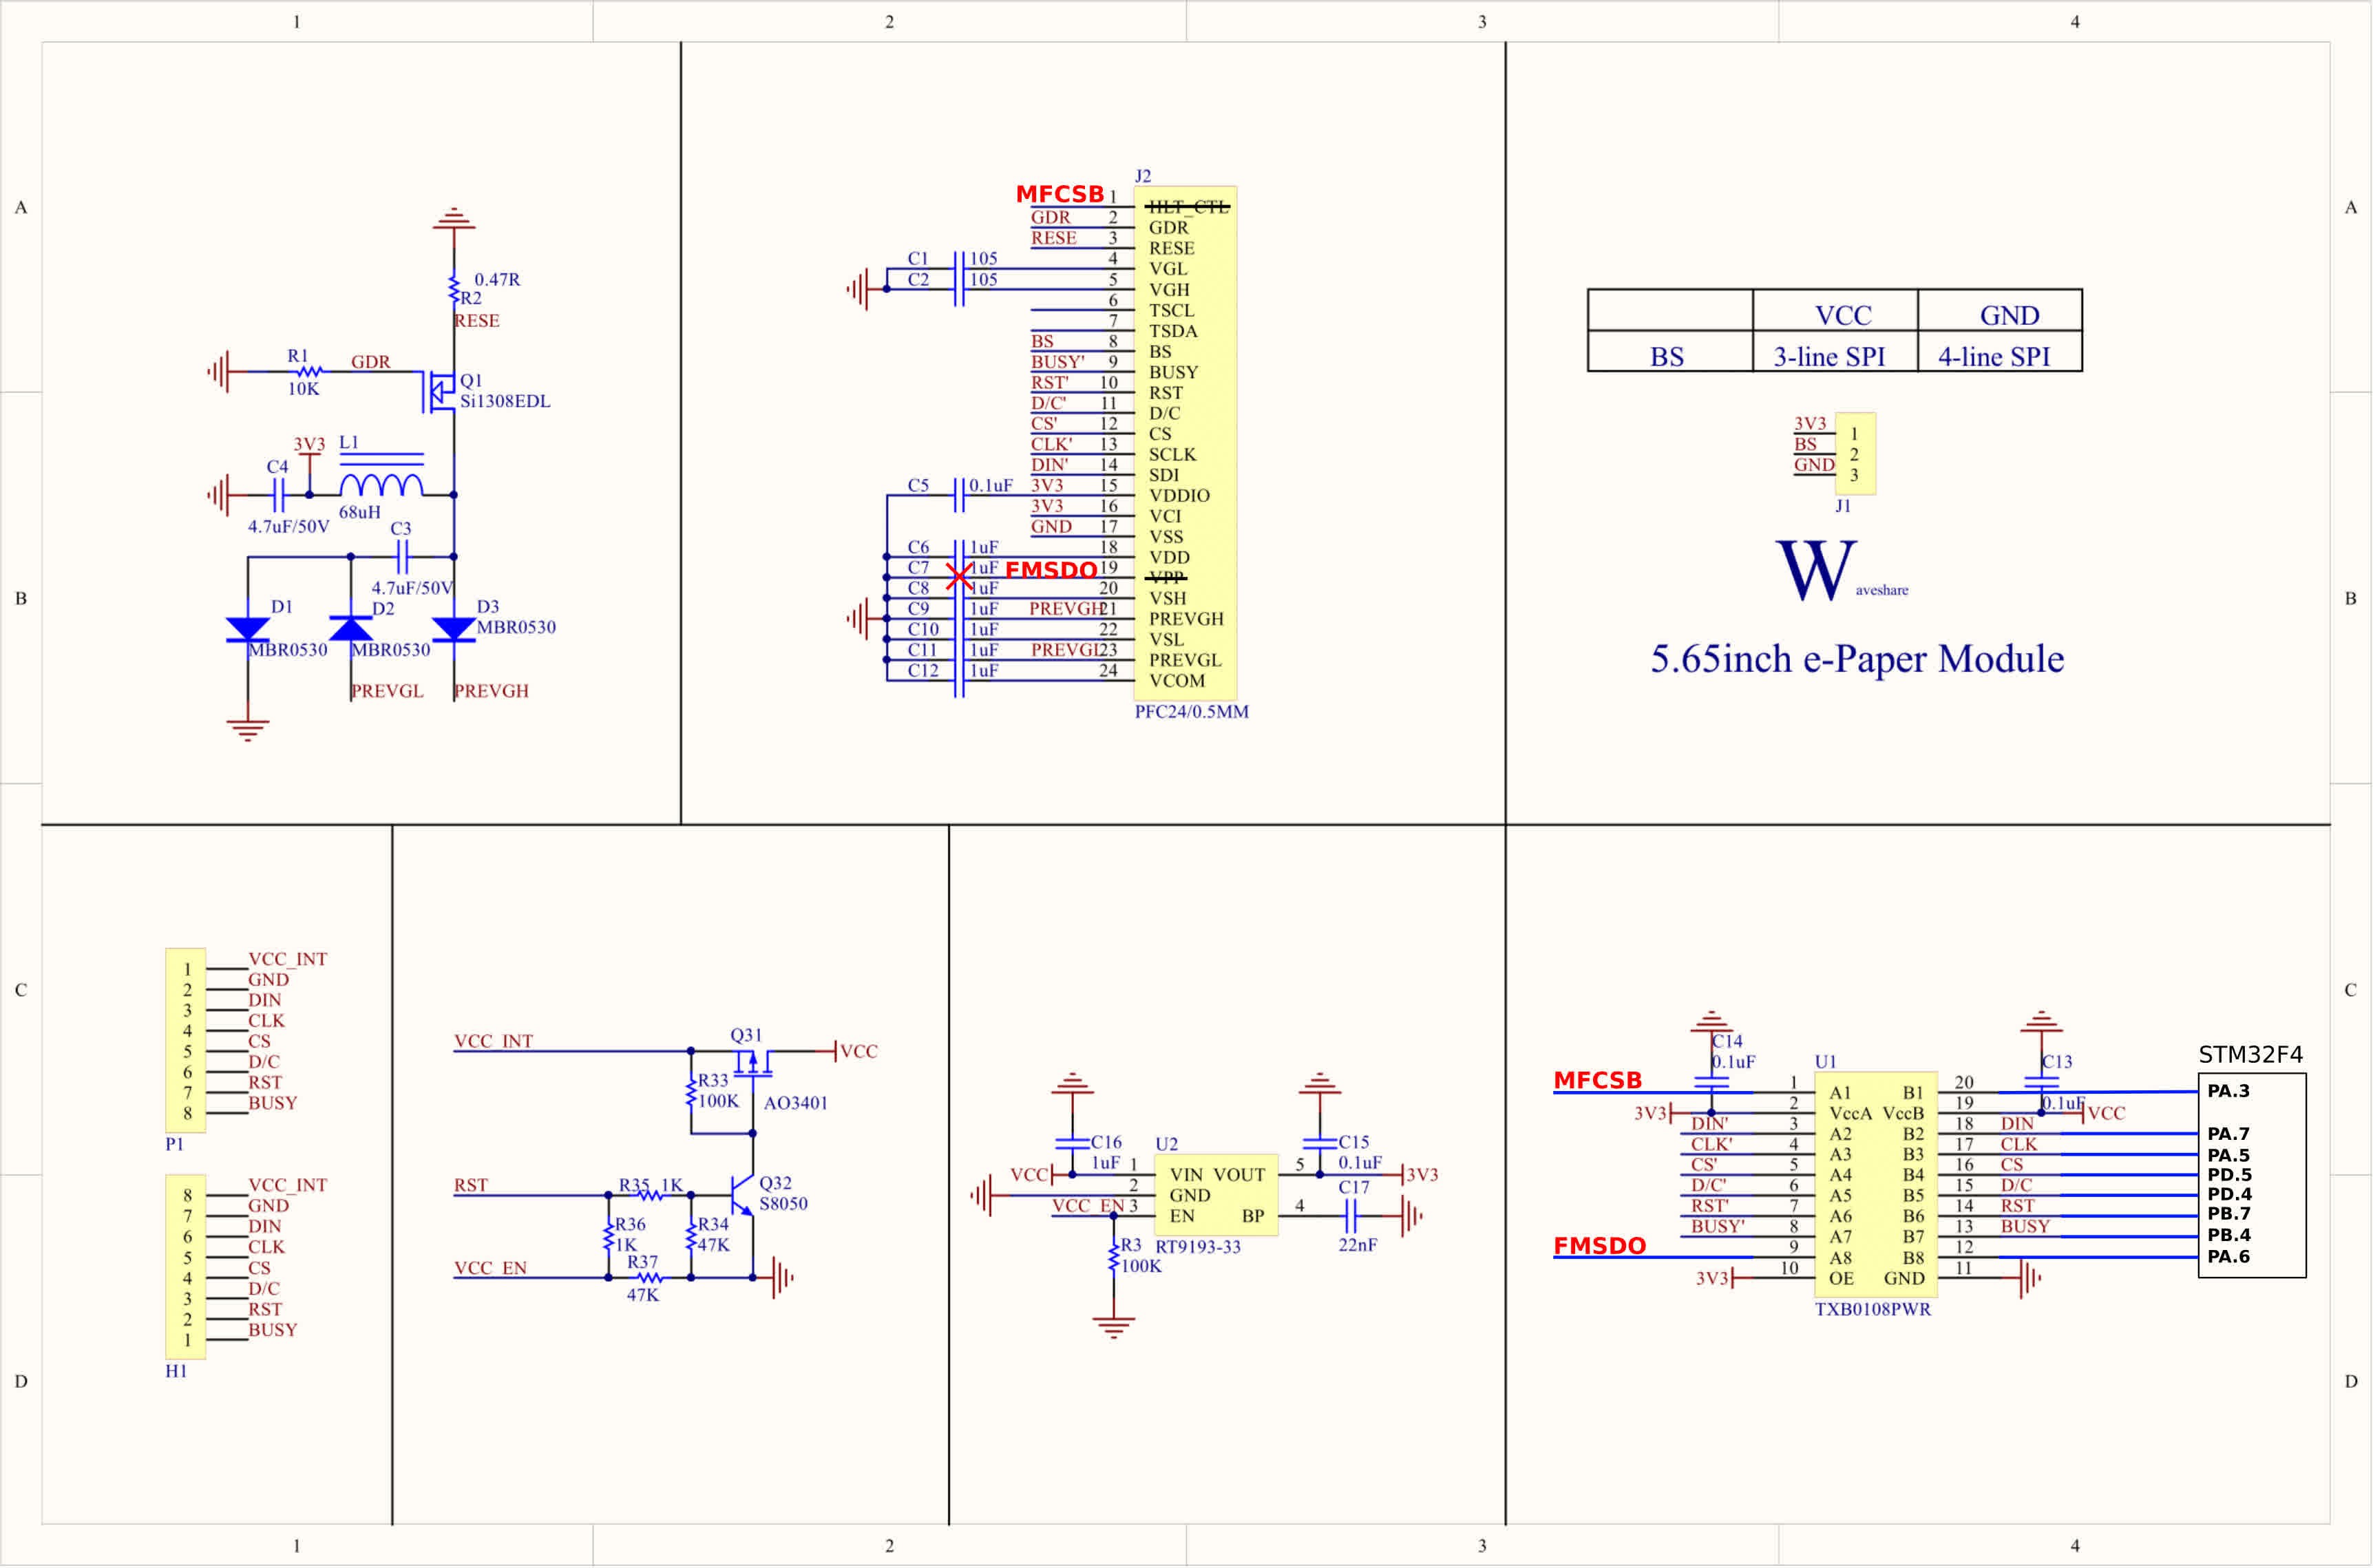
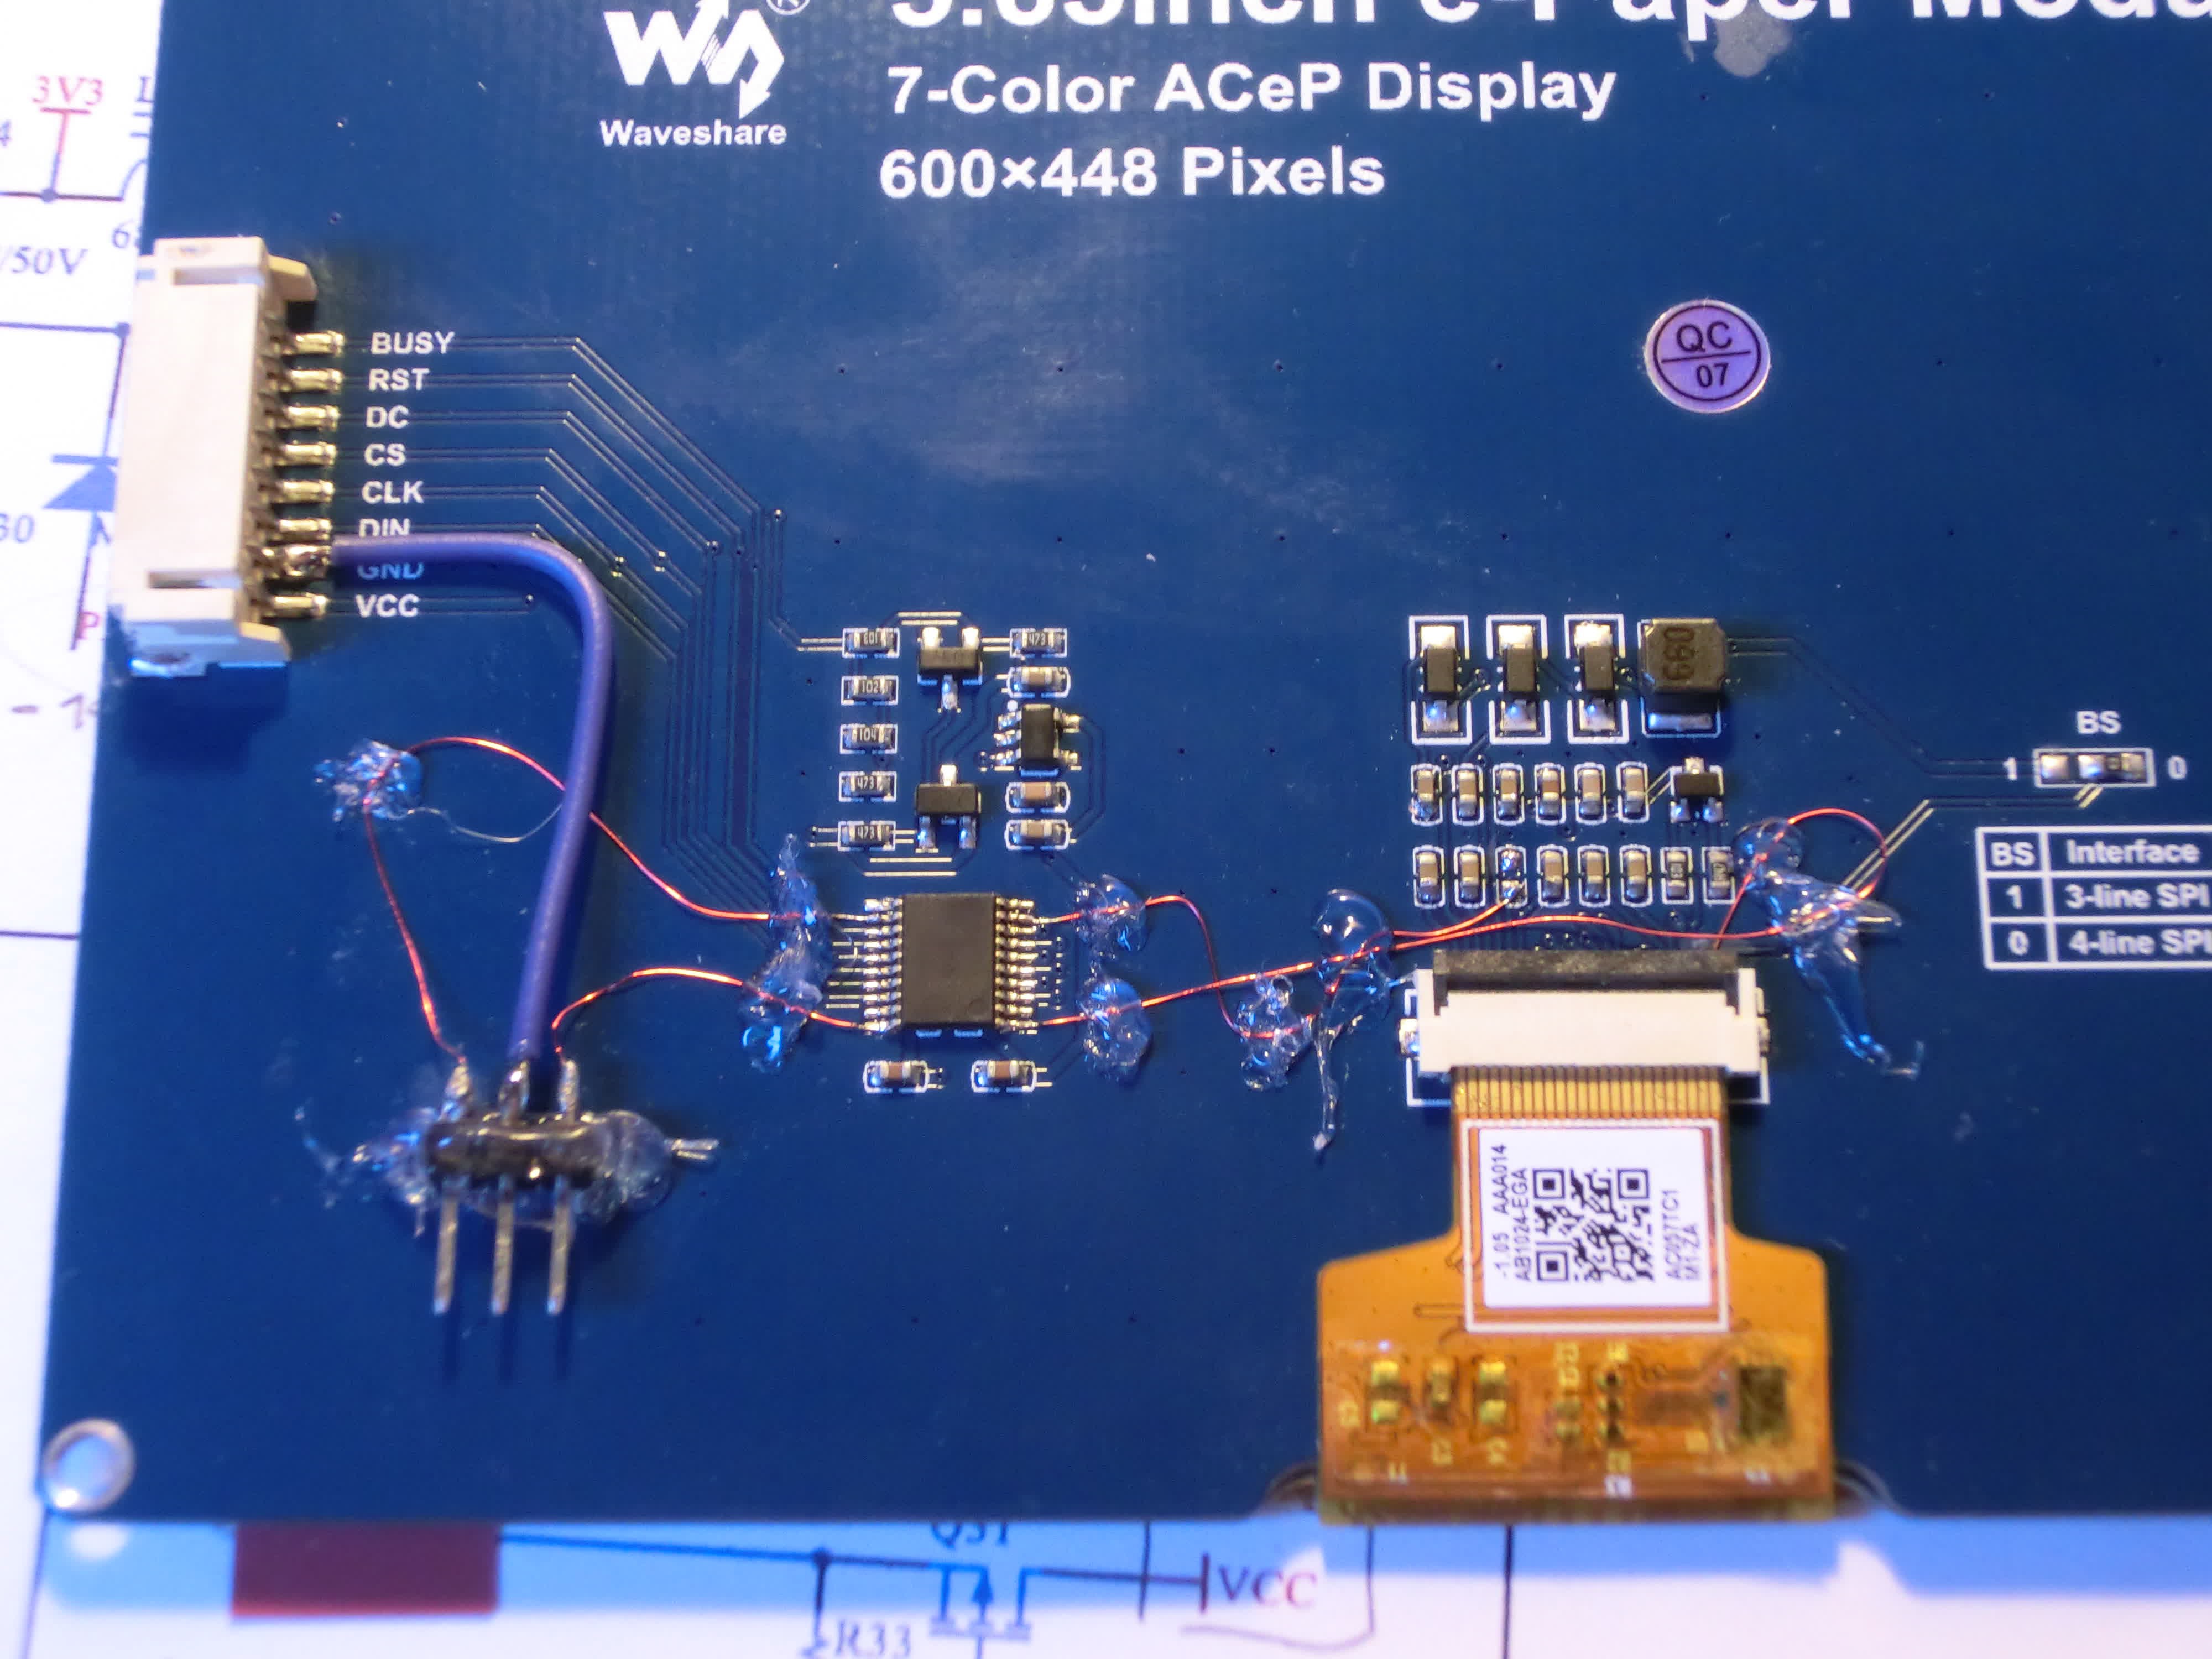
Before going too deep into designing custom LUTs from scratch, I thought it would be interesting to see how the stock ones look like. We have already seen that the LUTs are stored on a FLASH memory that's soldered directly on the FLEX cable. The package is a bit of a pain to work with, it's an 8 pin USON with a 0.5 mm pin pitch. Fortunately, the controller has a mode where the internal SPI master is bypassed, and the memory can be accessed via the main SPI bus. To make this work, two more pins have to be connected, MFCSB and FMSDO, they are respectively the memory chip select and data out. The breakout board doesn't provide connections for them, some modification is needed. Conveniently, the level translator has two unused lines that we can use to interface with the microcontroller.
![Display breakout board modified schematic Display breakout board modified schematic]()
Display breakout board modified schematic. I used magnet wire to make the connections, secured them in place with hot glue. The two extra lines come out from the bottom header. The center conductor is ground. Originally I tried without it, but it didn't work. With 30 cm of cable, only one ground wasn't enough to run a 1Mb SPI.
![Display breakout board mod Display breakout board mod]()
Display breakout board mod. I'm using an STM32F4 Discovery as my development platform. After connecting the display, I wrote some code to spit out the FLASH content over the serial port. From the manufacture and device ID, I determined that the memory is a Winbound 2Mbit W25X20CL. With PuTTY running in log mode on my desktop, I was able to extract the contents of the memory. All the code that I've used is on GitHub, here is a link to the memory dump.
Flash memory content
Waveshare recently released more information about the controller. The right one is the SPD1656. On page 15 of the datasheet, there is the complete memory layout. Besides LUTs, there are also voltages and framerates for each temperature range. In this particular case, they are the same for every temperature, but they don't need to be. The full listing can be found here.
------------------------------------------
 VCOM DC OFFSET SAME FOR ALL TEMPERATURES
------------------------------------------
VCM_DC = 1.050000e+00 V

---------------------------------------------------
 VOLTAGES AND FRAMERATE FOR DIFFERENT TEMPERATURES
---------------------------------------------------
T0 TEMP < 18°C
VSHC_LVL   =   10 V
VSLC_LVL   =  -10 V
LVL2_EN    =    0
VSLC_LVL2  =    3 V
FRAME RATE =   50 Hz

T1 18°C <= TEMP < 21°C
VSHC_LVL   =   10 V
VSLC_LVL   =  -10 V
LVL2_EN    =    0
VSLC_LVL2  =    3 V
FRAME RATE =   50 Hz

...
From LUTs to waveforms
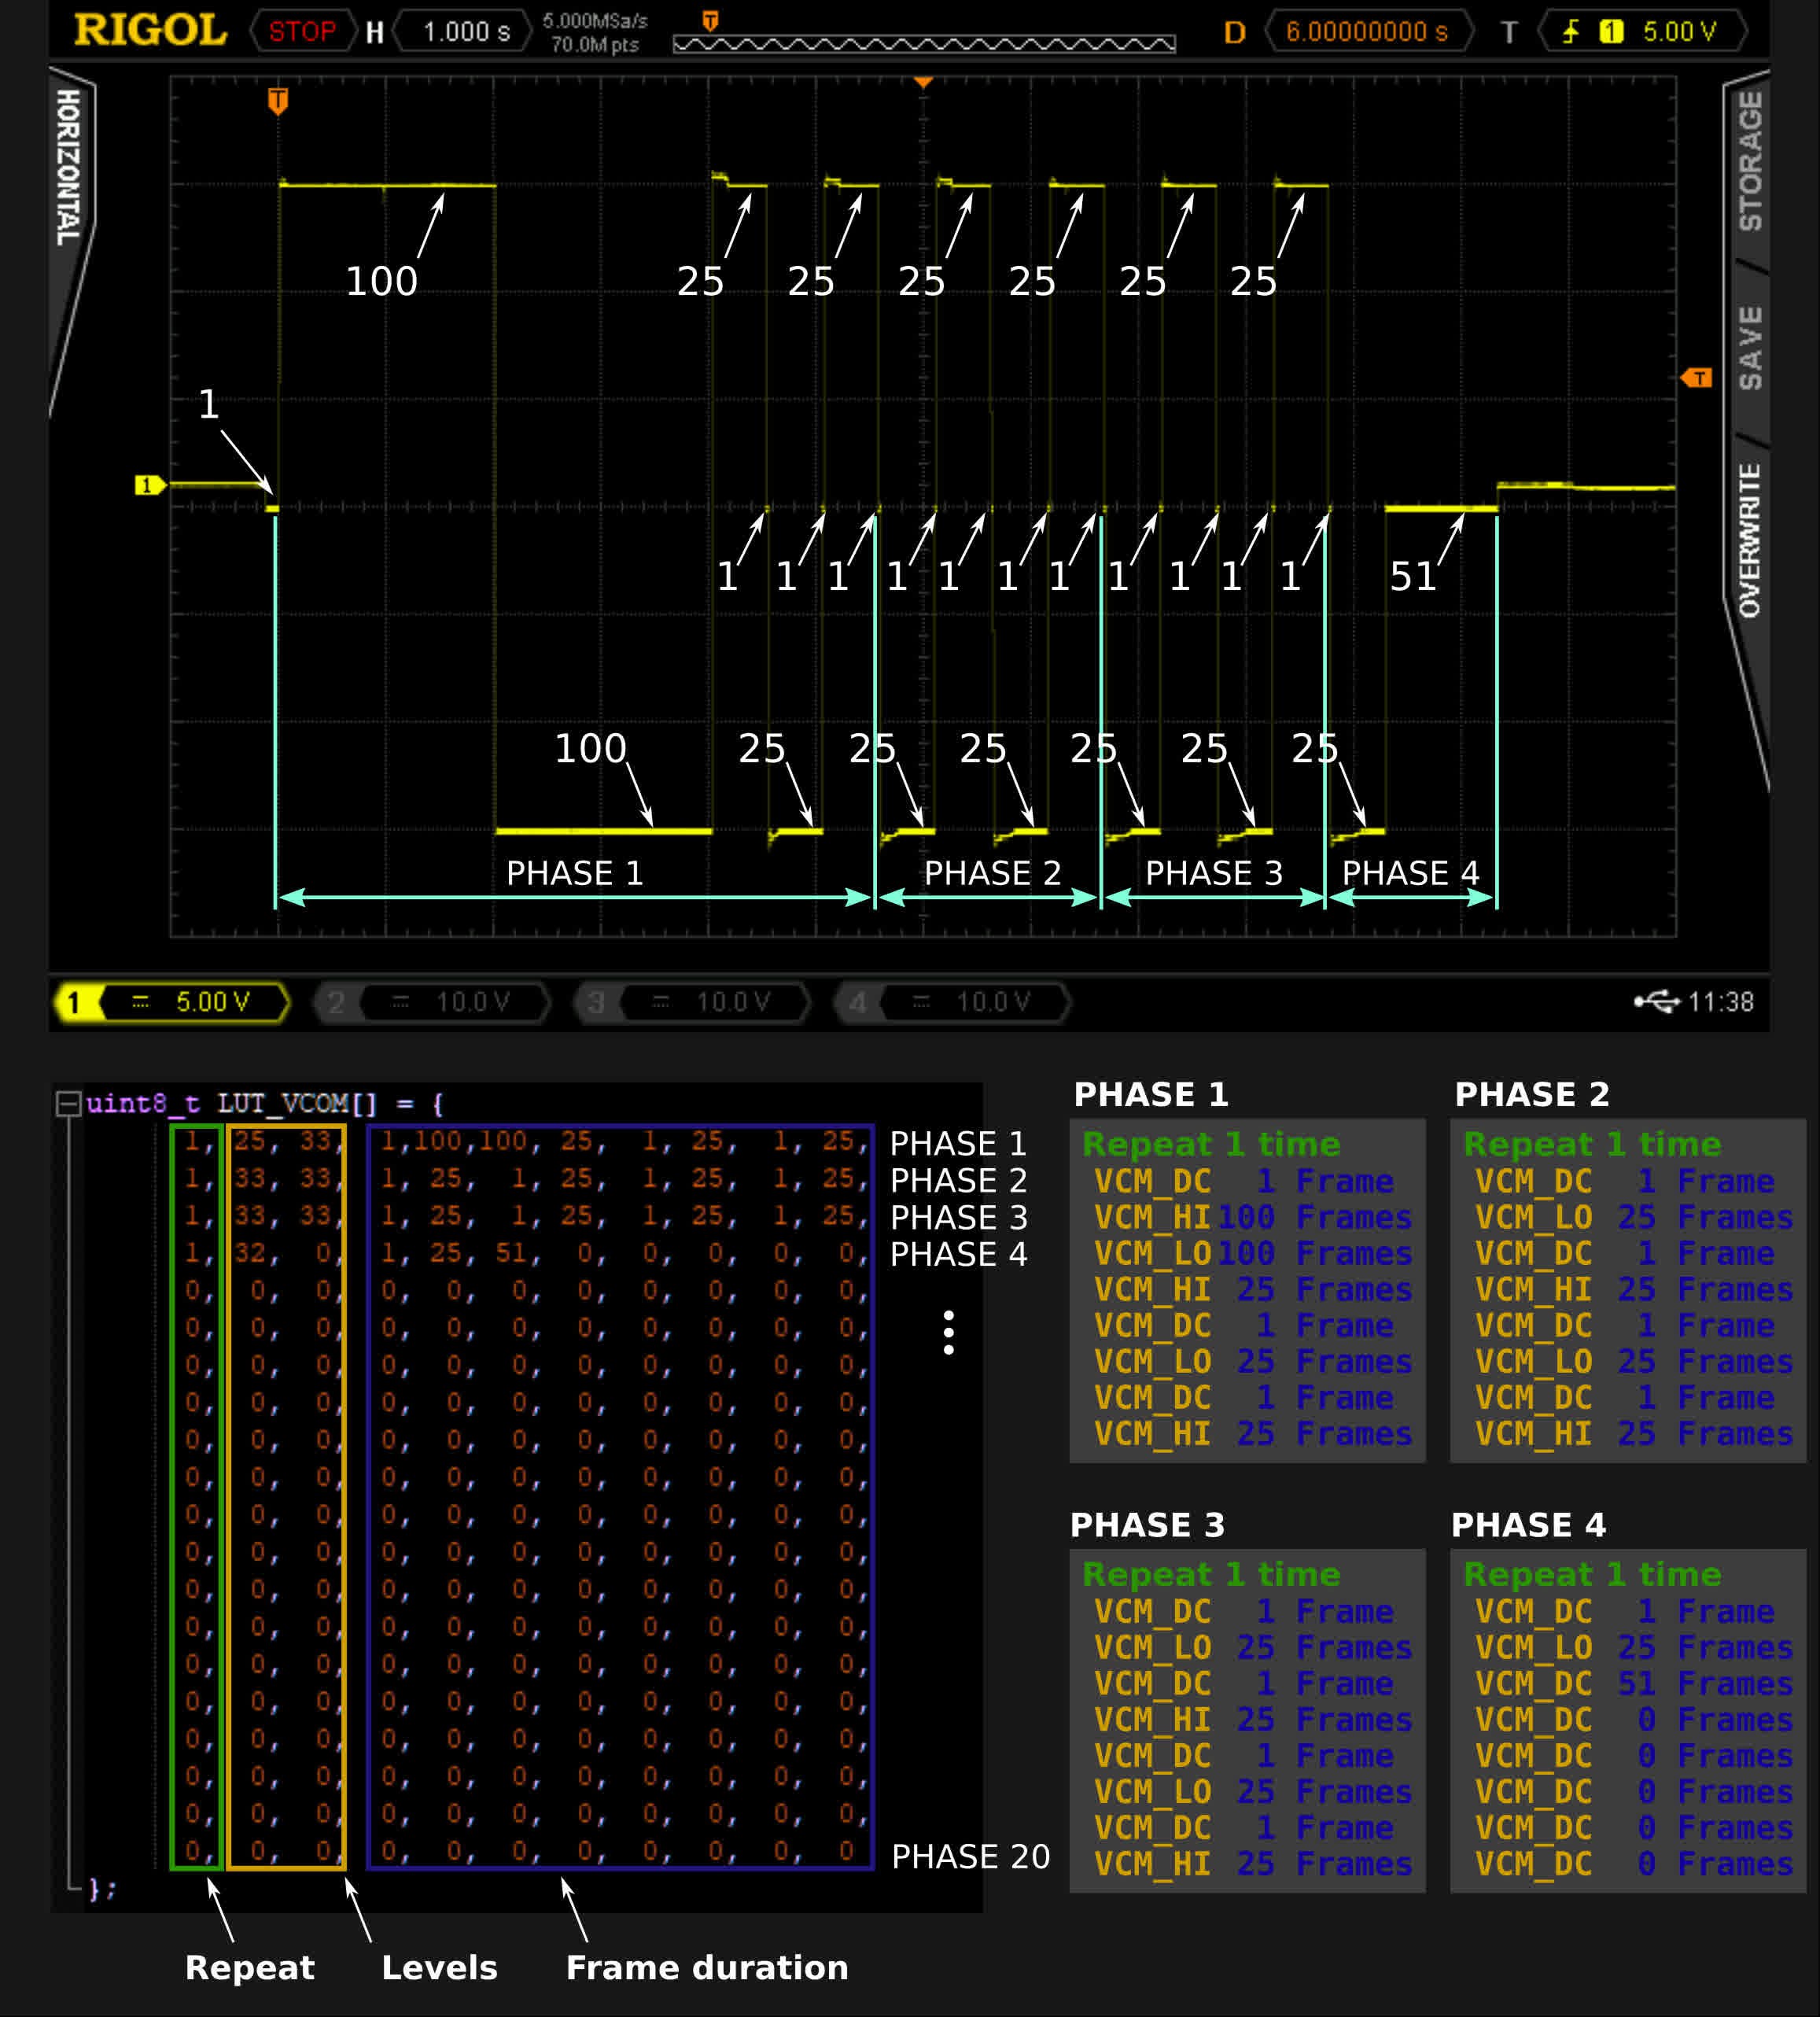
Now I want to explain how the waveforms are constructed. Taking as an example the previously measured VCOM voltage, we can see the correspondence between the trace and what's inside the LUT.
![VCOM waveform analysis VCOM waveform analysis]()
VCOM waveform analysis. More LUTs
Besides VCOM, there are 8 more waveforms one for each color. I made a couple of MATLAB scripts that can plot them for us. Since the display cares only about the difference in voltage between the common electrode and the pixel electrodes, the following plots represent the difference between VCOM and the color waveform. The waveforms are positive when the voltage on the common electrode is higher than that of the pixel electrodes.
The display supports 10 temperature ranges. Here I show only the waveforms for the range 21°C to 24°C the others can be found on GitHub.
Black waveform, 21°C to 24°C temperature range.
![]()
Blue waveform, 21°C to 24°C temperature range.
![]()
White waveform, 21°C to 24°C temperature range.
![]()
Green waveform, 21°C to 24°C temperature range.
![]()
Red waveform, 21°C to 24°C temperature range.
![]()
Yellow waveform, 21°C to 24°C temperature range.
![]()
Orange waveform, 21°C to 24°C temperature range.
![]()
Clean waveform, 21°C to 24°C temperature range.
![]()
Conclusion
What can we derive from this?
First of all, VCOM has a DC offset. Not sure why, I think it's there to bias the TFT matrix. Ignoring that, all the waveforms average to 0, that's important to not damage the display.
Second, the waveforms seem to be made up of two parts. The first is like a DC balance plus it leaves the display in a known state. The second is where the colors are developed.
If you see something else please leave a comment, we need to master this thing :)
EDIT 10/05/2021:
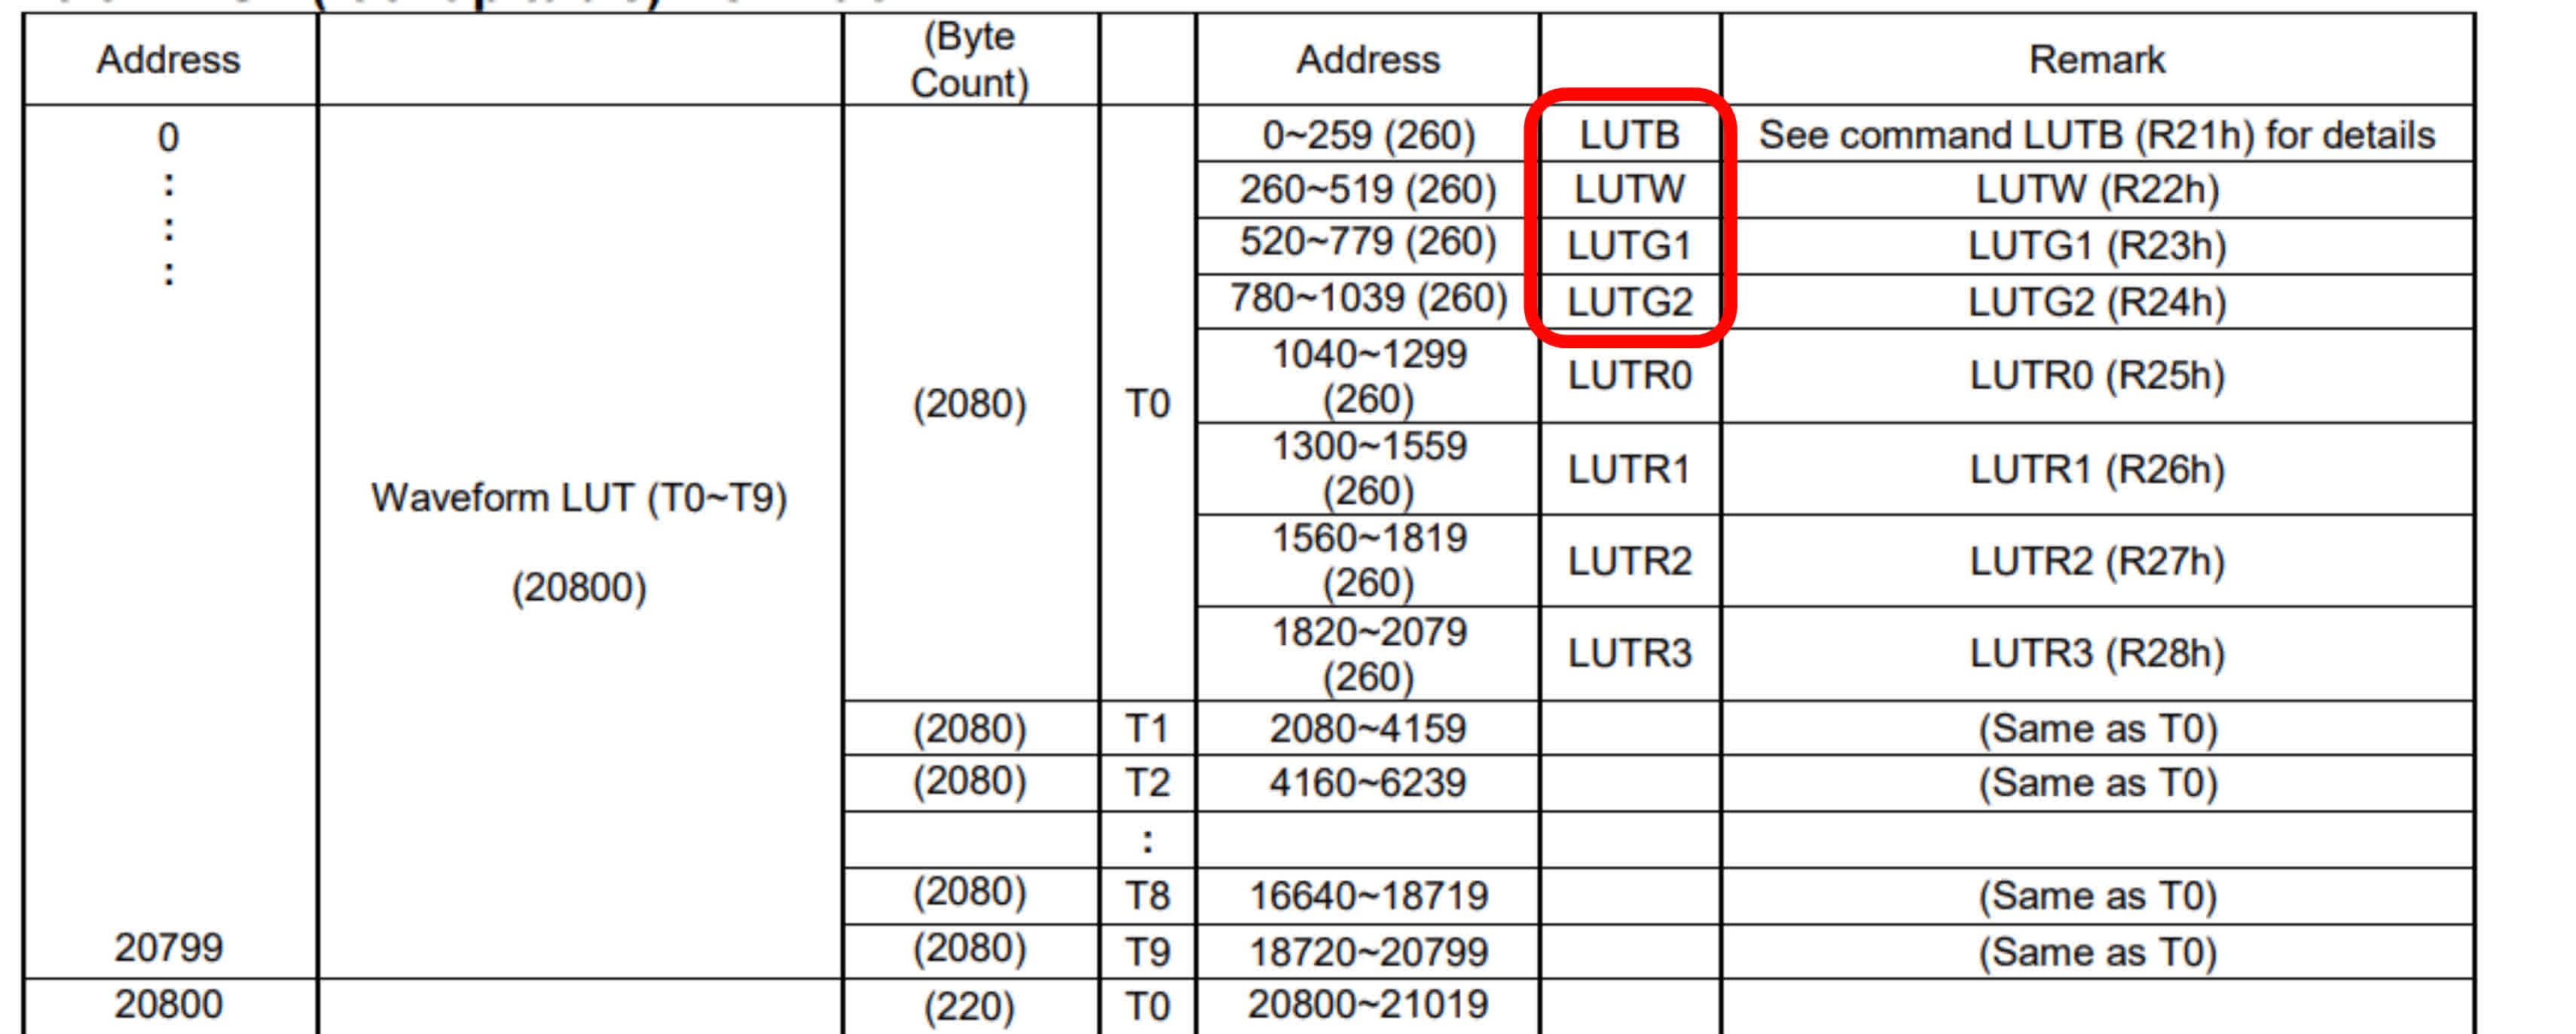
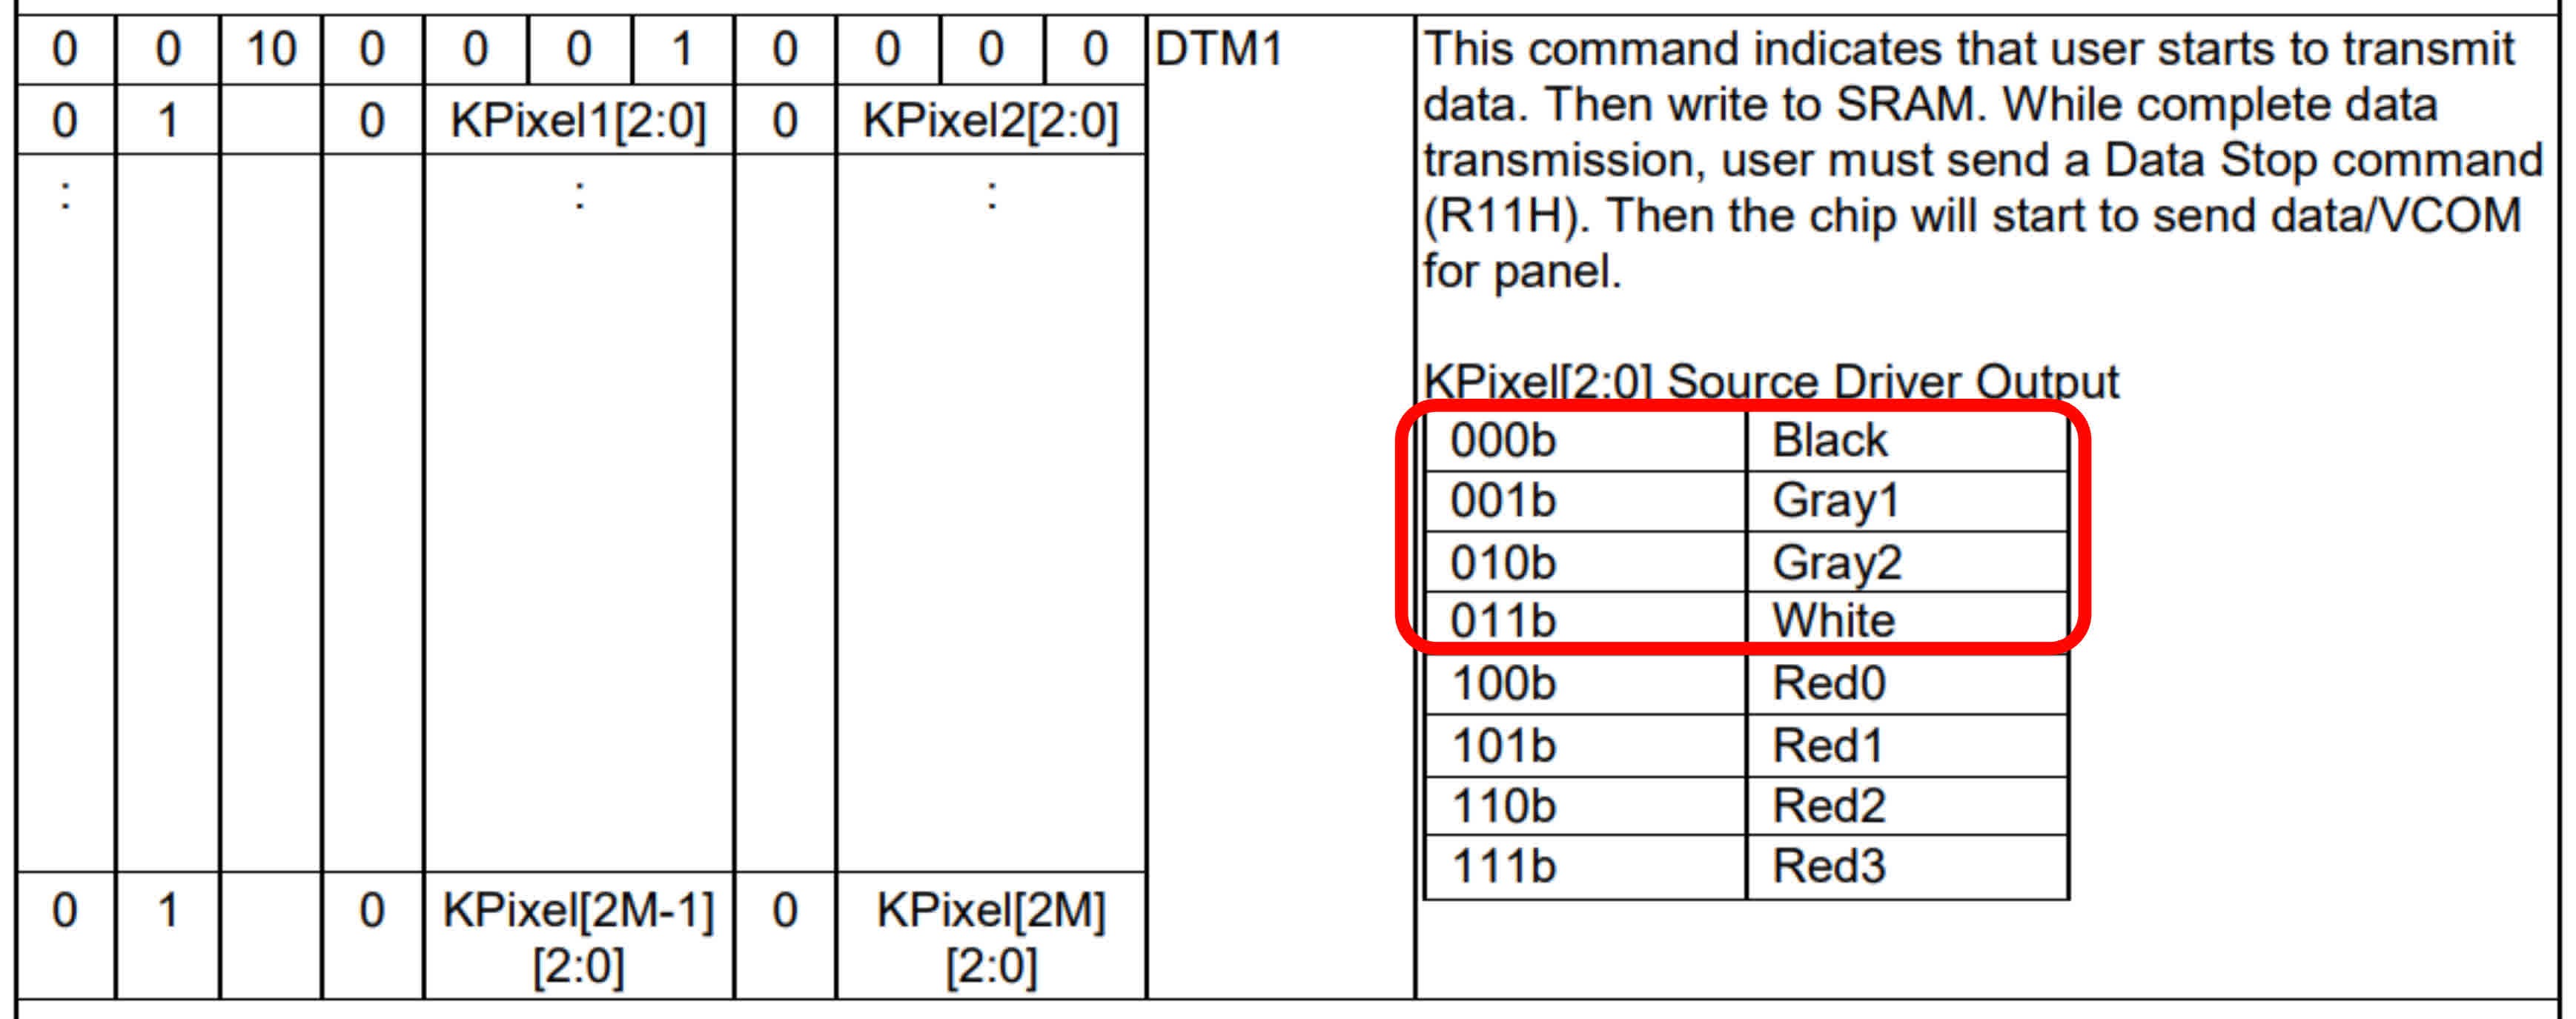
Modified title for the first 4 plots. Playing around with the display I found a quirk in the controller. If you look at the order in which the LUTs are stored in FLASH and what registers are loaded, you see that for the first 4 LUTs, the pixel value doesn't correspond.
![FLASH memory layout FLASH memory layout]()
FLASH memory layout ![DTM1 command DTM1 command]()
DTM1 command -
How ACeP Displays Work
04/12/2021 at 18:09 • 0 commentsPixel Construction
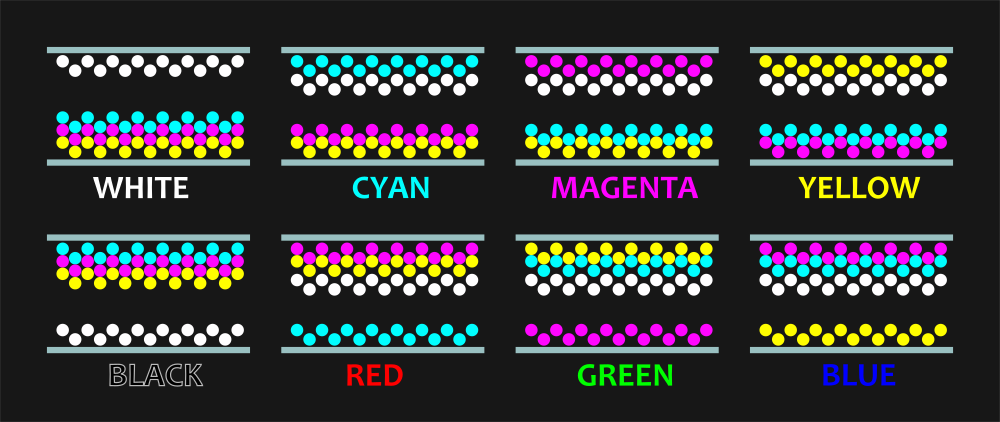
Advanced Color ePaper (ACep) displays remove the need for a color filter by having all the colored pigments in every pixel. The pixels are small capsules filled with some sort of a liquid substance. Each capsule contains fore different pigments (yellow, cyan, magenta, and white), the colored pigments are transparent while the white pigment is not. Two of the pigments are positively charged while the others are negatively charged. Pigments have also different sizes and/or different charge densities. Size determines the speed at which particles move (smaller particles move faster), charge density determines the minimum required voltage for a particle to move (slightly charged particles require more voltage). By applying a variable external electric field across the capsules it's possible to change the relative position of the particles. The light that enters the pixel is scattered by the white particles, if they are on top then the pixel appears white, if there's some other pigment before the withe ones, light that passes through picks up the pigment color before been reflected by the white particles. Been the colored pigments transparent it doesn't matter the order in which they are found, all that matters is what's in front of the white particles.
The following picture shows how it is possible to obtain the eight primary colors with only four colored pigments. It should also be possible to make lighter or darker colors by hiding a faction of the colored pigments being the white pigment.
![Primary colors Primary colors]()
Display Construction
This section describes how the controller is able to drive each pixel with the proper electric field.
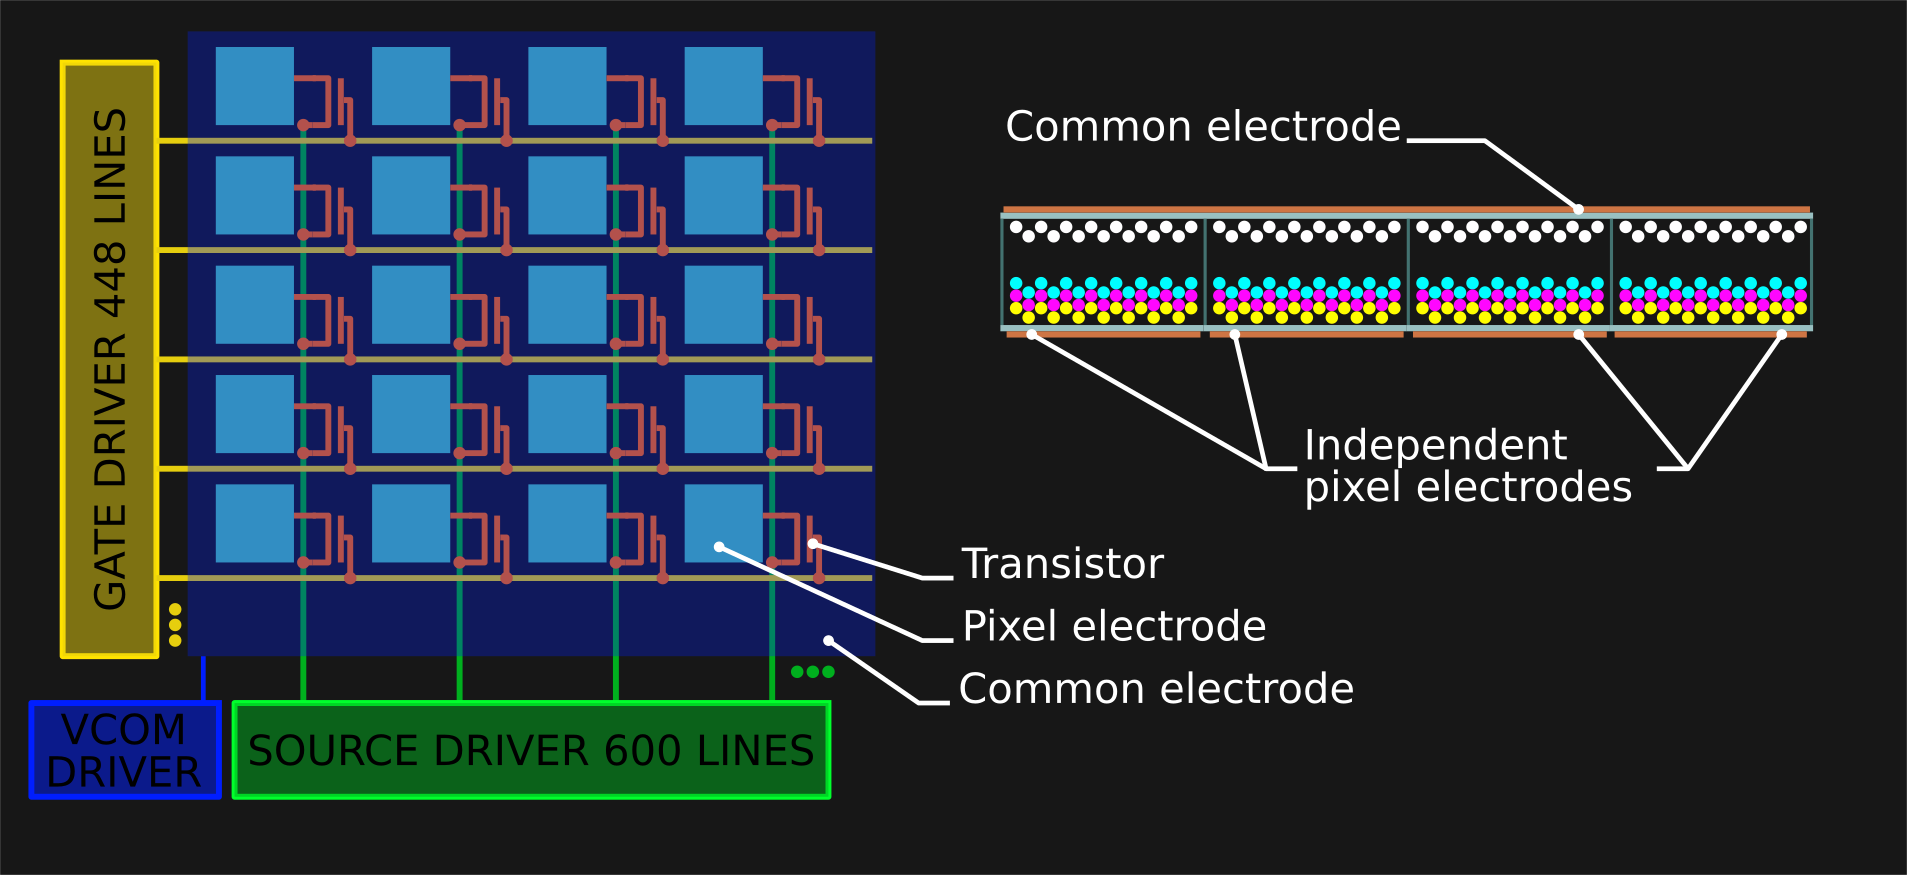
The display uses a TFT matrix like an LCD screen. The grid of pixels is sandwiched between two electrode layers. The top electrode layer is transparent and common for all pixels, spreading over the entire surface. The bottom electrode layer is chopped up into little squares, one for each pixel. Each one of these tiny electrodes is connected to the drain of a transistor. The gates of all transistors in a row are connected together, same for the source connections in a column.![TFT matrix TFT matrix]()
The matrix is scanned line by line sequentially, a positive voltage is applied to one of the gate lines while the others are held at a negative voltage. This turns on the corresponding line of transistors. At the same time, the source lines determine what voltage is applied to the pixels in the active line. By sequentially activating one line at a time and at the same time driving the appropriate voltage on the source lines, every pixel can be individually addressed.
Frame Rate
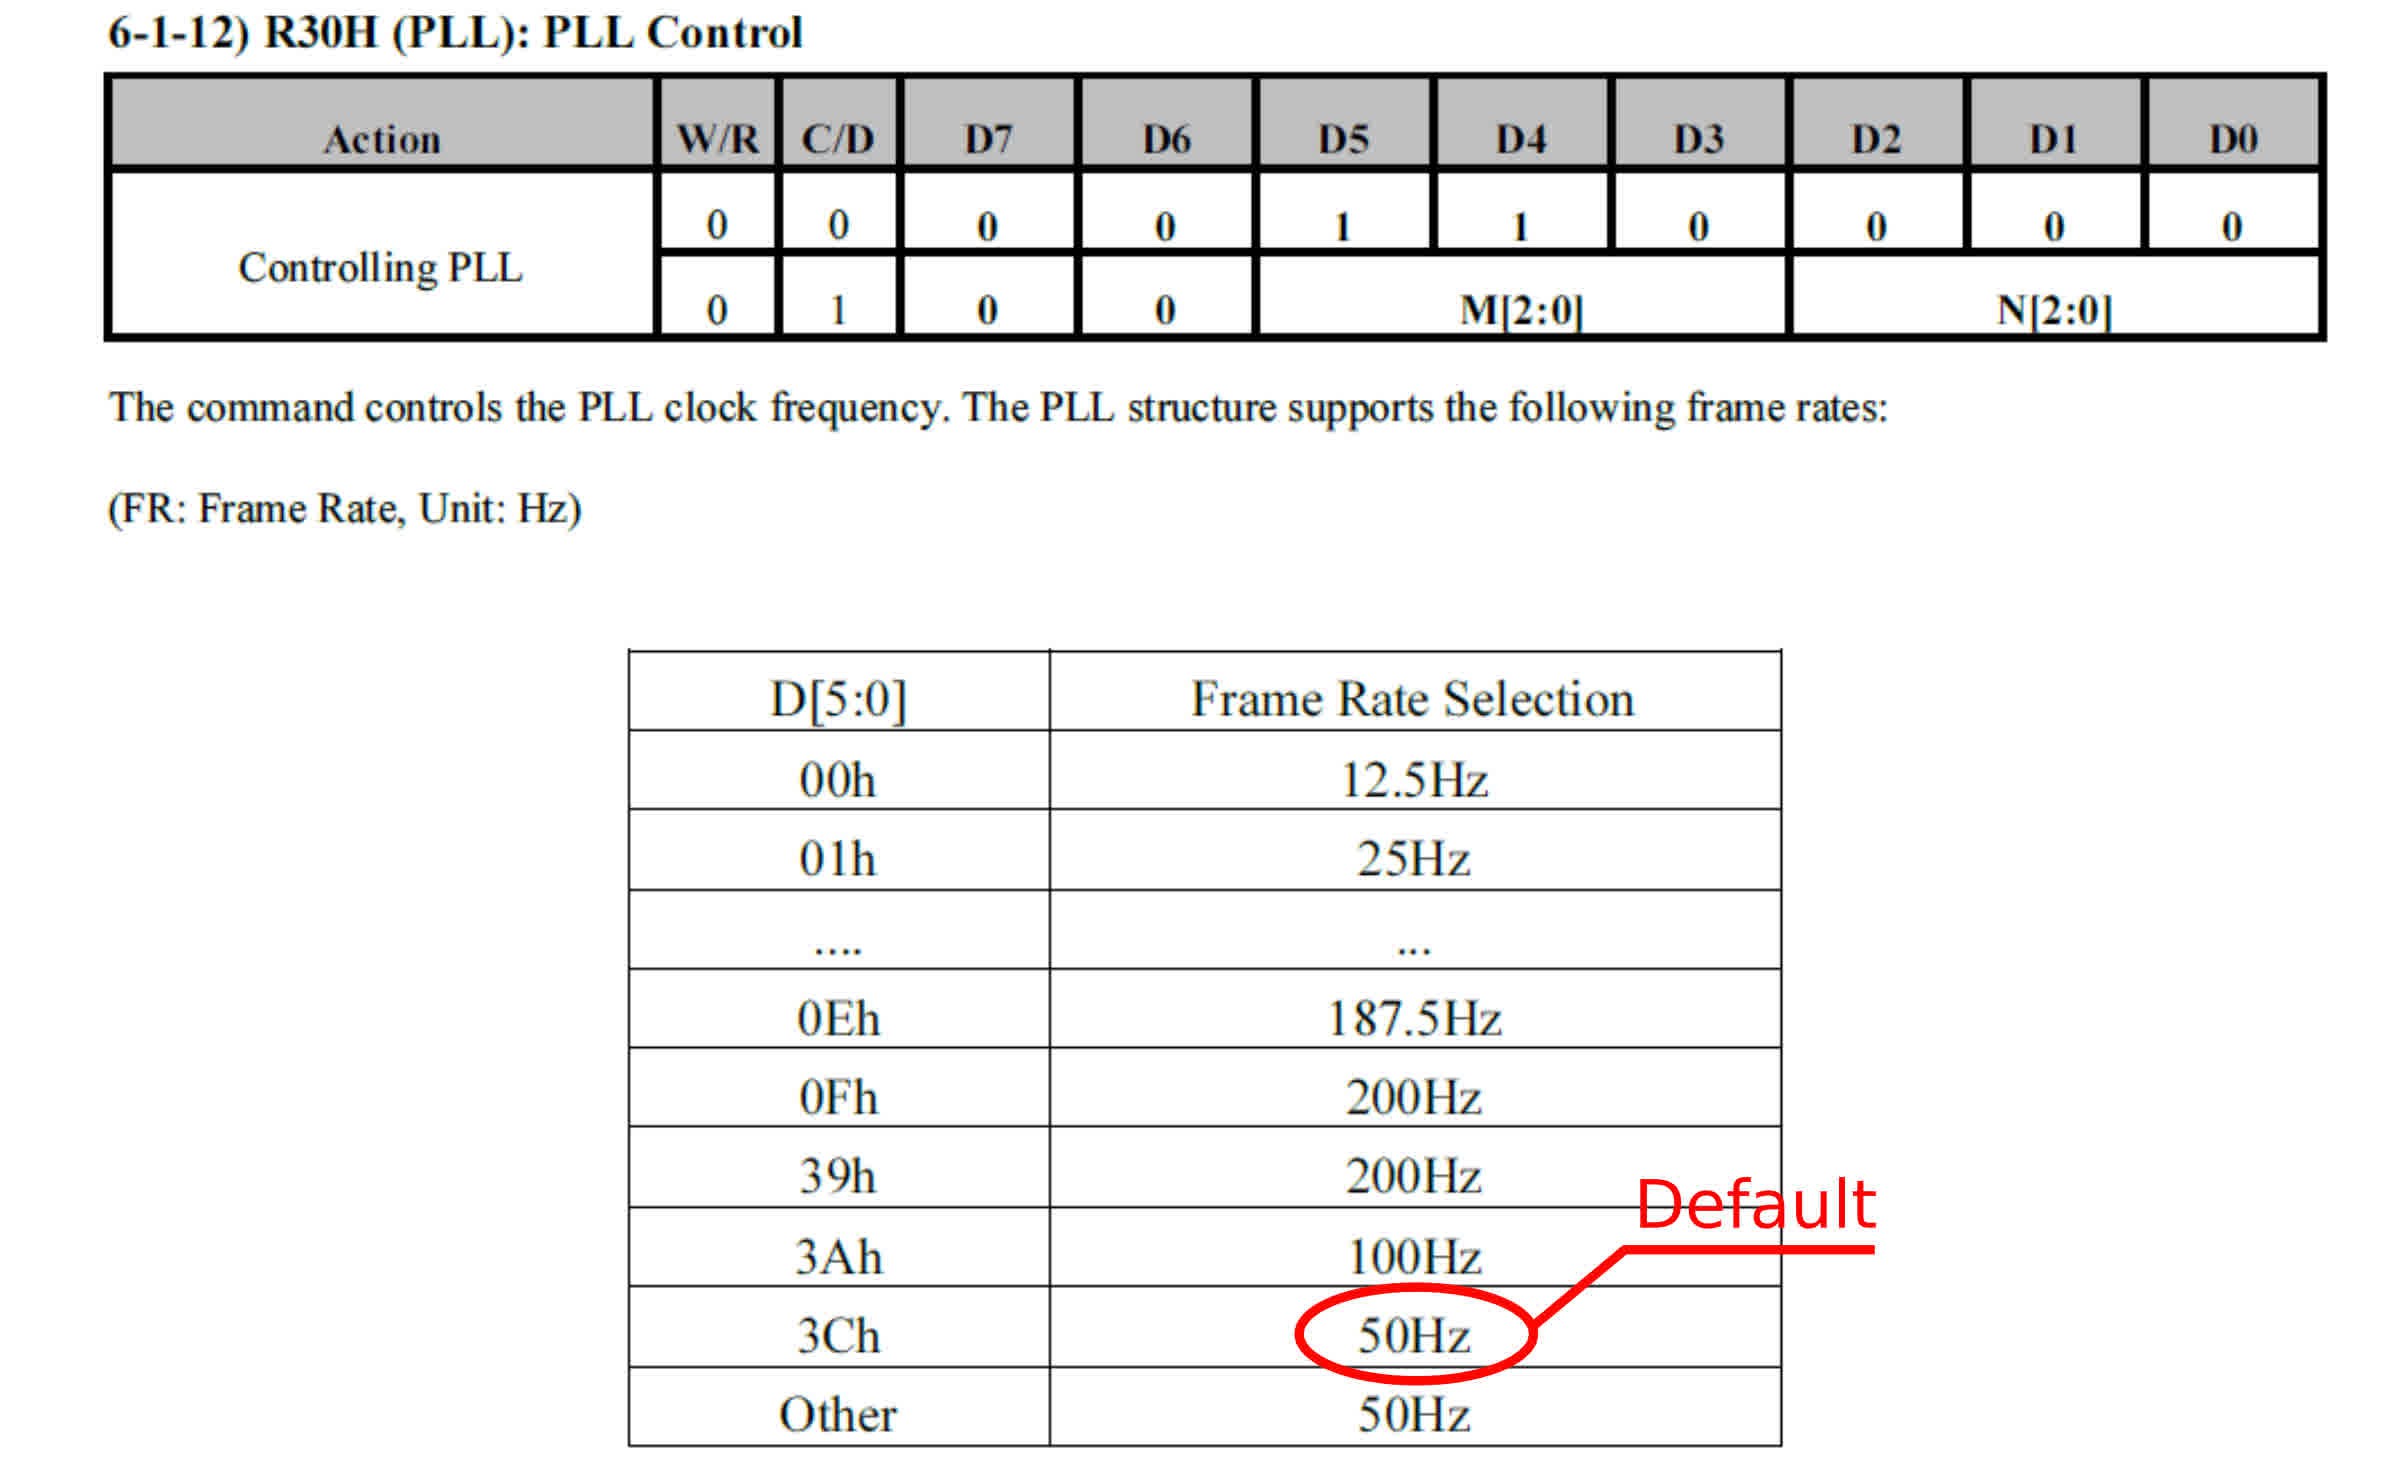
The first time I heard of frame rate in the context of e-Paper displays I didn't really understand it. I mean we know that e-Papers take a long time to update, so why is the default frame rate 50Hz?
![PLL register PLL register]()
5.65inch e-Paper Module (F) Specification (Page 12) This is where the difference between LCDs and e-Paper comes in. With LCD screens the image updates every time the TFT matrix is scanned, with e-Papers it takes multiple frames to change the state of the pixels. The frame rate specifies the frequency at which the TFT matrix is scanned, with each scan it's possible to change the voltage applied to each pixel, but it takes multiple scans to update the image.
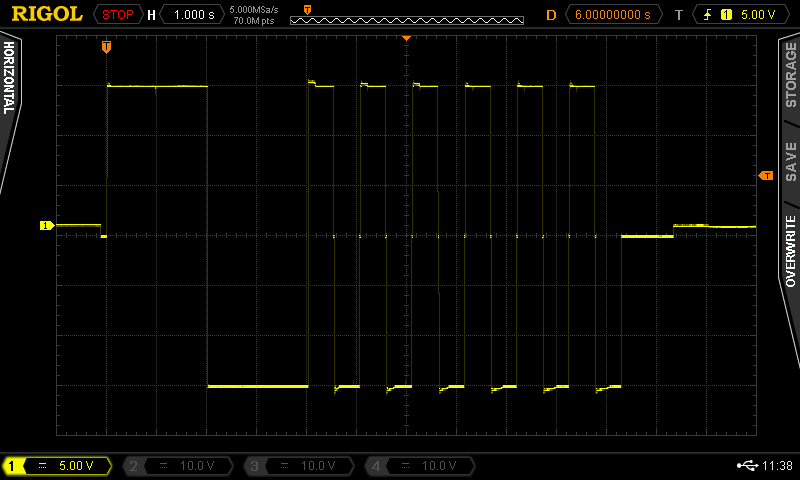
The following picture shows the measured VCOM (voltage on the common electrode) during an update cycle. Conveniently this voltage is exposed on the display connector and it easy to probe. All the features in this waveform appear at multiples of the frame period (20ms in this case).
![Measured VCOM voltage during update Measured VCOM voltage during update]()
Measured VCOM voltage during update LUTs
Look-up tables are what determines the sequence of voltages that are applied across every single pixel. For each voltage to be generated there is a corresponding LUT.
The display controller that I'm working with has 10 different LUTs- VCOM: controls the voltage of the common electrode
- LUT0 - LUT7: control the voltage applied to the individual pixel electrodes (the controller supports 8 different colors)
- XON: can bypass the gate scan logic and enable all the gate lines (don't know what it can be useful for, maybe a fast way to clear the screen?)
Each LUT is like a little program, a state machine inside the controller reads the entries and determines the proper voltage on a per-frame basis.
Conclusion
To wrap this up, LUTs are what we have to play around with to make the display do what we want.
Been able to measure the VCOM voltage is quite handy, we don't have to start completely from scratch to design hour custom waveforms.Next step I think it is to design some waveforms to characterize the pigments (charge polarity, speed).
 Manuel Tosone