 Robert Gawron
Hardware
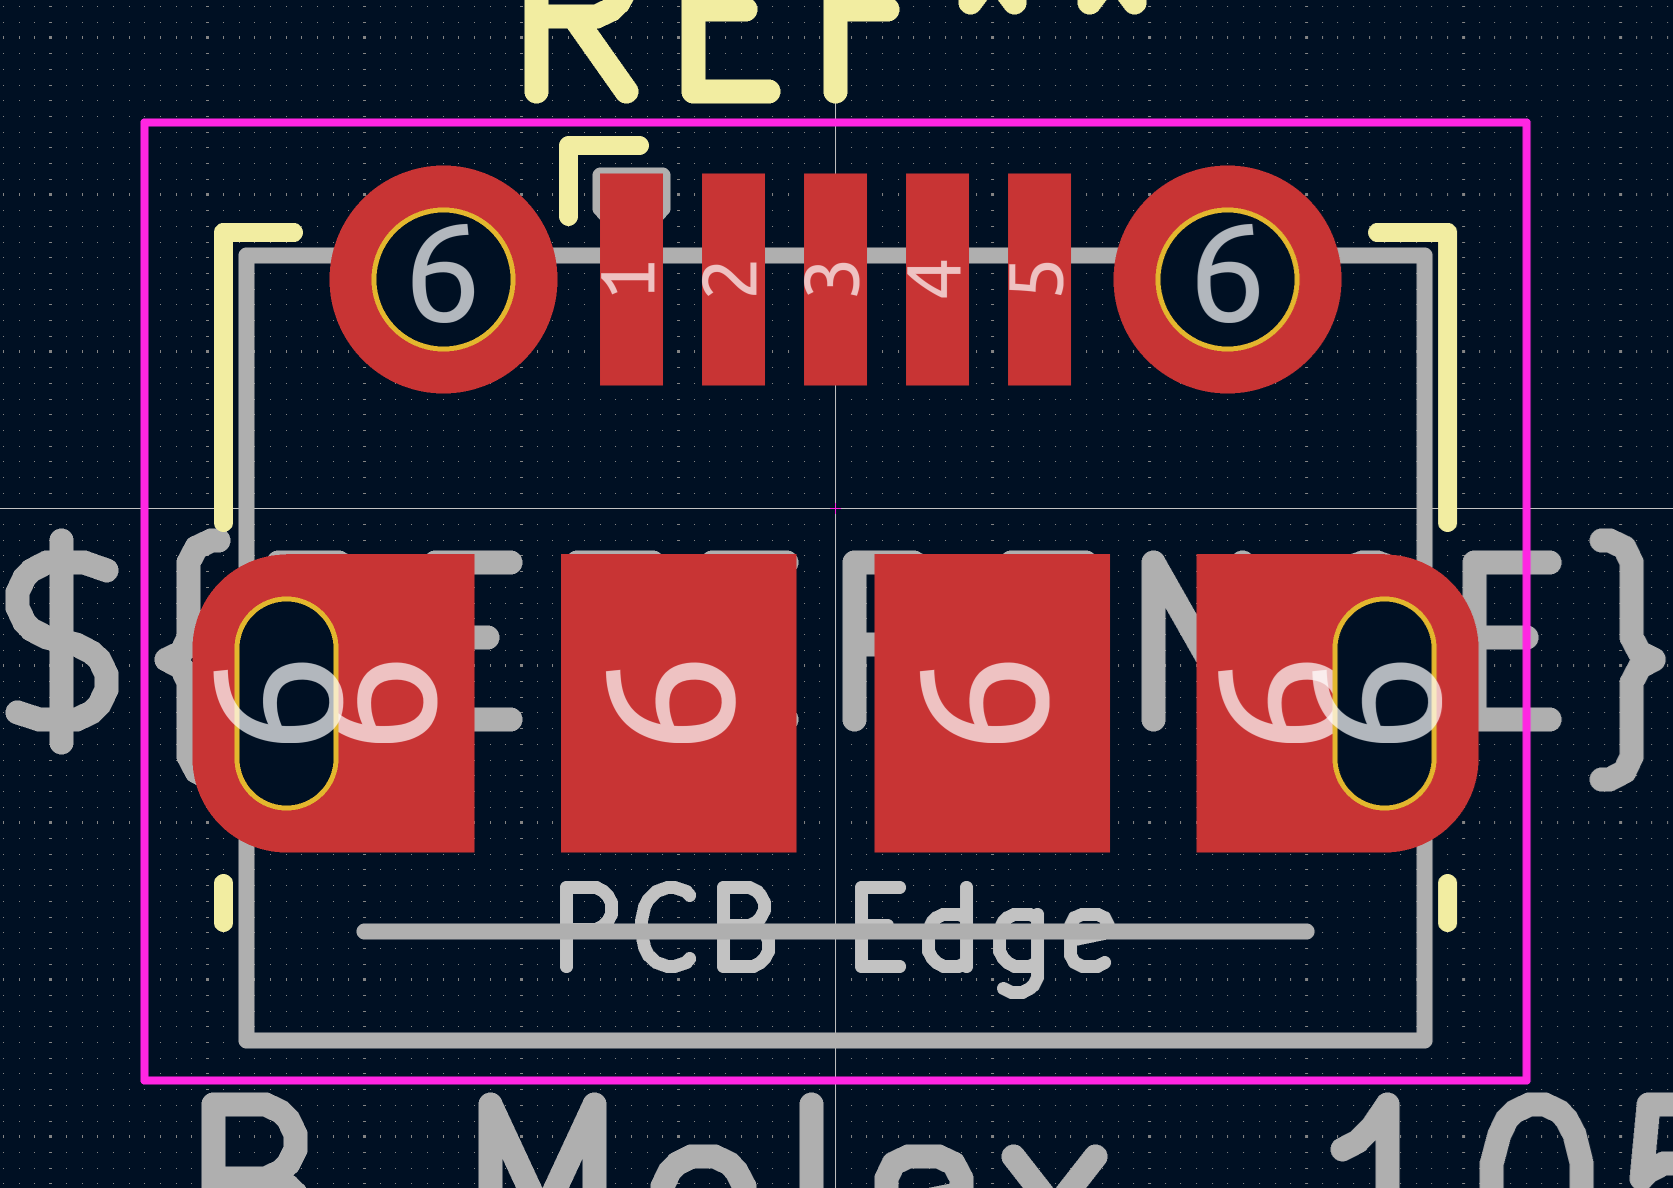
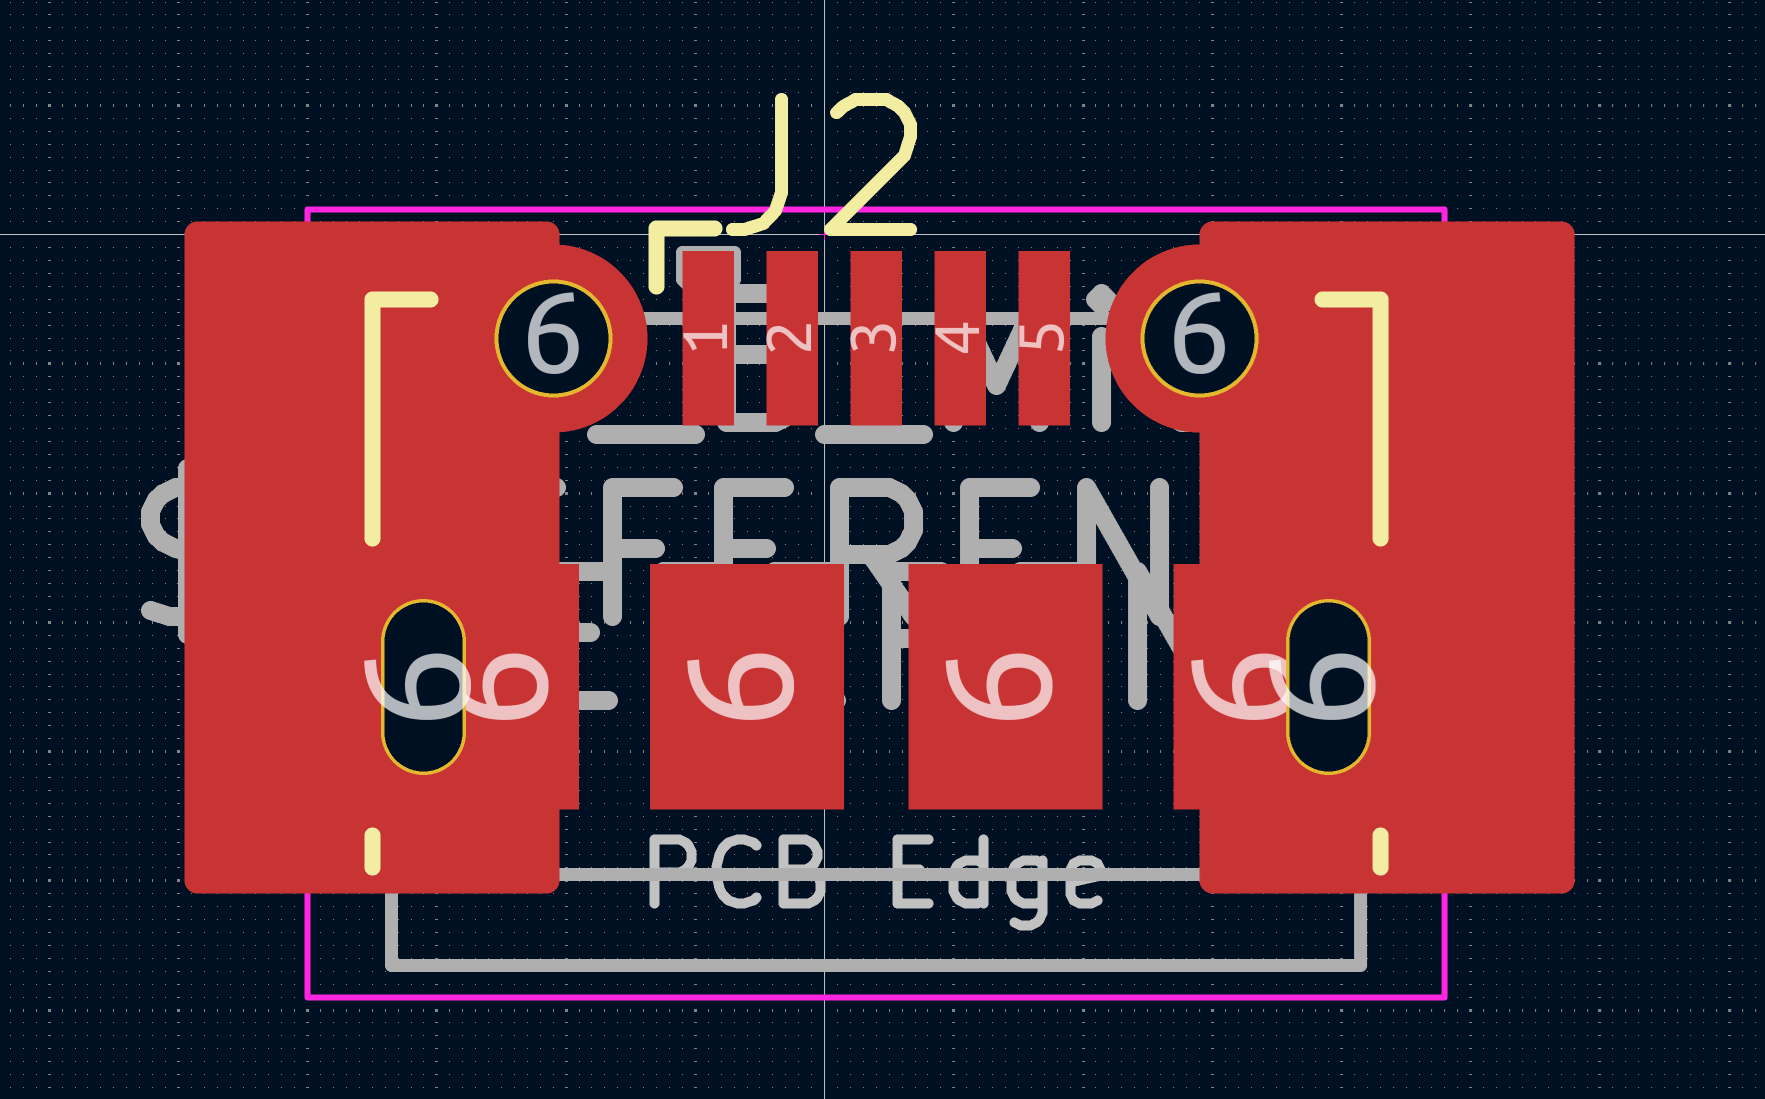
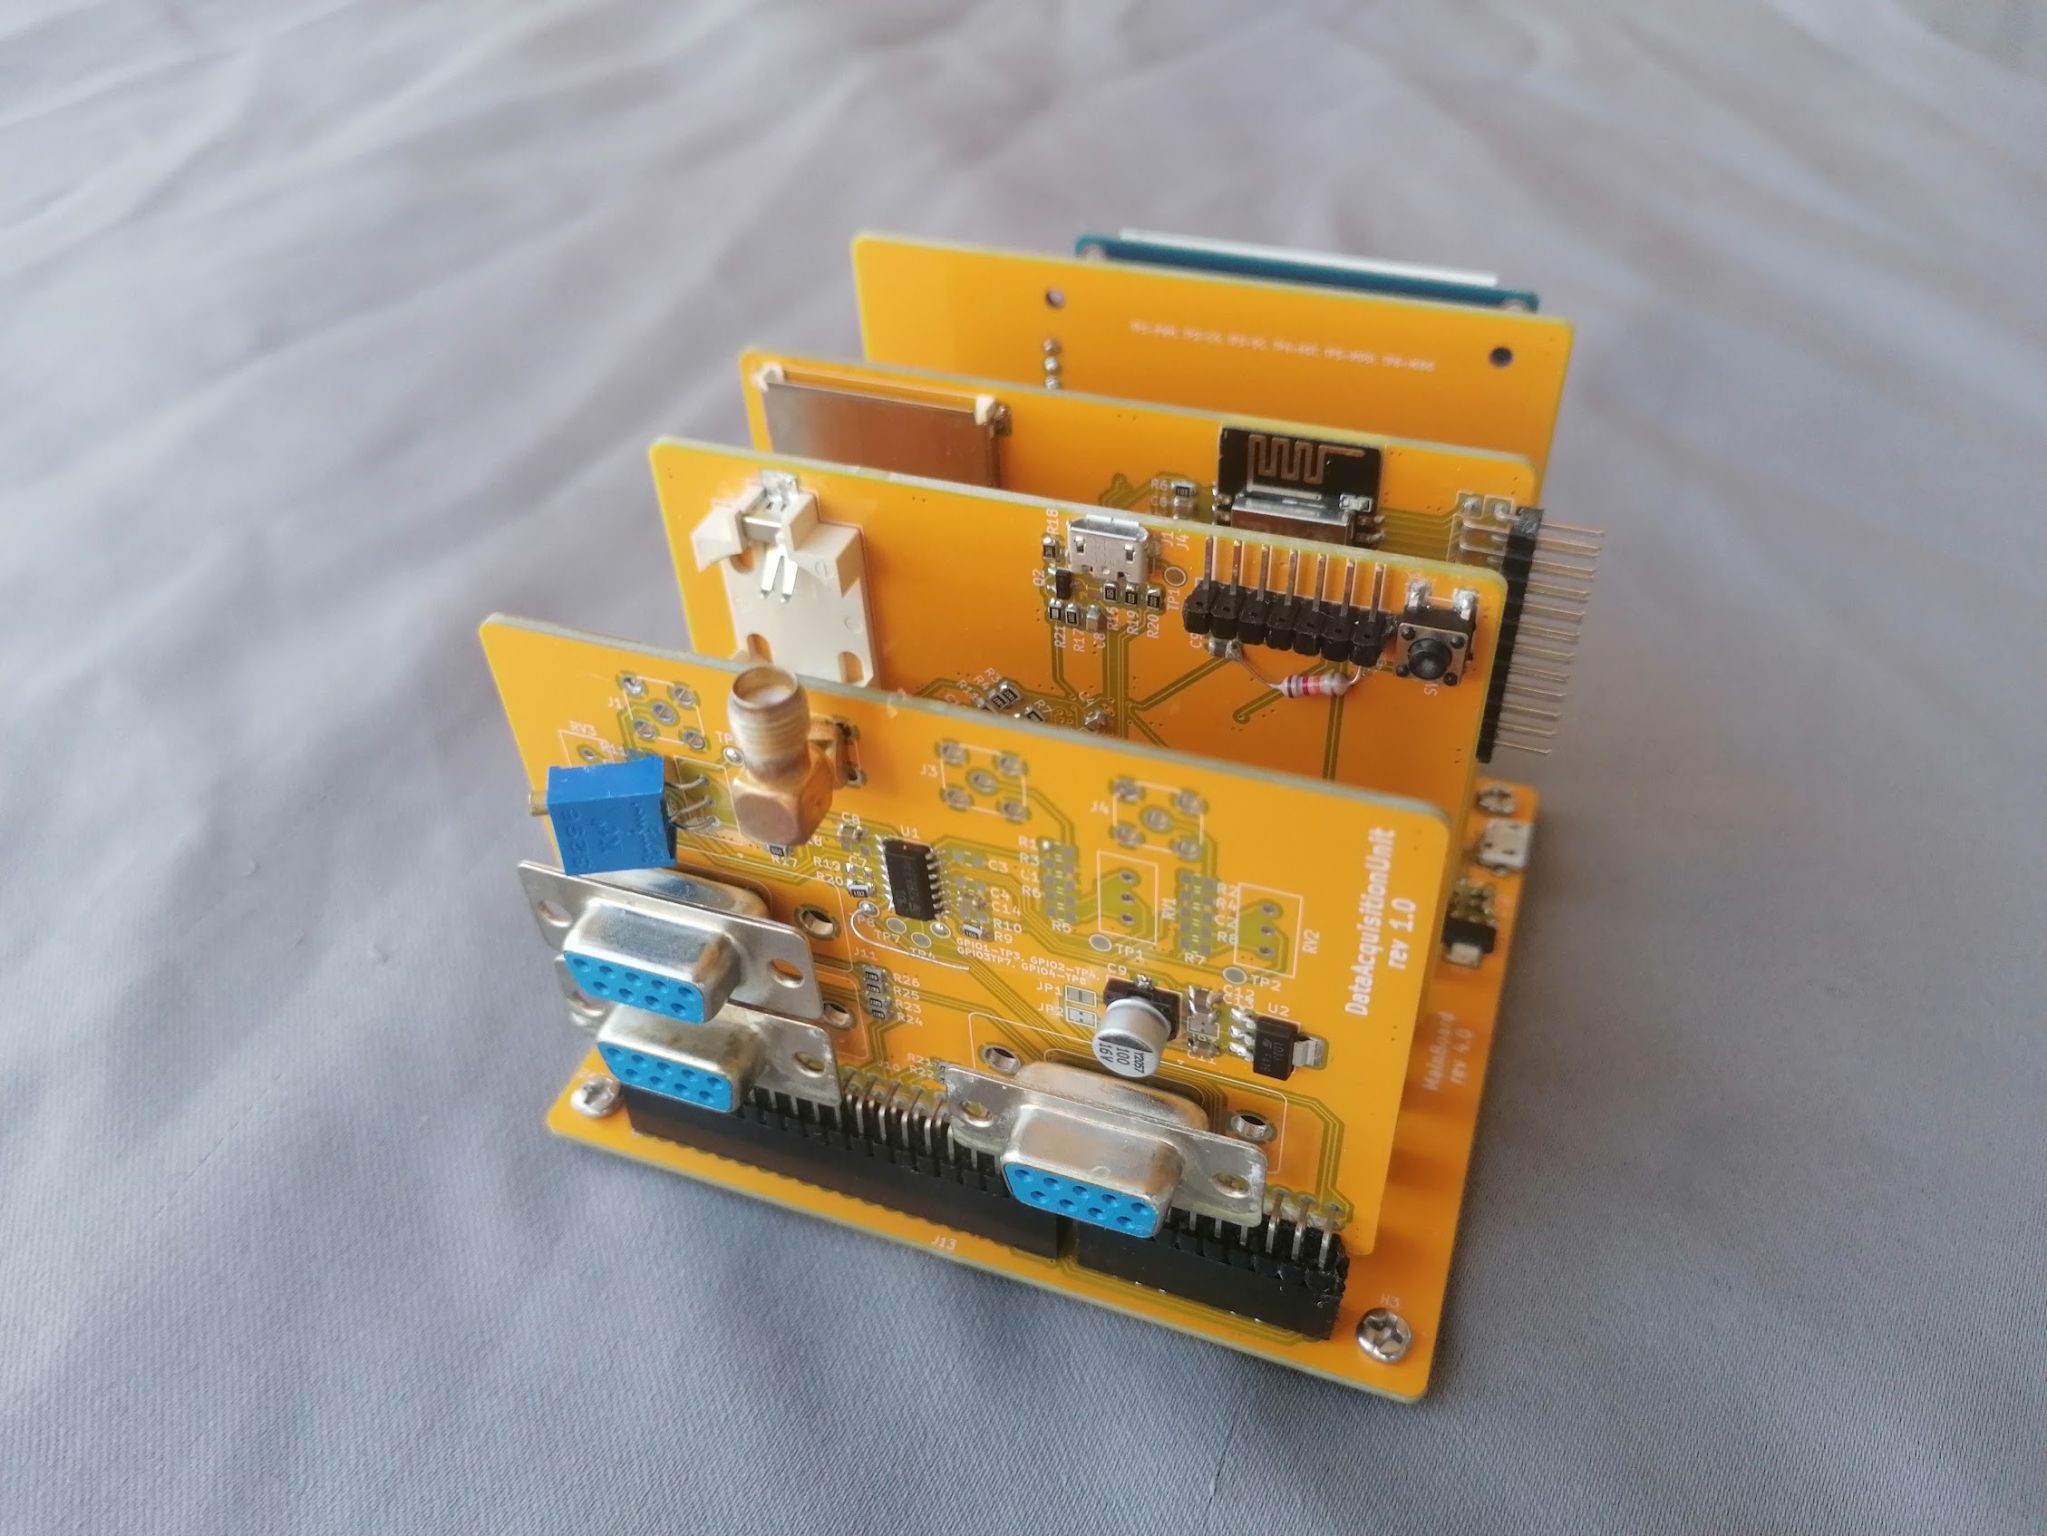
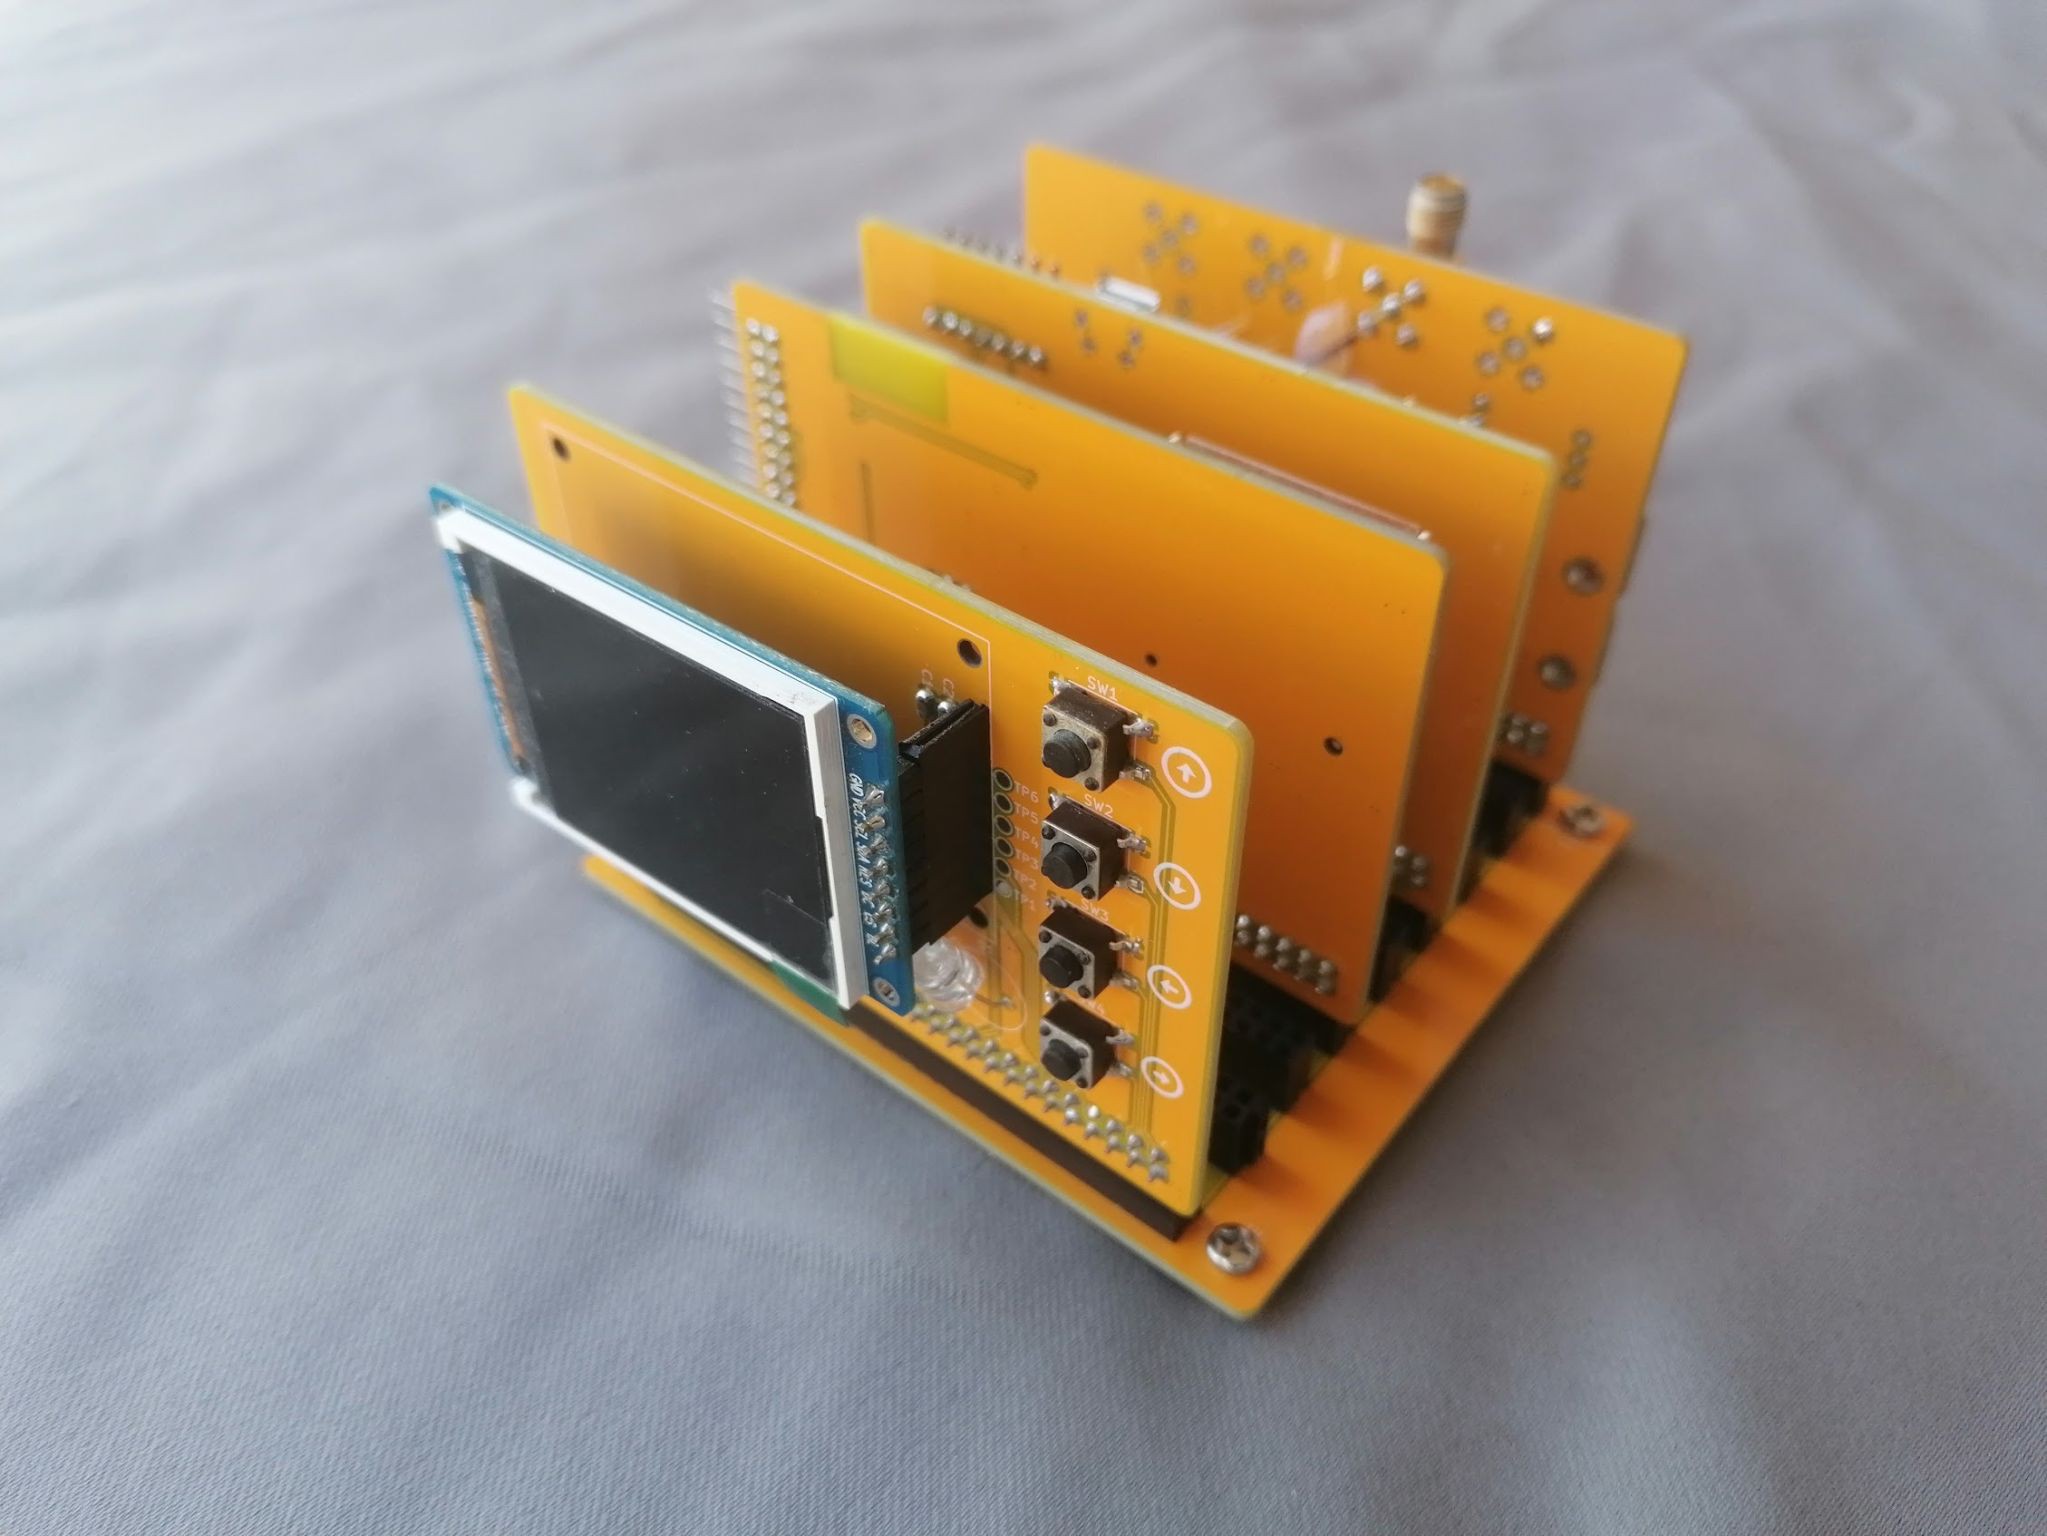
The idea is to have a mainboard with parallel slots where cards can be placed. These cards can serve various purposes, such as including microcontrollers, sensors, storage, or other functionalities as needed.
Mainboard serves as a base to dispatch all the signals to other boards; currently, there are:
- A card for data processing with an STM32F103RBTx chip [circuit].
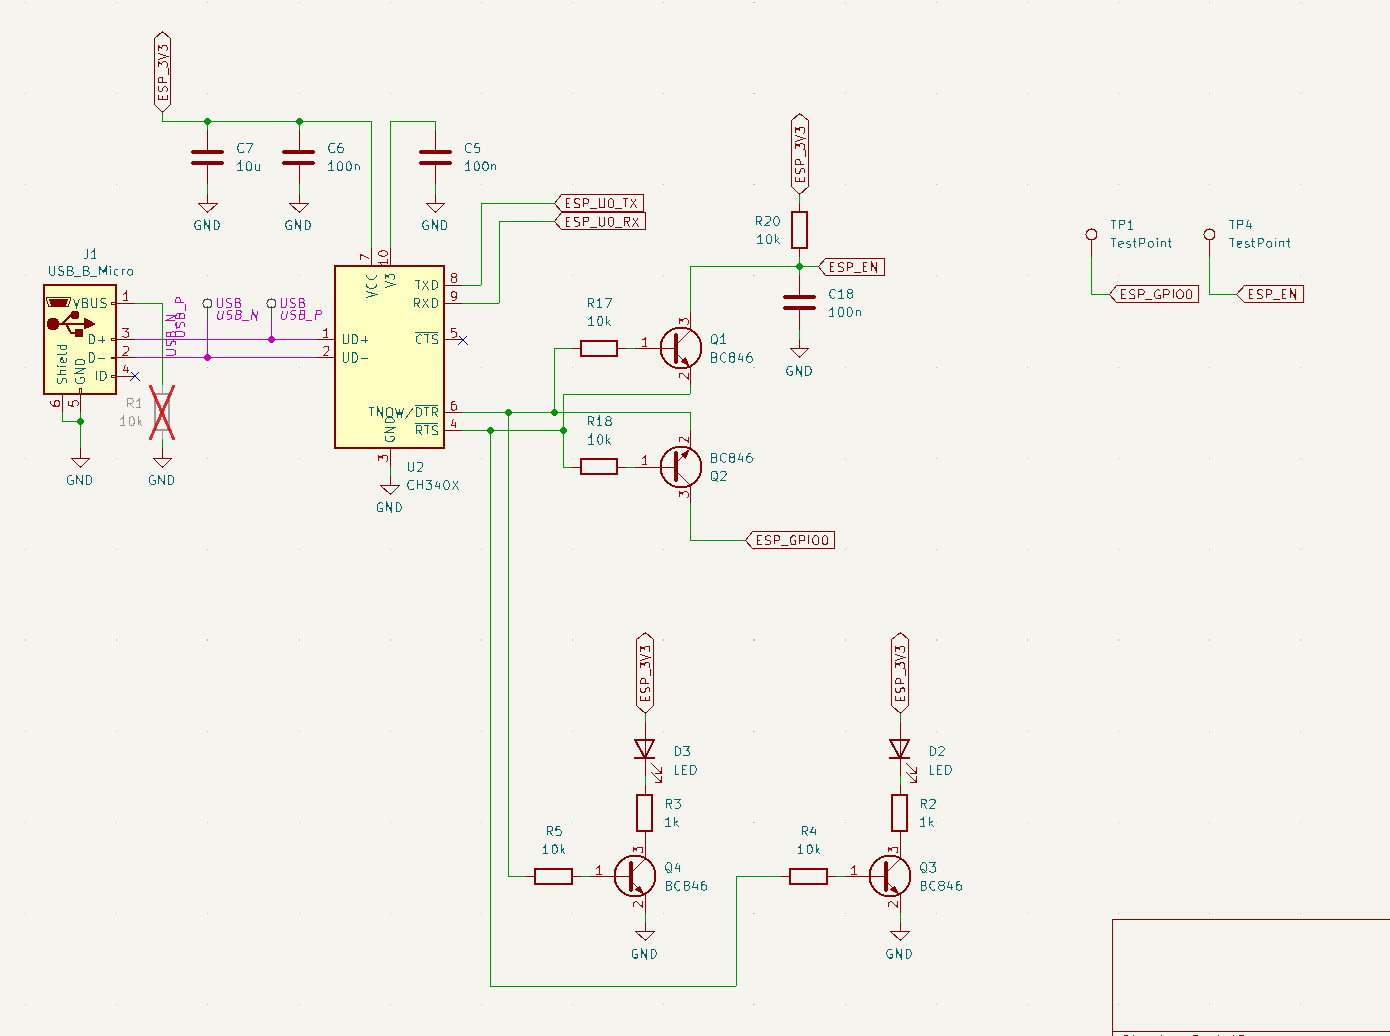
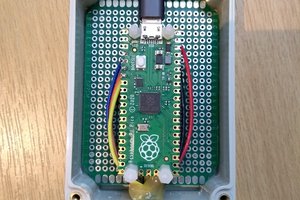
- A module for storing data on an SD card and transferring it via WiFi (ESP32-WROOM-32E) to other devices, such as a Raspberry Pi [circuit].
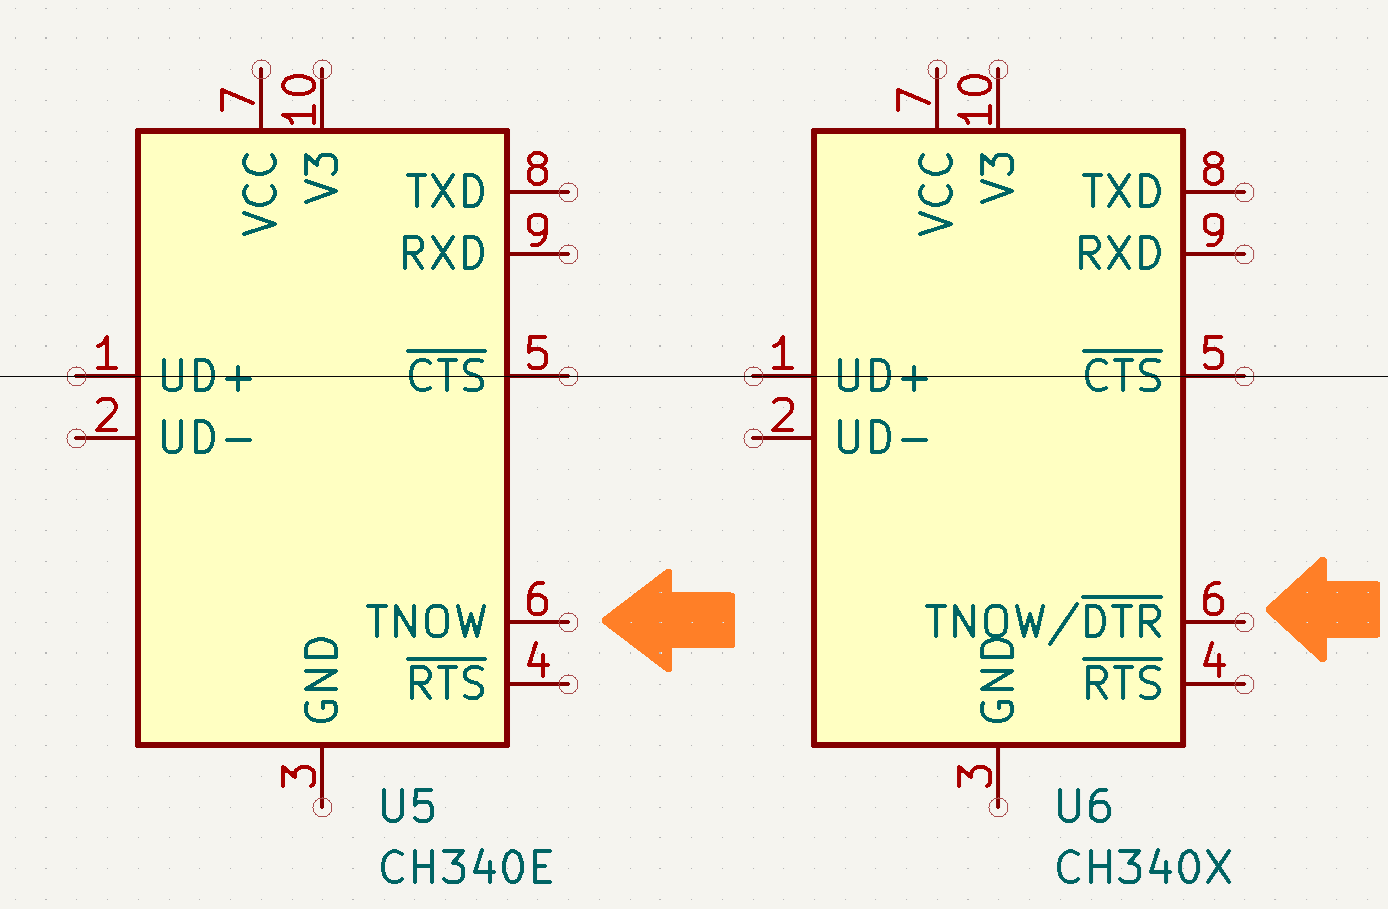
- An acquisition card with four pulse counter inputs and three UART sockets [circuit].
- A user communication module with an LCD and four push buttons; the LCD adjusts its brightness based on ambient light [circuit].
On the mainboard, slots are available for almost all of the STM32F103RBTx pins (GPIO, I2C, SPI, CAN, etc.), so it is easy and possible to use them when developing new cards.
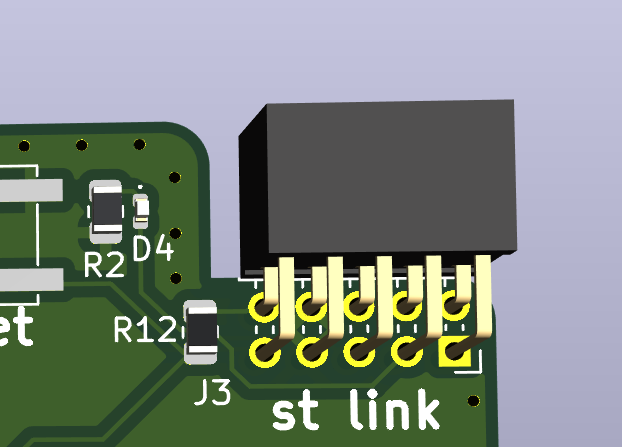
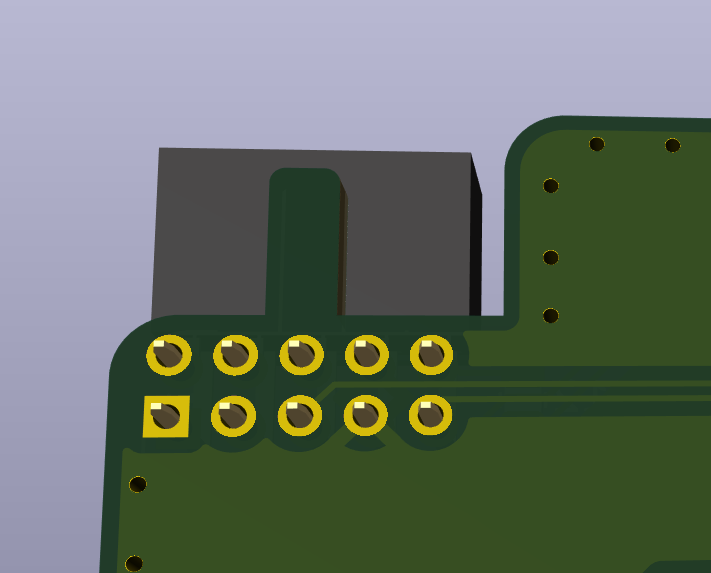
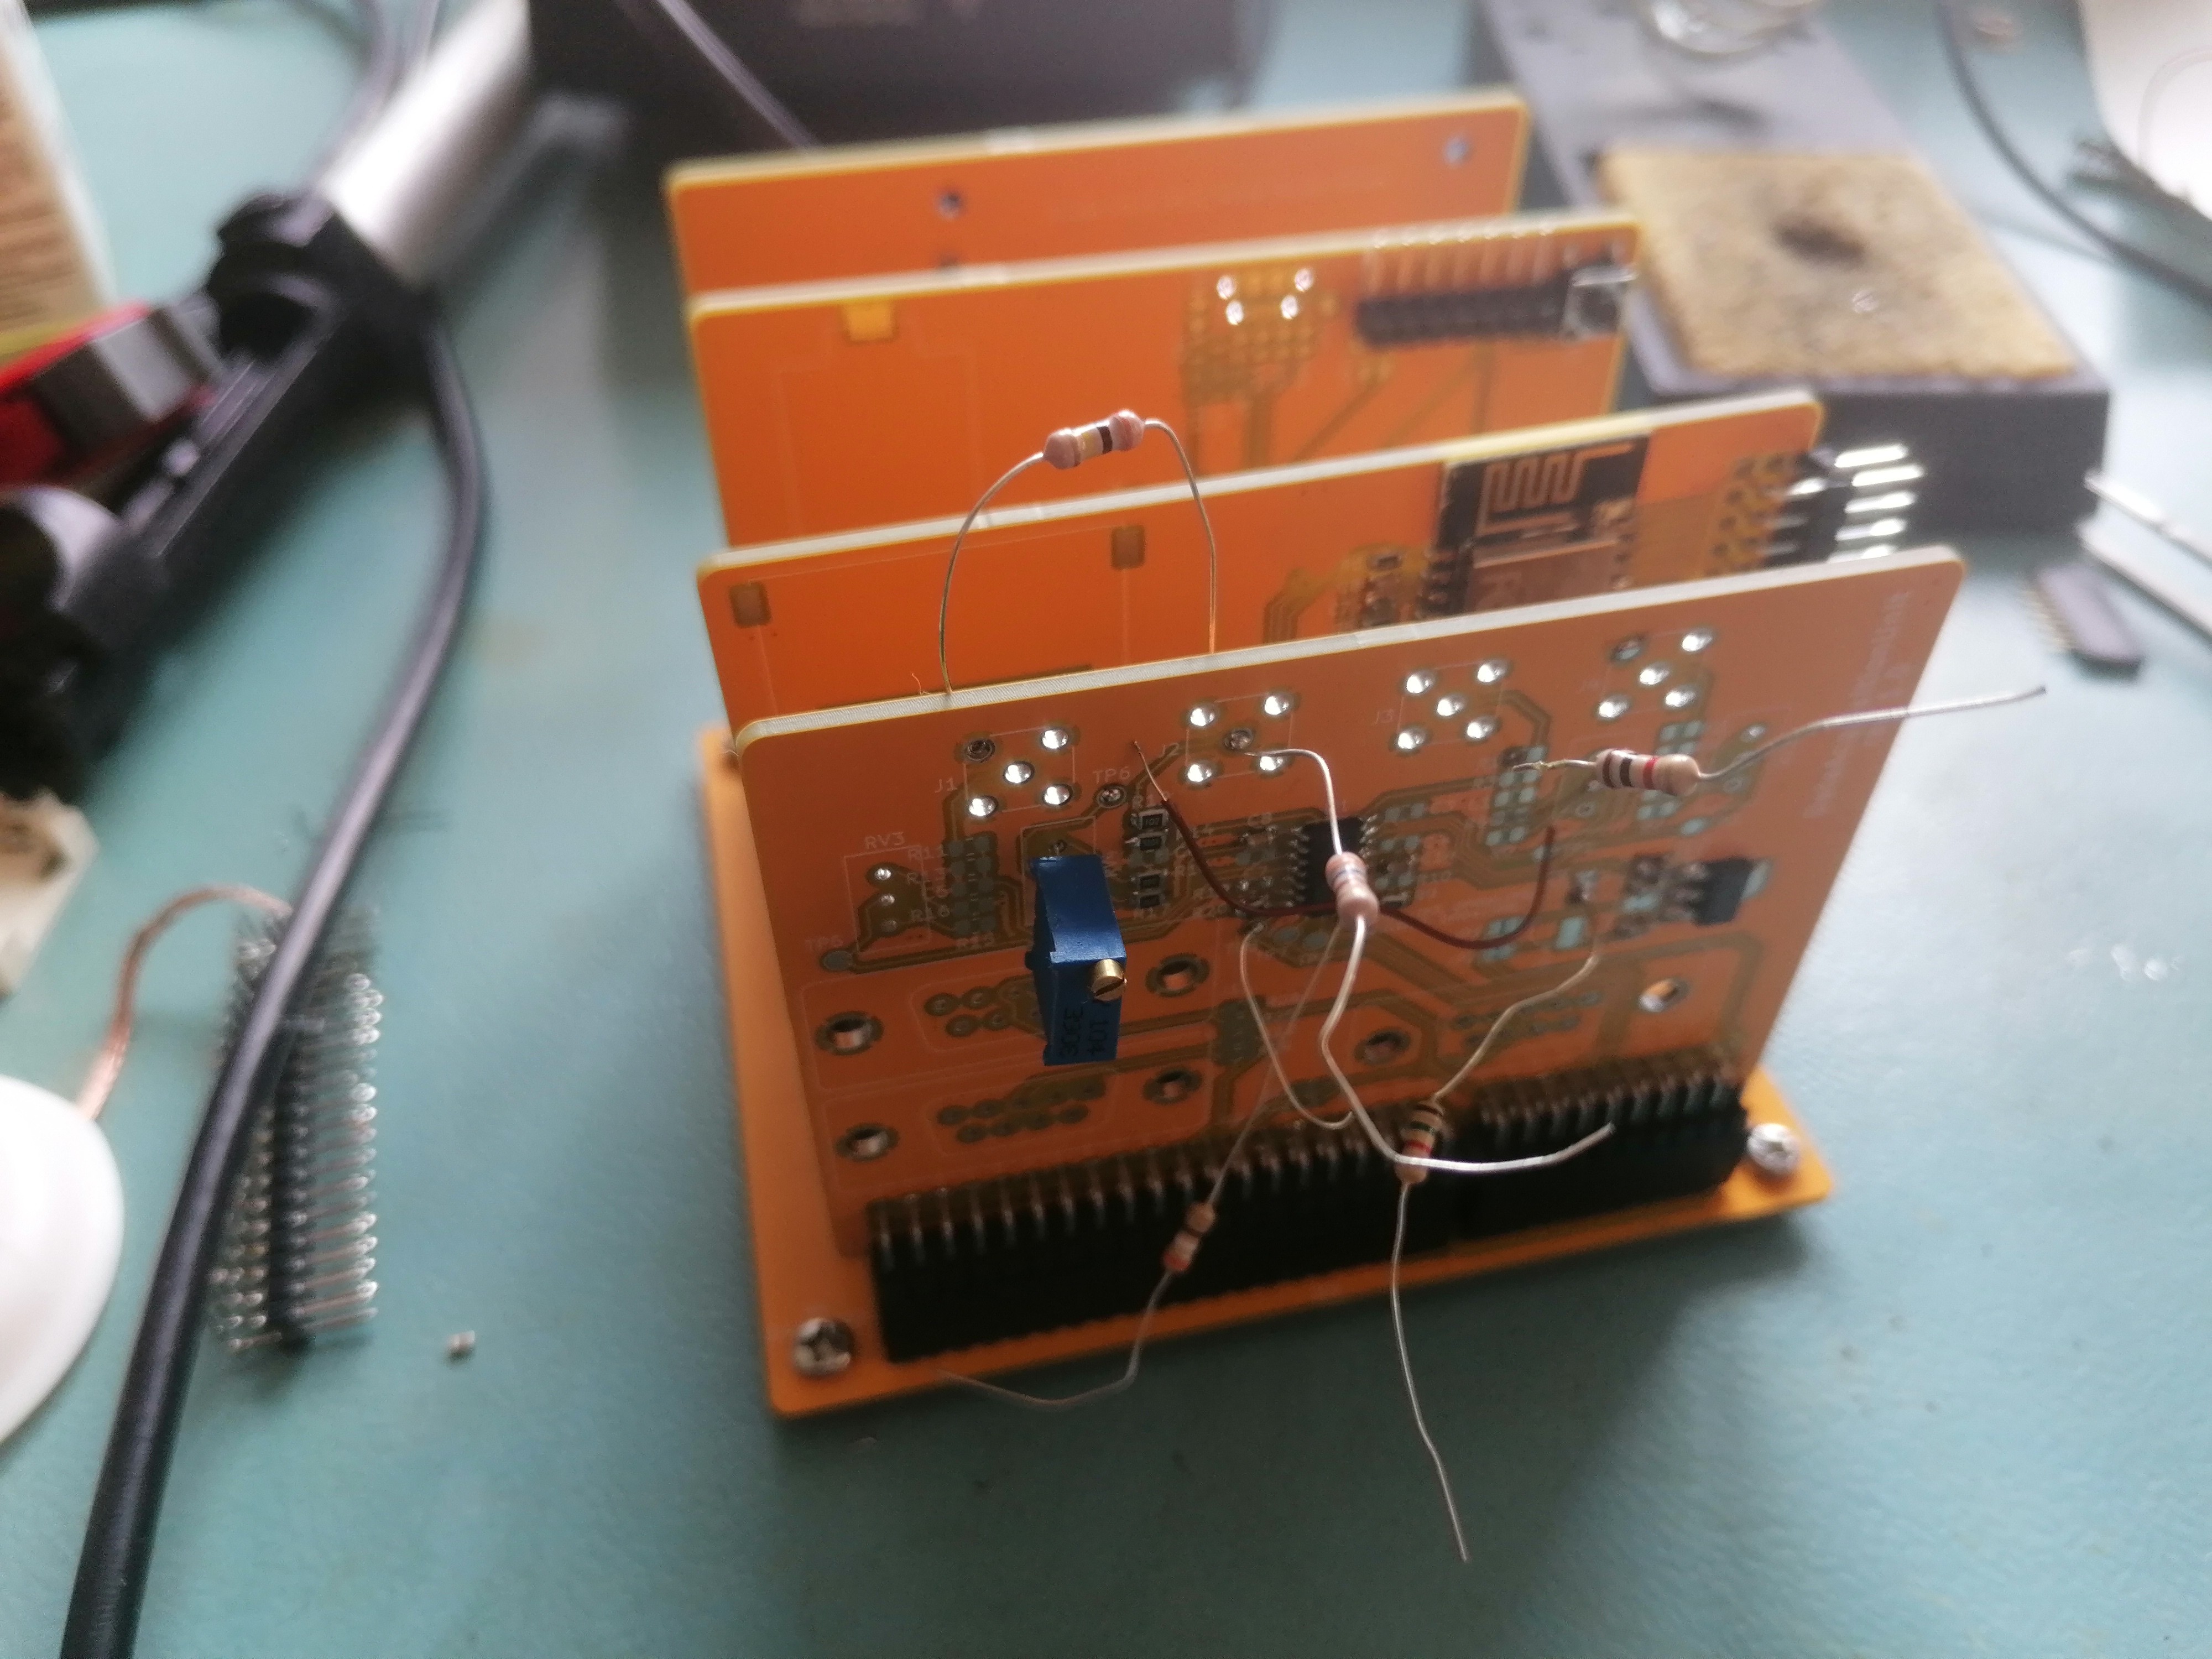
PCB production is so cheap nowadays that I think there's no point in etching at home, but the device is simple and the first versions were made on a breadboard.
All PCBs were done in KiCad.
Software
STM32F103RBTx
TThe main microcontroller, handling data acquisition, processing, storage, and user interaction.
- Toolchain: C++23, C, STM32 VS Code Extension, CMake, Ninja.
- More info.
ESP32-WROOM-32E
Used for data transfer via WiFi and will support FOTA (Firmware Over-The-Air) in the future.
- Toolchain: Rust.
- More info.
DevOps
It's good to let the machine handle the tedious work of checking code quality, freeing up more time for the useful and interesting parts of software development.
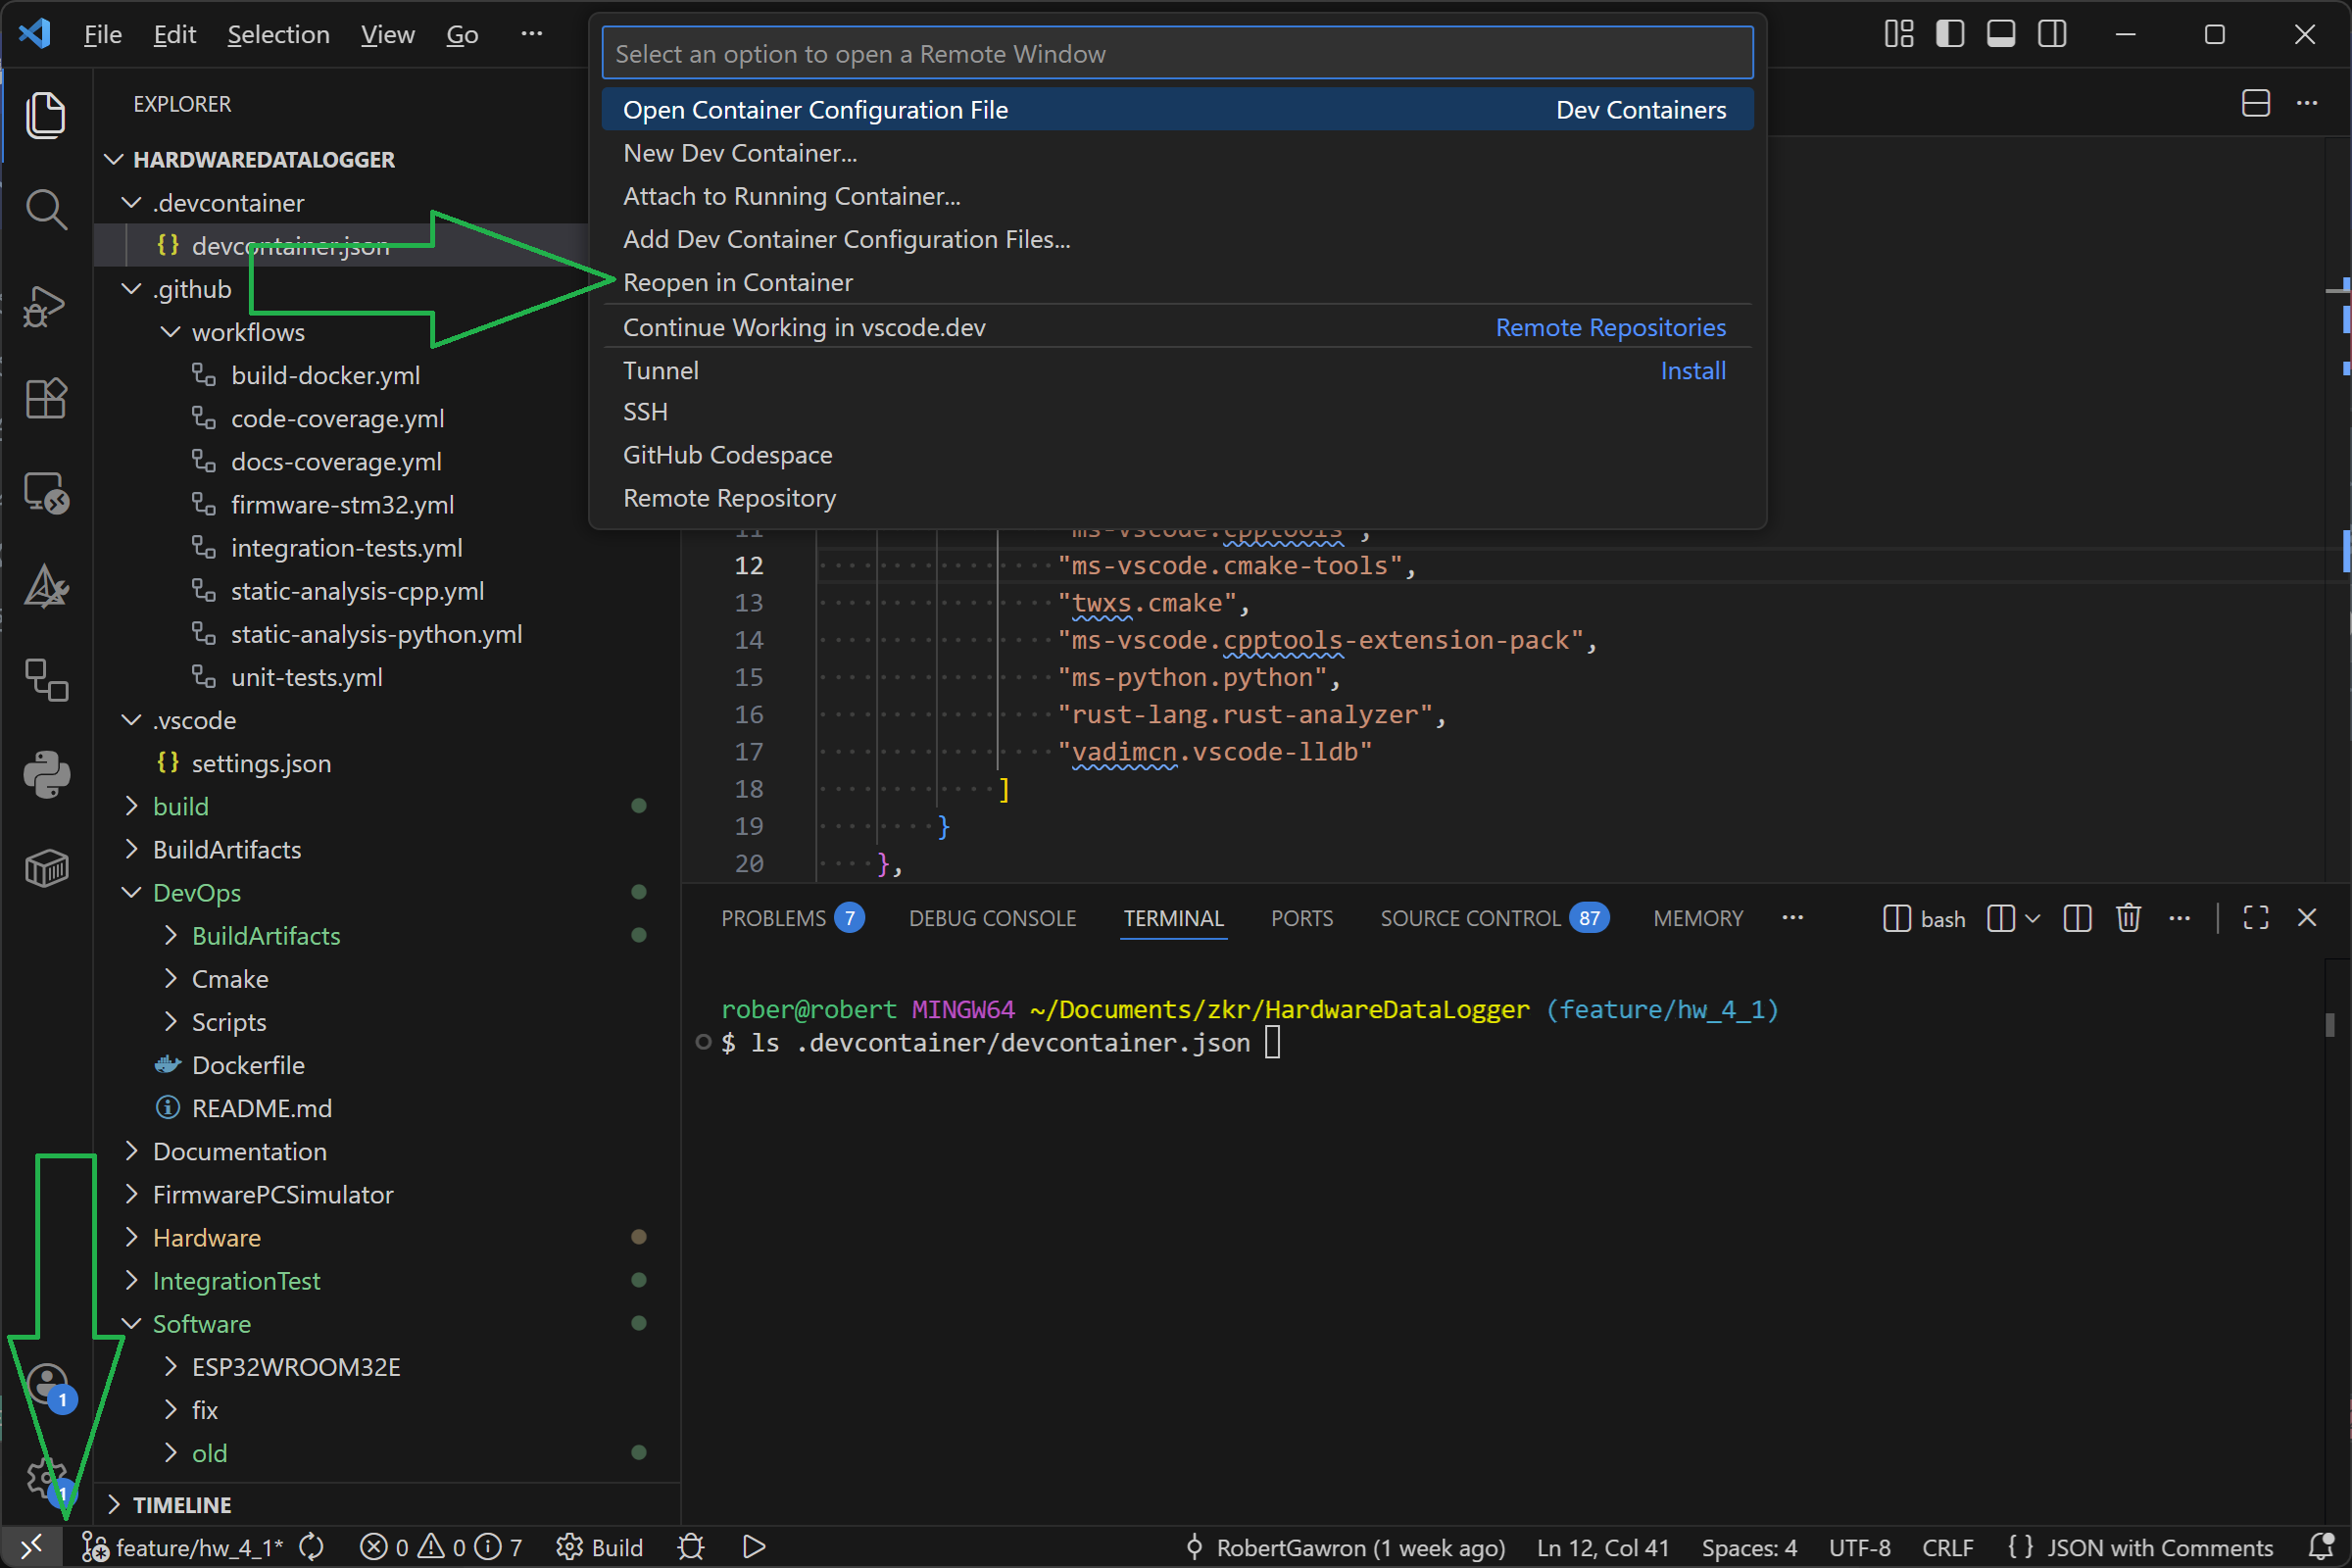
- Toolchain: Unit tests (Google Test, Google Mock), code coverage (LCOV), static code analysis (Cppcheck), Docker (for both local development and CI), GitHub Actions (CI).
- More Info
Simulation
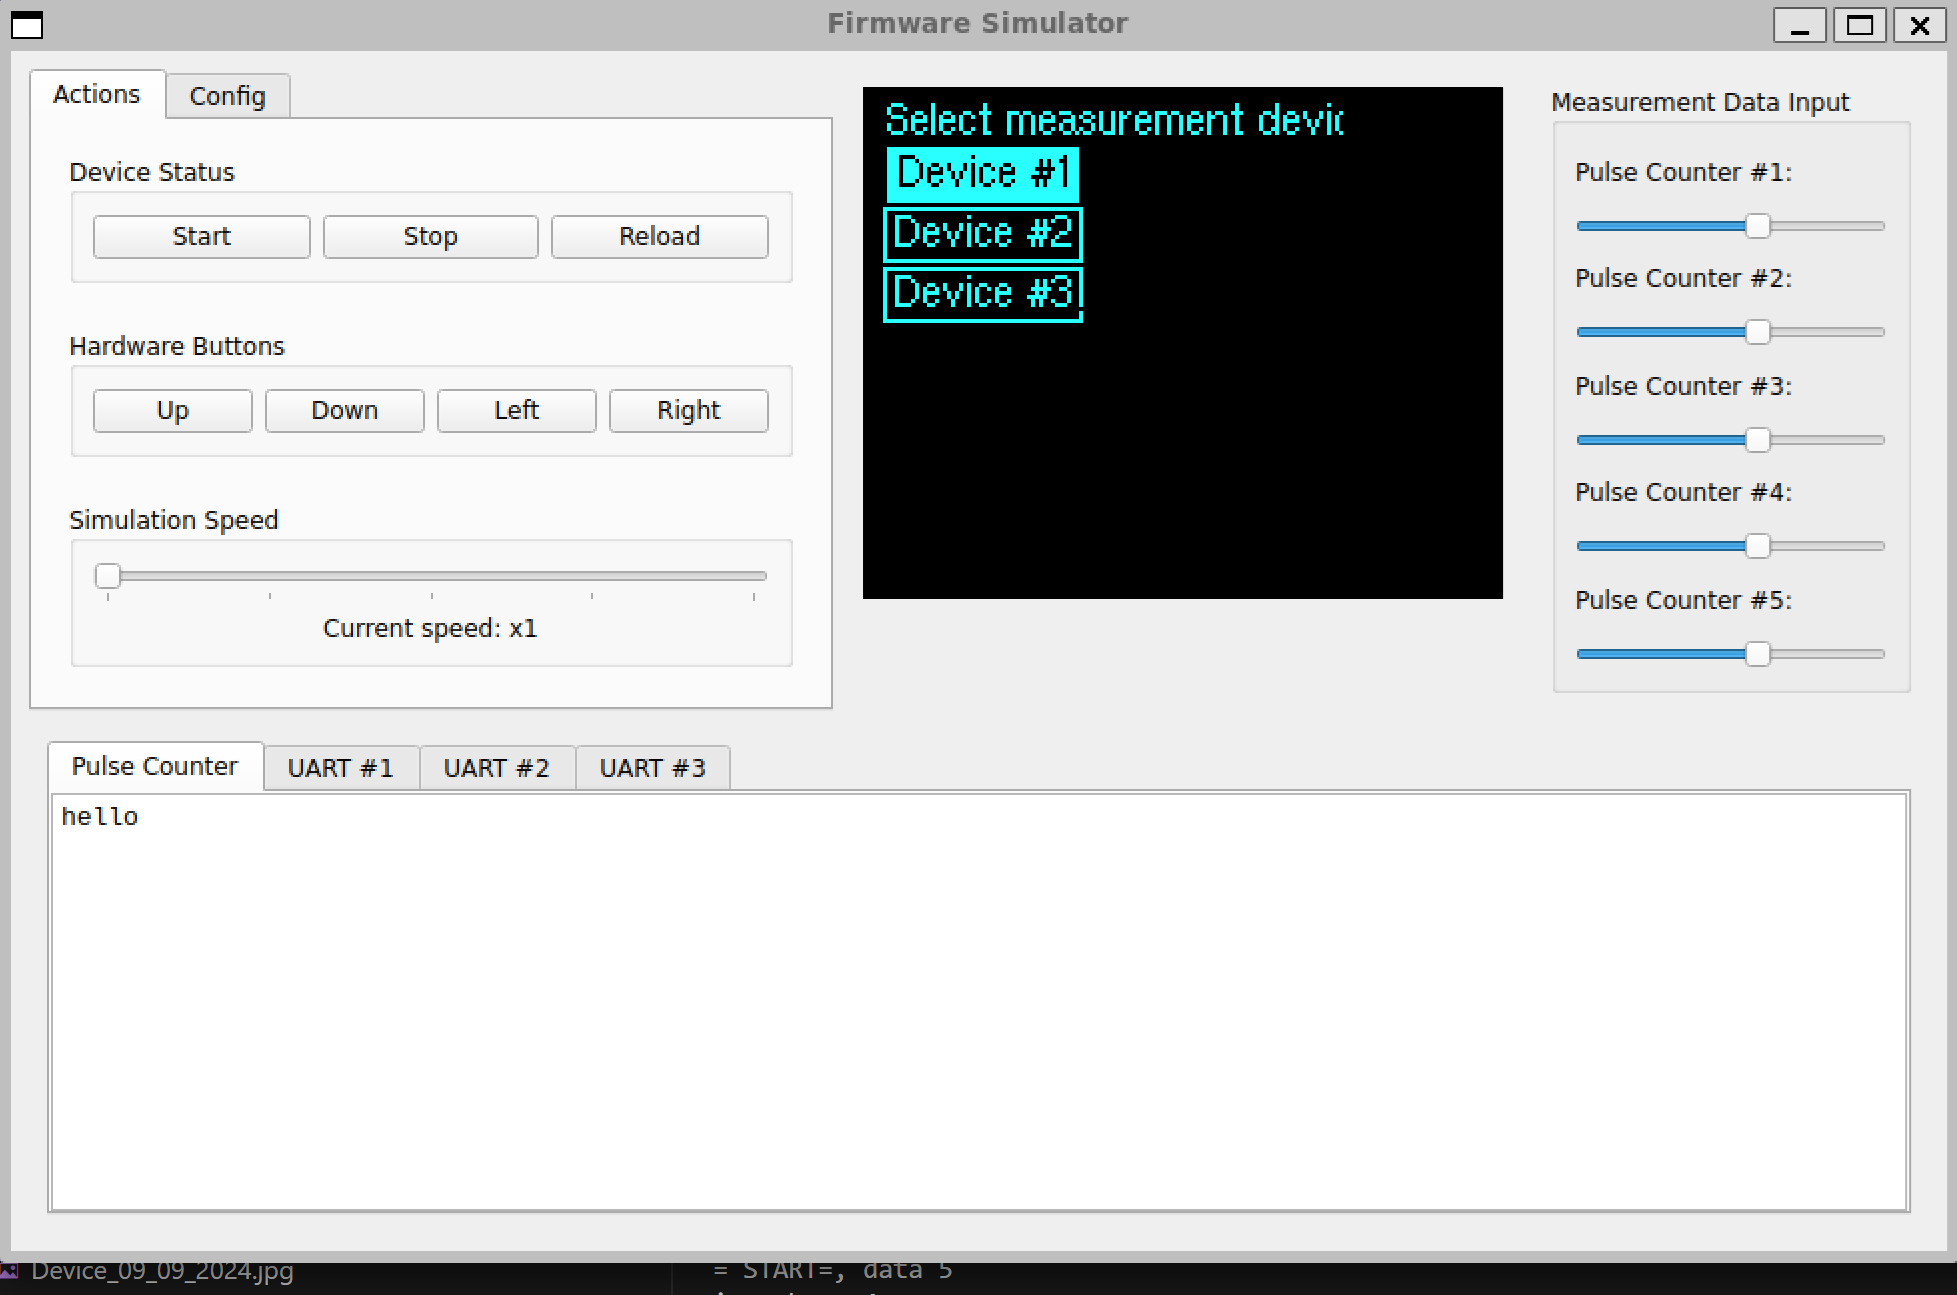
Embedded development is cool, but constantly flashing the target device for software logic, like the user interface, is time-consuming and frustrating. To make it easier, I made a simulation tool that runs the firmware directly on a PC. This allows all high-level logic- such as what’s displayed on the LCD, what data is sent via UART or saved to the SD card, user interaction via buttons, and data parsing-to be tested without needing the actual hardware.
While this simulation handles the firmware, speed of execution isn't a concern since it focuses solely on high-level logic. For hardware or driver-related issues, traditional methods like using an oscilloscope or logic analyzer are still necessary, as the simulation cannot be used.
- Toolchain: pyqt6, cmake.
- More info.
Below is a screenshot from the simulation.
System Tests
Unit tests are good (they are used in this project as well, along with code coverage), but they don't test the software as a whole. This is especially important here where there are multiple nodes (STM32, ESP8266, remote host). To fill this gap, fully automated integration tests were added.
- Toolchain: pytest, cmake.
- More info.
Documentation
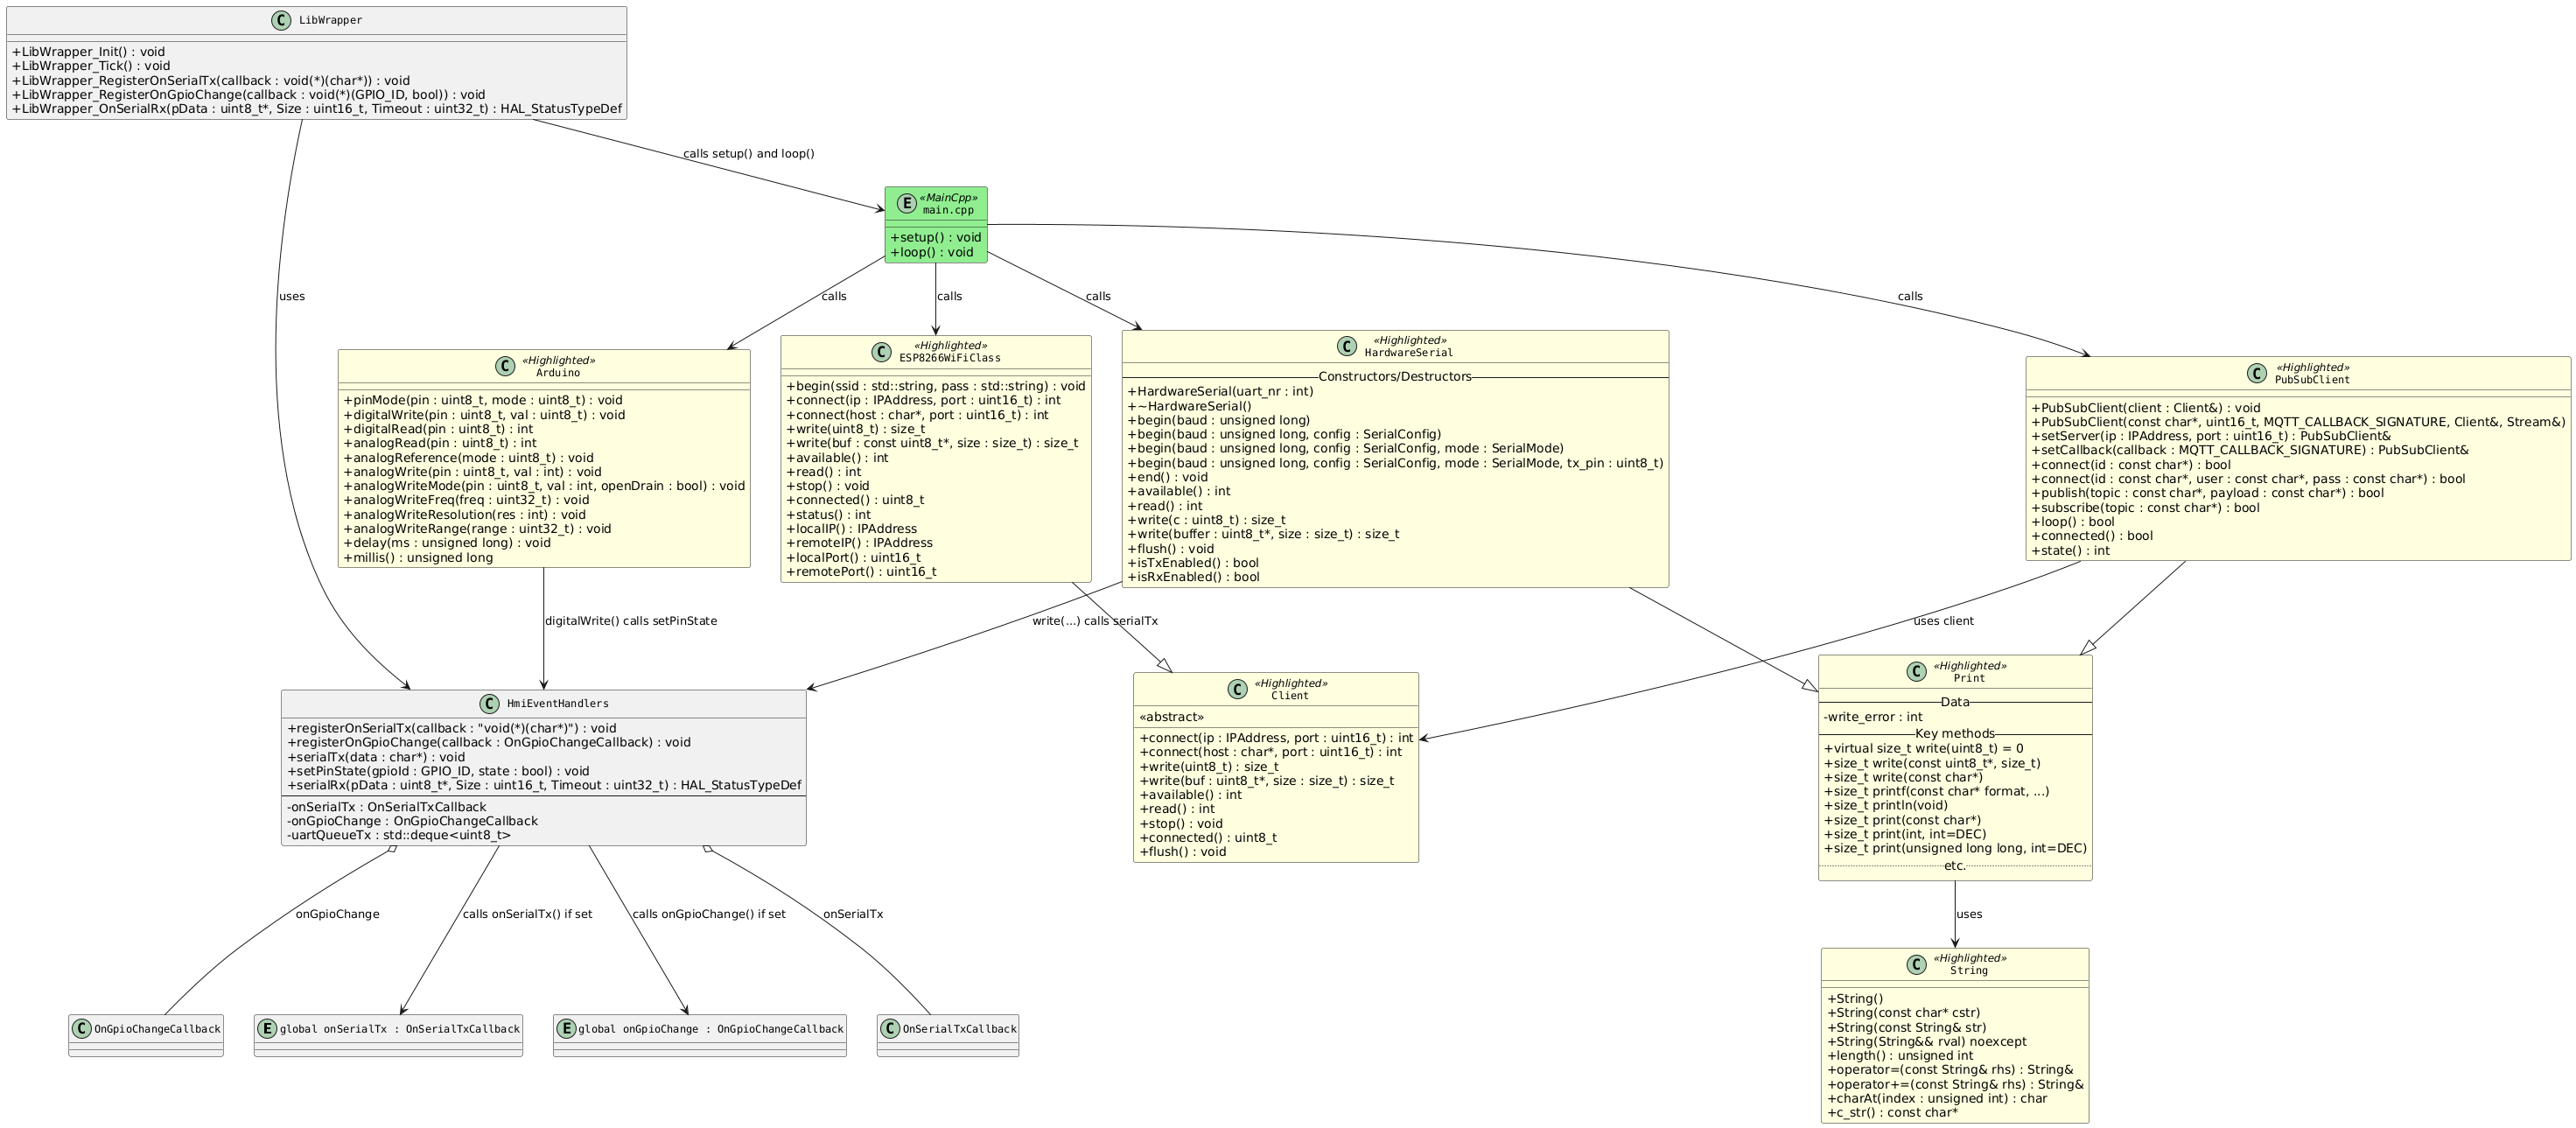
UML diagrams were made using PlantUML.
 Nick
Nick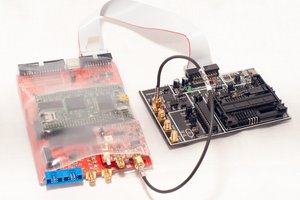
 Colin O'Flynn
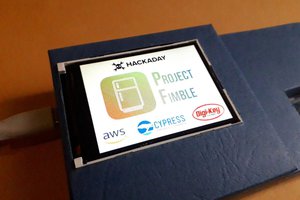
 zst123
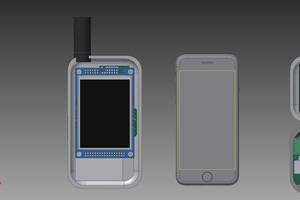
 John Grant
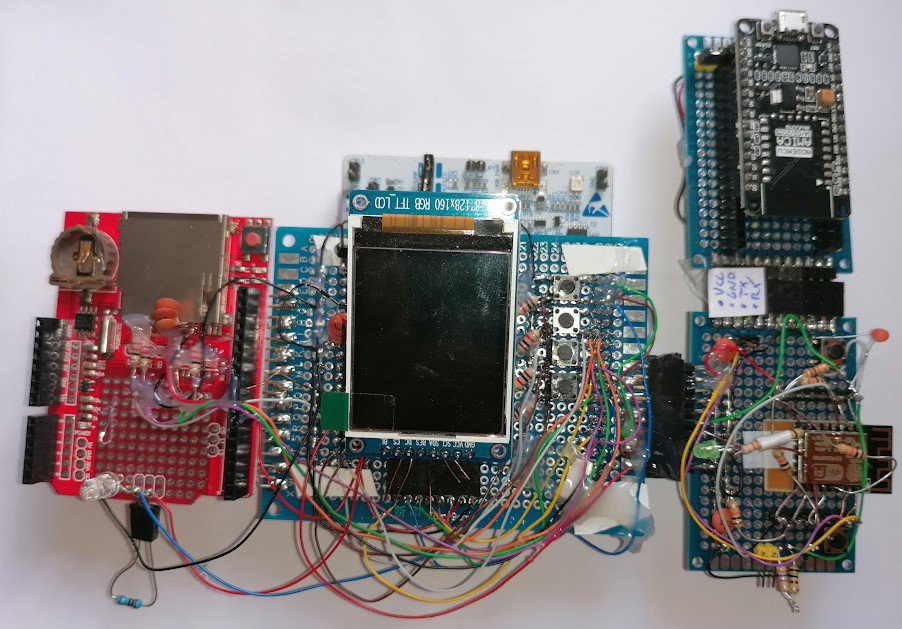