 Robert Gawron
I've been setting up Grafana to run it on a Raspberry Pi in the future, and it's an amazing tool. If you have ESP modules sending data to your Pi, you should definitely try it. The best part is there's no need for custom software - just some configuration (well, actually, a lot of configuration!).
I came up with this idea (a modified diagram from a previous post):
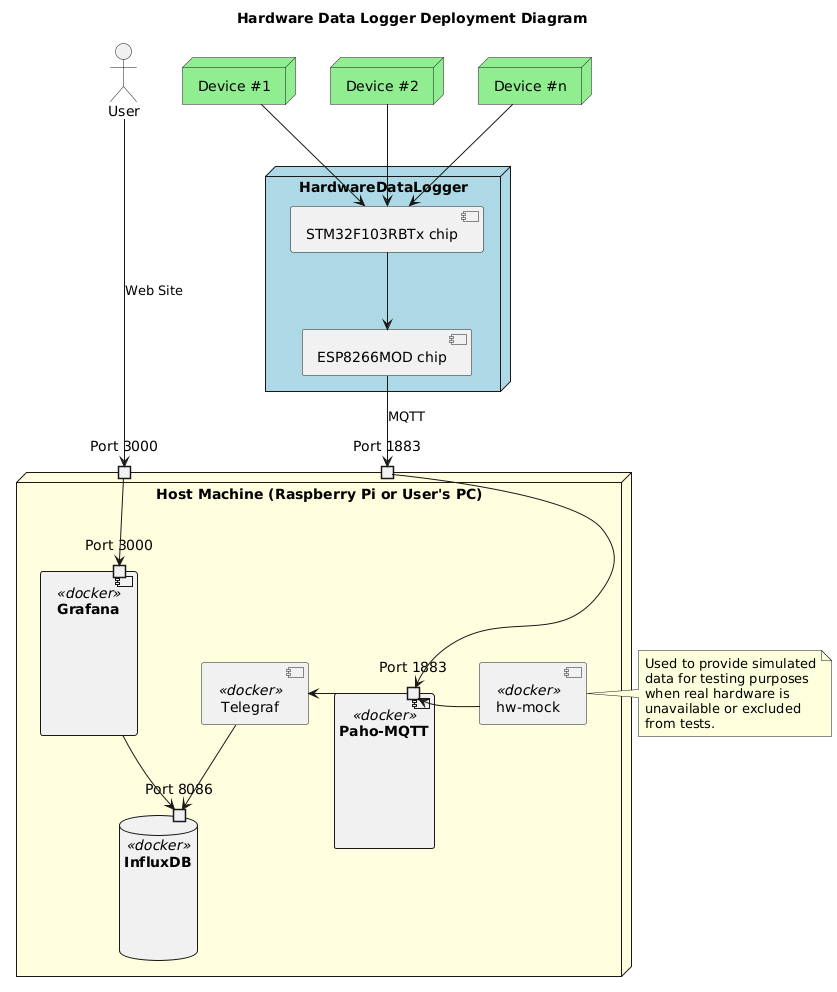
All the components running on the Raspberry Pi are pre-existing Docker images, managed via Docker Compose. Configuration is centralized in a single file. For example:
influxdb:
  image: influxdb:latest
  ports:
    - "8086:8086"
  volumes:
    - influxdb_config:/etc/influxdb       # Persist configuration
    - influxdb_data:/var/lib/influxdb     # Persist data
  networks:
    - app-network
This setup creates a Docker container with InfluxDB—no need to `apt-get install` all the tools. Even an older Raspberry Pi should handle these lightweight Docker images well, as they’re not resource-intensive. For now, this is running on my PC.
One issue is that data on Docker images isn’t persistent, meaning data stored directly inside them is lost after a reboot. Each container must be configured to communicate with its peers. For example, in Grafana, we need to add an authentication token to get data from InfluxDB. After a container reboot, it would be lost. Here are a few ways to handle this (there are probably more I’m not aware of):
- Use persistent volumes in Docker Compose to retain specific directories. It’s easy but doesn’t store configurations in Git, so the initial setup must be manual and isn’t tracked.
- Mount configuration files and directories outside the container and track them in Git. This works but isn’t ideal for sensitive data like tokens, as it’s not good to save them in Git
- Store configurations in a private Git repo, adding complexity
- Automate everything with Ansible, but that’s a lot more work.
I chose the first option, which works well enough. I’ve documented the setup in a README.md, it’s detailed but as usual I probably missed half the details . :)
Another challenge was testing without actual measurement data, as the firmware for my ESP isn’t ready. To simulate data, I created a simple Linux-based Docker image running a Python script to send fake data to MQTT. It works!
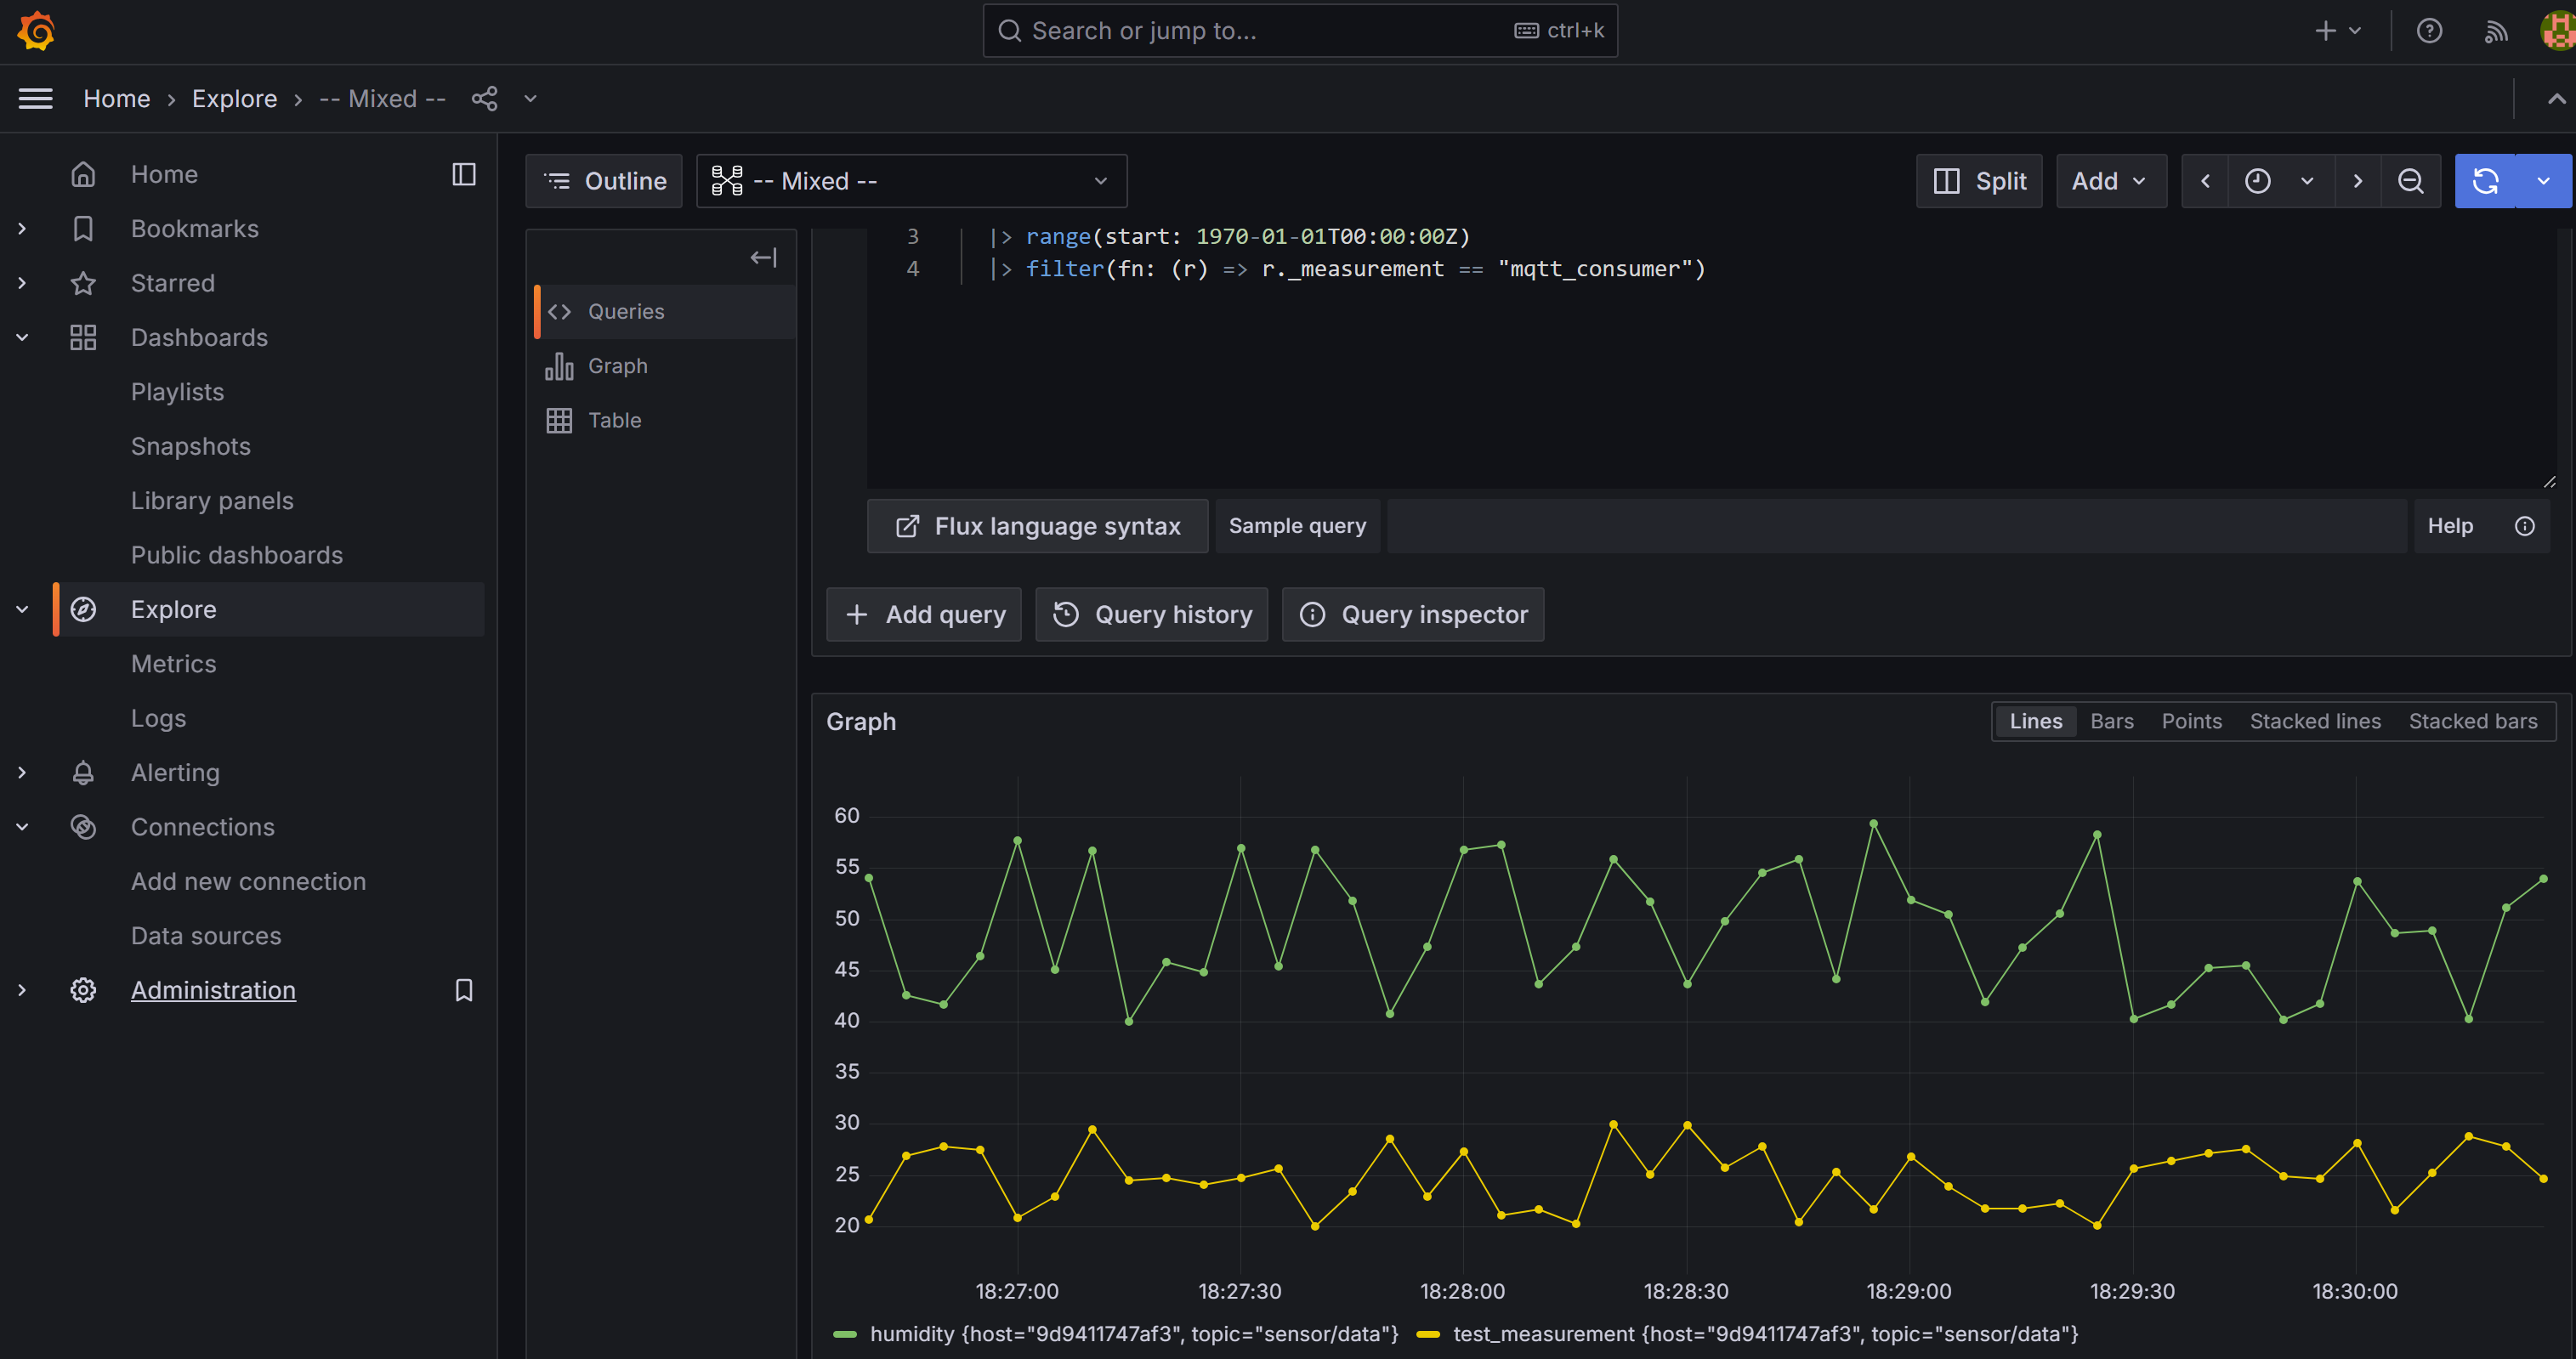
Here’s the final version (with fake data) of the Grafana page showing measurements. By the way, I really love Grafana’s graphical interface and how polished the graphs look:
Note that this is not all. I’ll need Buildx to create Docker images on my PC that I can then deploy to the Raspberry Pi. I can’t use the image I’m running on my PC since it has a different architecture than the Raspberry Pi (x86 vs ARM).
I’ve created a new Git repo for all Raspberry Pi-based parts of this project to separate it from the hardware, which will remain in its original repo.
Discussions
Become a Hackaday.io Member
Create an account to leave a comment. Already have an account? Log In.