 Robert Gawron
I have been working on the firmware and simulation, and it’s starting to look good. Below, I’ve made a short video. Here’s what you can see in the video (note: there is no sound):
- In the simulator, the slidebars on the right simulate data from external pulse devices (for me, it’s my Semiconductor Radioactivity Detector and Geiger Counter - both featured on Hackaday, feel free to check them out if you’re interested).
- On the screen (which emulates a real LCD screen), you can see a layout based on the MUI and U8G2 libraries displaying data from the simulated pulse counter. The numeric value corresponds to what is set on the slidebar on the right. Strictly speaking, it shouldn’t work this way—the device should wait, e.g., 60 seconds, then read data from the pulse counter driver (or the simulated driver in this case) and update the screen. But that’s a minor detail.
- Just for fun, I’ve added a small feature to the simulation that visualizes changes over time for all the simulated pulse counter data. This part is visible at the end of the video.
While I will continue to work on improving it, I also have some other cool ideas. The device is equipped with an ESP8266MOD, which is used alongside the STM32F103RBTx to send data via Wi-Fi to a remote host (I plan to use a Raspberry Pi). In short, I want to use Docker, InfluxDB, and Grafana to create web-based diagrams accessible from my local PC. The architecture is shown below:
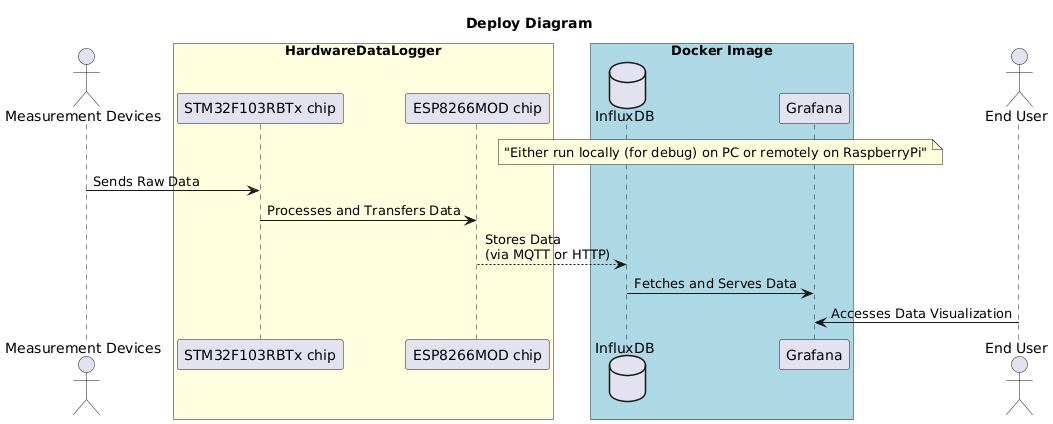
I was thinking that I could extend my simulation tool to also run the firmware for the ESP8266MOD and tunnel communication between the STM32F103RBTx -> ESP8266MOD -> Docker image running InfluxDB and Grafana. This is just a concept for now, and I plan to investigate it further.
Discussions
Become a Hackaday.io Member
Create an account to leave a comment. Already have an account? Log In.