 marble
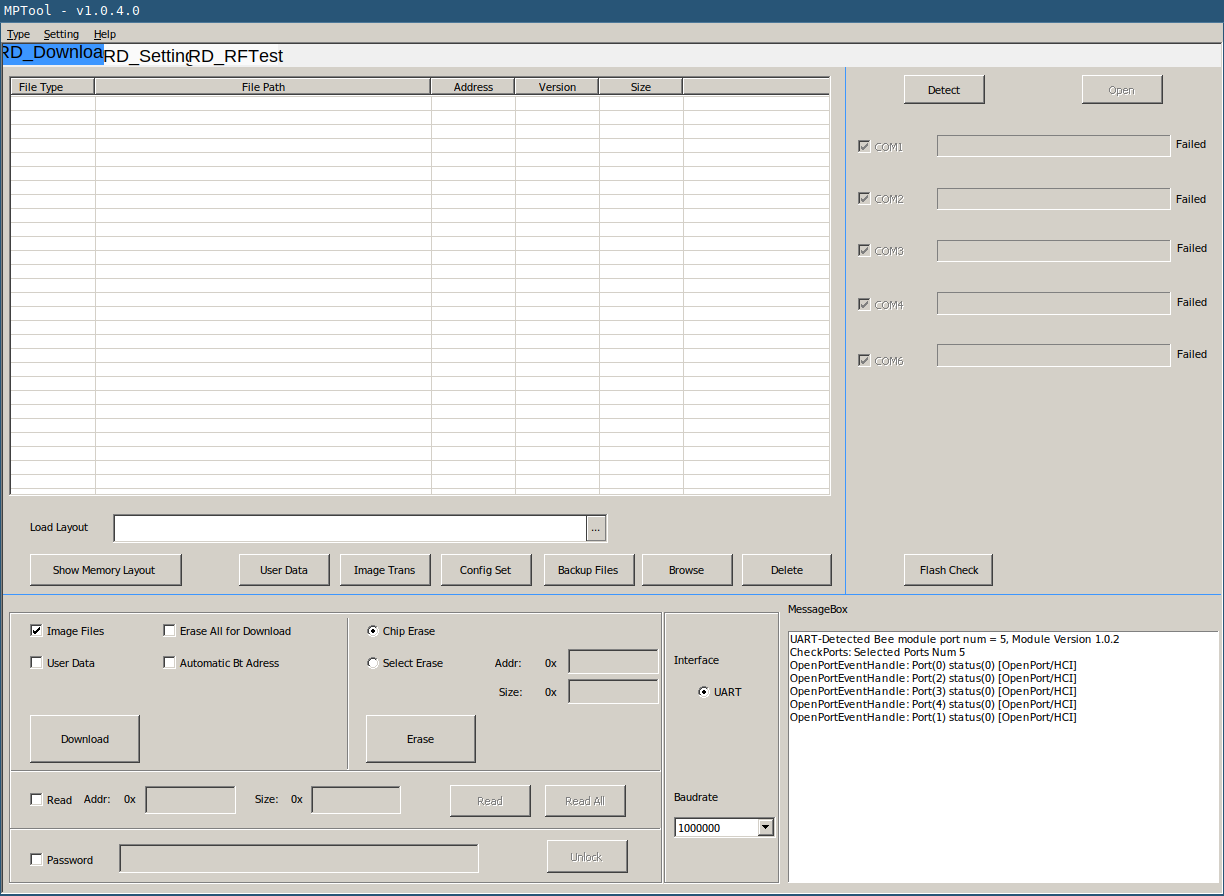
After finding a repository with software utilities for this chip, I tried to use the MPTool, which after first inspections seems to provide flash read, erase and write functionalities. When clicking the Detect button it lists all available COM ports and enables the Open button. When clicking this, all ports returned fail.
On the smart watch I found five labeled test points - GND, RX, TX, RST and LOG. To make everything more accessible I opened and unfolded the smart watch into a perf board. The PCB is held in place by tiny screws through it's original mounting holes, which land in holes of the perf board. The test points are connected with small solid core wires to the header on the top left.
I removed the sticker antenna from the watch housing and used a short length of wire to solder it to a test point that is opposite to the spring that normally makes contact with the antenna. I also used more solid core wires to give easy access to the LCD signals for probing at the bottom pin header.

The image shows an FT232 also used as logic analyzer. Due to bad performance and sample rate discrepancies I later switch to a Saleae Logic clone
Handshake
After some testing around, I found out that the LOG signal acts like as a strapping pin, similar to GPIO0 of the ESP32. If it is pulled to GND during hardware reset, one of the the COM ports report OK when clicking the Open button. This is caused by a handshake, which consist of a magic byte string that is answered by the MCU with another magic byte string.
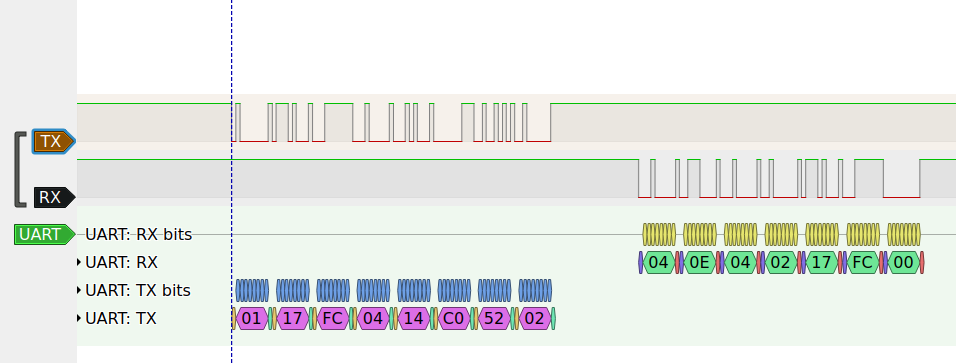
| Protocol Phase | OpCode | Parameters |
| TX: handshake request | b"\x01\x17\xFC\x04\x14\xC0\x52\x02" | None |
| RX: acknowledge handshake | b"\x04\x0E\x04\x02\x17\xFC\x00" | None |
Flasher Stub
Sadly apart from the handshake, nothing else seemed to work under wine. Trying to read flash content caused the application to freeze after transferring a bunch data, as indicated by the LEDs od the USB UART adapter. Therefore I was forced to use with a Windows VM instead of wine.
According to the Memory User Guide the flash starts at address 0x00800000. Reading the first 1kiB (0x400) the tool prints the following logs in the message box.

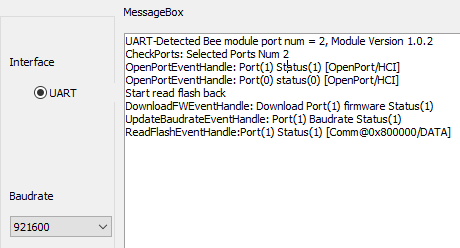
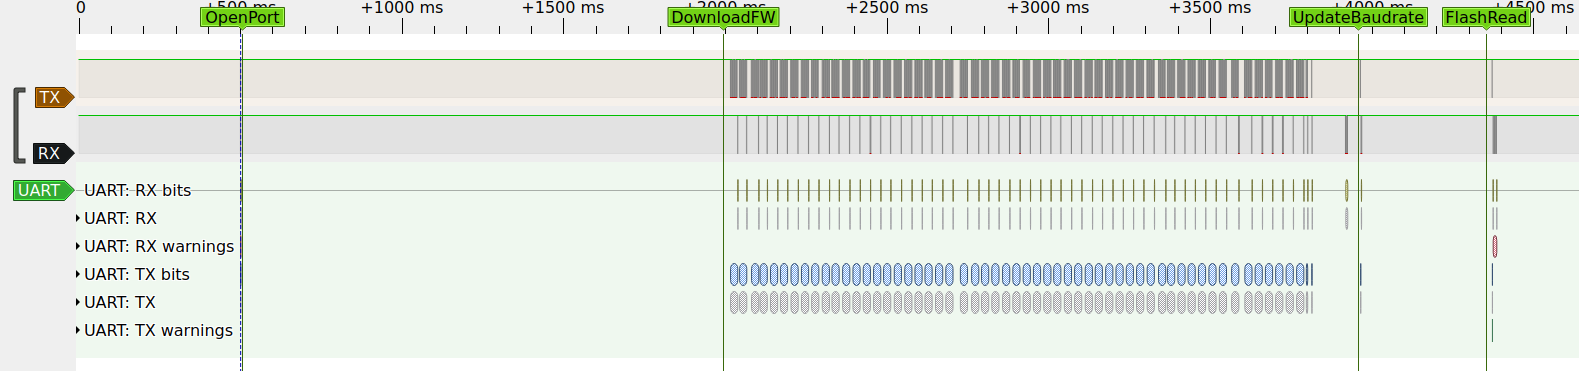
It logs four events called OpenPort, DownloadFW, UpdateBaudrate and ReadFlash. These events are clearly visible when looking at the signal
Looking through the files next to the flasher tool I found one called firware0.bin. Comparing its content with the recording, I found the section where it's transmitted. This is reminiscent of the flasher stub of esptool.
$ xxd -g 1 Bee2MPTool_kits_v1.0.4.0/Bee2MPTool/Image/firmware0.bin | head -n 2
00000000: 05 00 03 01 92 27 00 00 00 01 00 00 6d 67 de f1  .....'......mg..
00000010: 3e 33 e8 11 b1 02 4d 2d f4 0c de 01 f0 38 20 00  >3....M-.....8 .
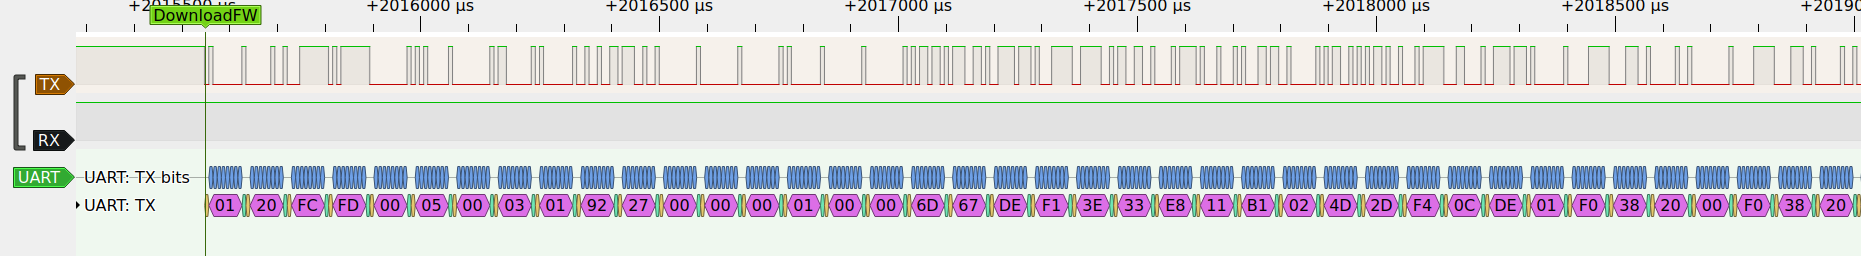
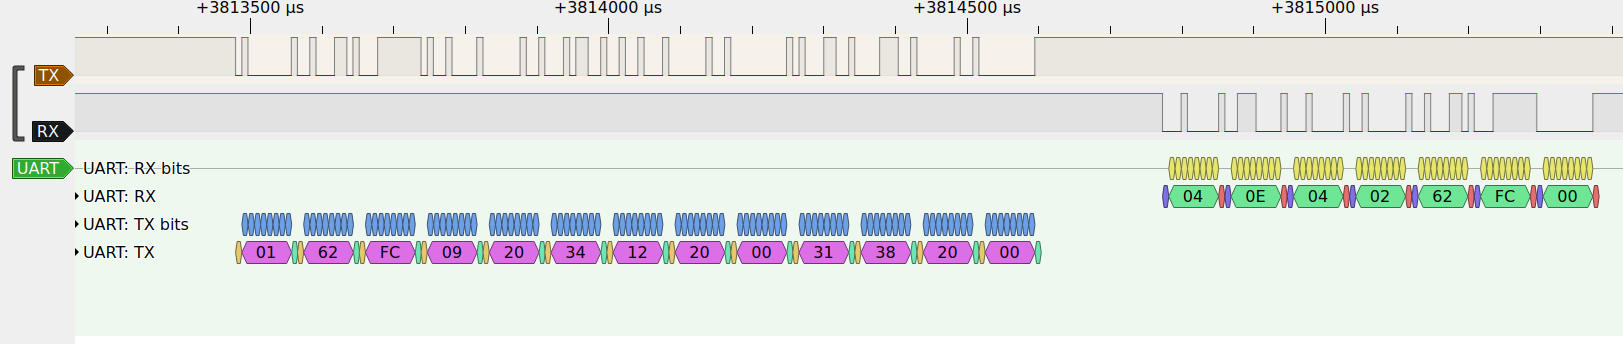
All frames but the last was are preambled with 0120FC, followed by one bytes containing the length of the rest of the frame, then one byte with the frame number, followed by up to 252 bytes of data. Every frame is acknowledged by the MCU with 040E0502FC00 followed by one byte with the frame number.
After the last frame is finished, a magic sequence is transmitted, that presumably causes the stub to run, which is acknowledged with 040E040262FC00. After ~100ms delay the MCU sends another 70 bytes, presumably containing some information about it, like version number and address ranges.
| Protocol Phase | Op/RespCode | Parameters: length |
| TX: load flasher stub frame n | b"\x01\x20\xFC" | - frame length: 1B - frame number: 1B - payload: 1..252B |
| RX: acknowledge flasher stub page n | b"\x04\x0E\x05\x02\xFC\x00" | - frame number: 1B |
| TX: magic | b"\x01\x62\xFC\x09\x20\x34\x12\x20\x00\x31\x38\x20\x00" | None |
| RX: acknowledge magic | b"\x04\x0E\x04\x02\x62\xFC\x00" | None |
| RX: system info? | b"\x87\x00\x10" | - b"\x00\x3C\x00\x00\x00\x00\x00\x20\x00\x00\x00\x01\x00\x00\x00\x80\x00\x00\x00\x80\x00\x00\x00\x00\x00\x00\x00\x00\x00\x17\x40\x0B\x00\x58\x54\x32\x35\x46\x36\x34\x42\x00\x00\x00\x00\x00\x00\x00\x00\x5C\xC2\x14\x84\x44\x9C\x81\x8C\x86\x29\x88\x5A\x3B\x02\x48\xB0"- CRC-16/ARC: 2B |
Side note: at this point is seems that every response from the MCU ends with FC00.
Baud Rate Change
After receiving the last response from the MCU, the flashing tool sends the UpdateBaud command. The baudrate 921600 (0xe1000) can be seen as a 32 bit value with the LSB send first.
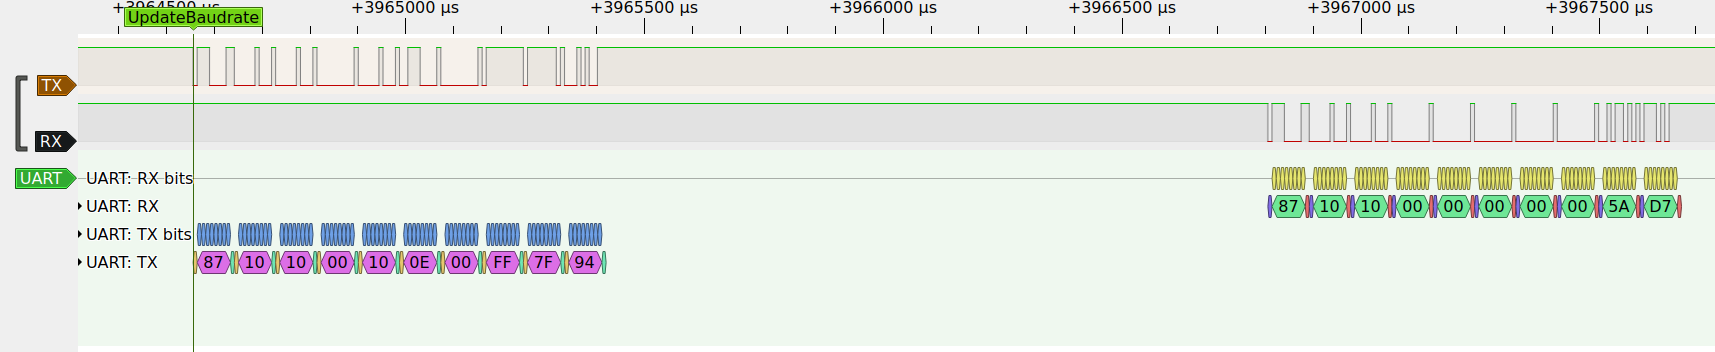
After that the tool sends three further bytes. The response starts with the same three bytes as the request, then five 00 bytes and two more. Suspecting that the two bytes at the end are a CRC, I processed the byte strings with reveng.
$ ./reveng -w 16 -s 87101000100E00FF7F94 87101000000000005AD7
./reveng: warning: you have only given 2 samples
./reveng: warning: to reduce false positives, give 4 or more samples
width=16  poly=0x8005  init=0x0000  refin=true  refout=true  xorout=0x0000  check=0xbb3d  residue=0x0000  name="CRC-16/ARC"
Although printing a warning about the number of samples being too low, it still gives us a result, that even has the name CRC-16/ARC and when plugging the byte strings into crccalc.com, the result is 0.
| Protocol Phase | Op/RespCode | Parameters: length |
| TX: change baud rate | b"\x87\x10\x10" | - baud rate: 4B - stuffing ( b"\xFF"): 1B- CRC-16/ARC: 2B |
| RX: acknowledge baud rate | b"\x87\x10\x10" | - stuffing (b"\x00"): 5B- CRC-16/ARC: 2B |
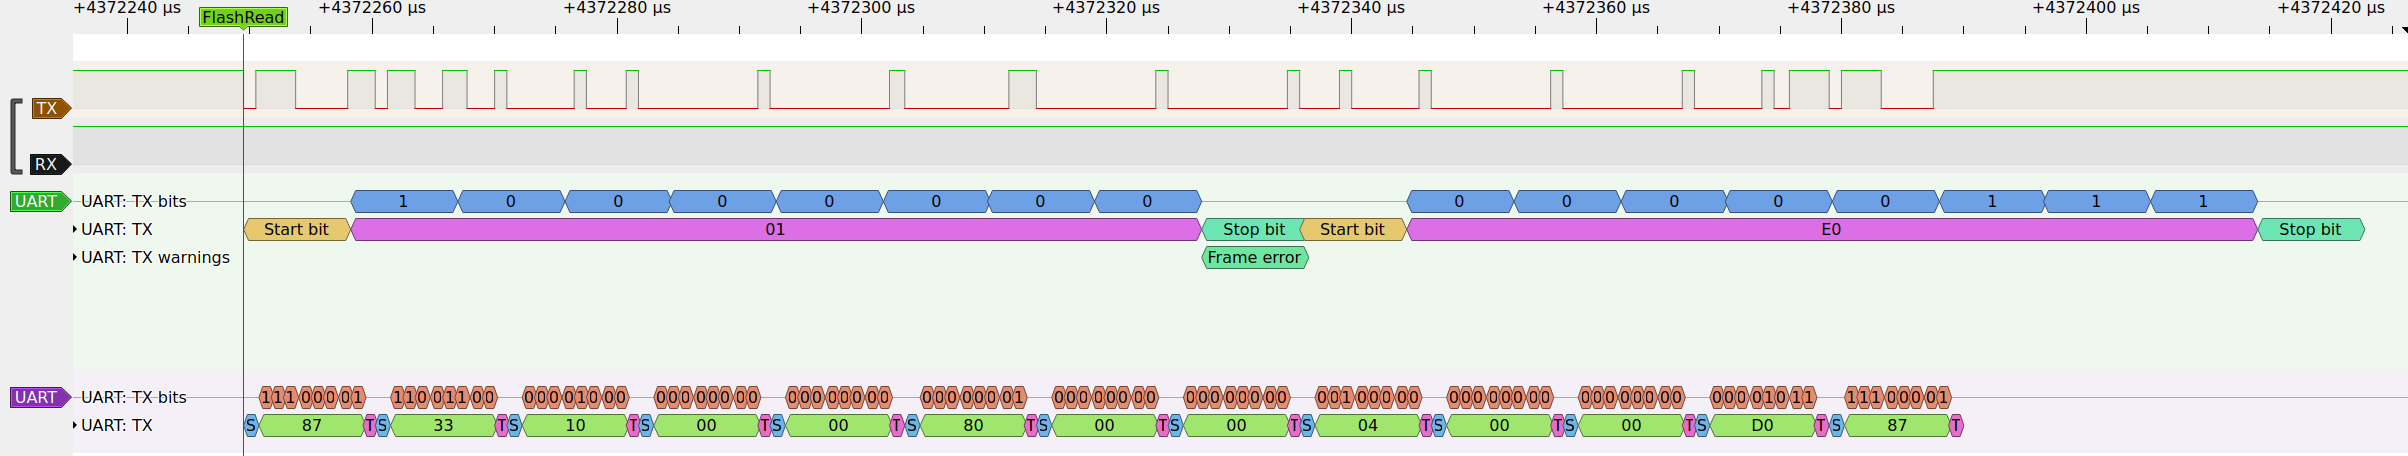
Flash Read
~400ms after the MCU acknowledges the baud rate change, the flasher tool begins to transmit again, now with the new baud rate.
| Protocol Phase | Op/RespCode | Parameters: length |
| TX: read flash | b"\x87\x33\x10" | - address: 4B - length: 4B - CRC-16/ARC: 2B |
| RX: flash content | b"\x87\x33\x10" | - length: 4B - payload: nB - CRC-16/ARC: 2B |
After that no more signals were transmitted.
Clicking the ReadAll button in the flashing tool, I seems that reads are transmitted in 1kiB big segments.
Discussions
Become a Hackaday.io Member
Create an account to leave a comment. Already have an account? Log In.