Close
0%
0%

Connected Trash Can

Device allowing people to see the filling of a trash can thanks to an LED, and sending the data to a website updating live

Public Chat
Similar projects worth following
Connected trash can allowing people to see the filling of a trash can thanks to an LED, and sending the data to a website updating live.

This project is a school project aiming to discover IoT and try to create an IoT device by ourselves, finding a way to look for informations, program and solve problems. 

If you want to create this project, DO NOT follow the logs day by day. We ran into a lot of issues while building the project, changed some sensors etc. Follow the intsructions if you want to recreate the device, everything is going to be summarized in it once the project is over.

> The connected trash can project is planned to be set on the cover of trash cans across a city, allowing garbage collectors to know what trash cans need to be collected when they do their garbage gathering. This device is using a Raspberry Pi connected to the Internet, an ultrasonic sensor and an RGB LED. The device detects the emptiness of the bin, sends the data to a server that updates the emptiness of the trash can on a map.

Quick view of the project working :

Special thanks to Yohan BOUJON, Matt BOND, Daniel LUPESCU and Thibault LABATUT for helping us throught the project

Connected trashcan project - presentation.pdf

Connected trashcan - presentation slides

Adobe Portable Document Format - 8.66 MB - 06/02/2022 at 17:32

Preview

sensoring_script.py

Python script of the Raspberry Pi 4B /!\ Change the link to your own database inside

py - 2.67 kB - 06/01/2022 at 09:22

Download

HTML website.zip

Pack of all you need for the website /!\ Change the link to your own database in dashboard.html

x-zip-compressed - 2.33 MB - 06/01/2022 at 09:21

Download

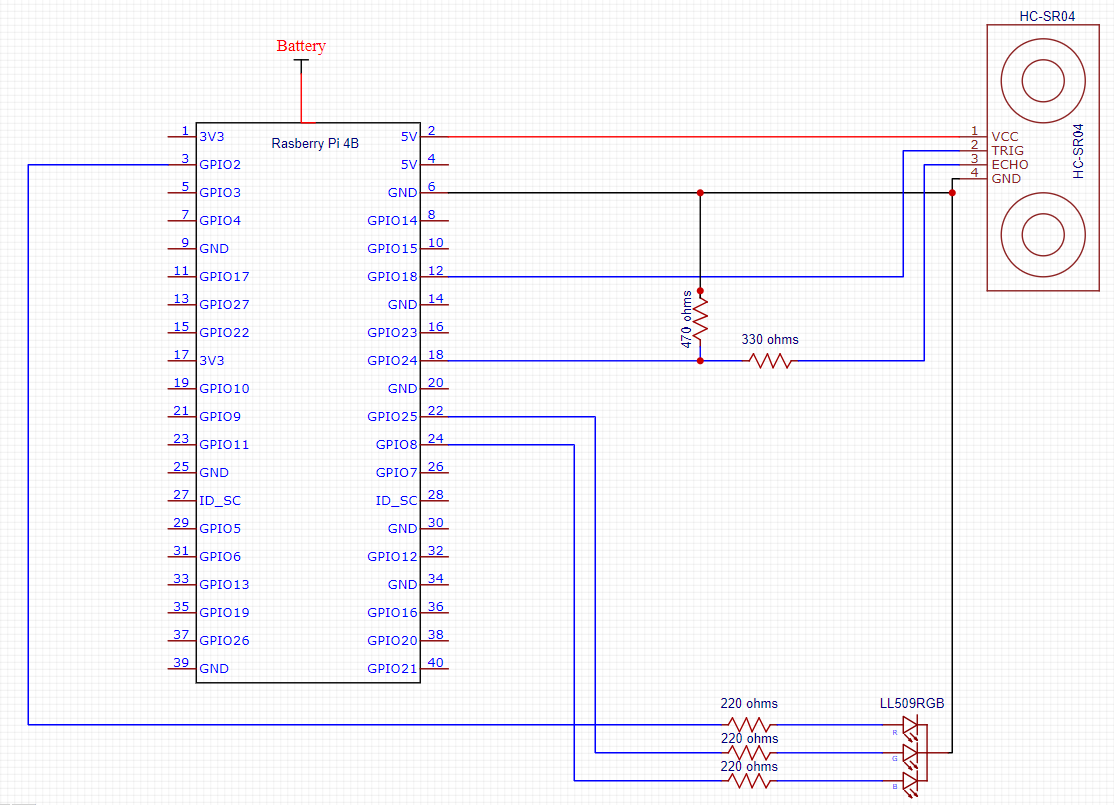
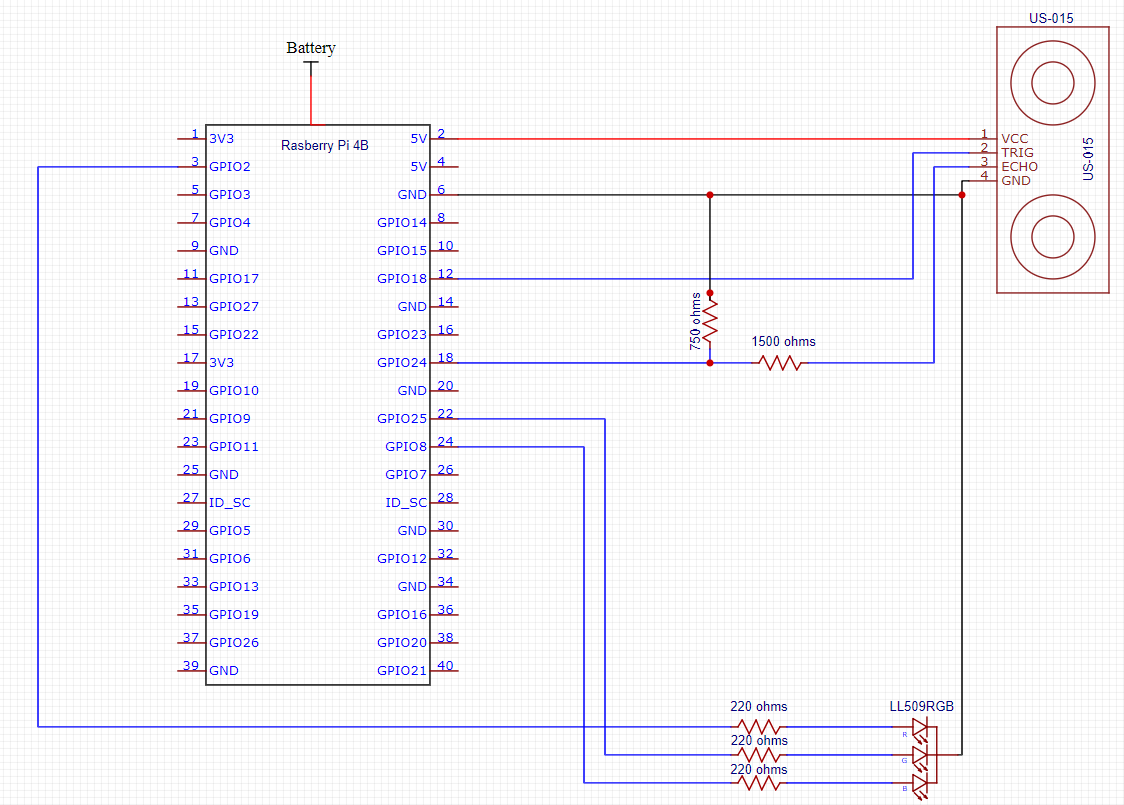
wiring schem.PNG

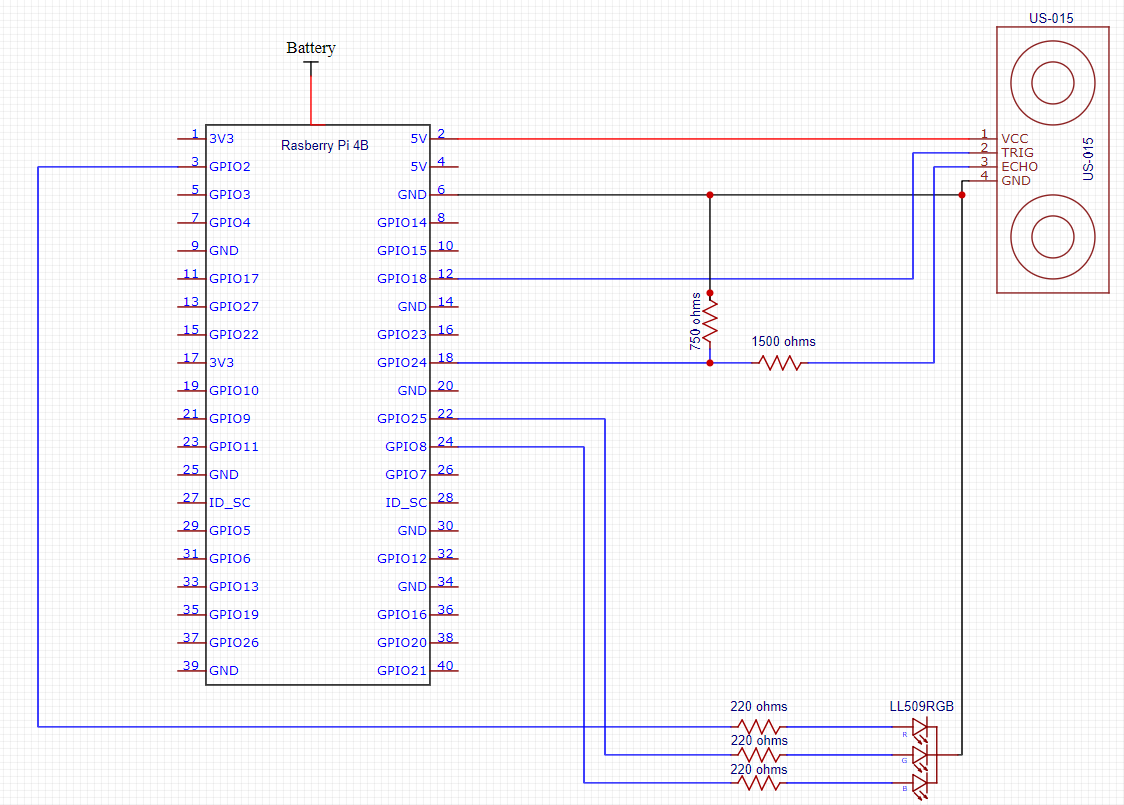
The wiring schem of the project

Portable Network Graphics (PNG) - 75.58 kB - 05/28/2022 at 10:47

Preview

device box.svg

You need to make new holes : - one where you want the LED to be (5mm diameter) - one to have access to the battery and let the wires of the sensor pass (90x25mm)

svg+xml - 10.06 kB - 05/28/2022 at 10:41

Preview

View all 6 files

  • 1 × Raspberry pi 4B nano-computer
  • 1 × US-015 Ultrasonic sensor
  • 1 × LL509RVB RGB LED
  • 3 × 220 Ω resistors Electronic Components / Misc. Electronic Components
  • 1 × 750 Ω resistor Electronic Components / Misc. Electronic Components

View all 11 components

  • [Final session] Presentation

    Antoine06/02/2022 at 17:40 0 comments

    Here we are, we have just done our last session. We had to present the whole project to the class and do a quick demonstration. 

    - Here are the Slides we presented to our class, and we tried to make a demonstration live but due to the bad internet connection in the room, the device was unable to send the data to the Firebase Database.

    - Finally, we decided to shoot a video of the device working, something that must have been done before the presentation, to show it working :

    As a team, we all want to thank our teachers for guiding us through this project, but also Daniel LUPESCU, Thibault LABATUT and Yohan BOUJON who helped us respectively for the data part, the lasercut and the set-up of the Raspberry Pi 4B.

  • [Session 7] Website and data

    Antoine05/28/2022 at 13:53 0 comments

    Our last objectif was to link the sensored data to a website updating in live. In order to do it, we used two different free services :

    - Google Firebase to host the database 

    - Netlify to host the website on a server

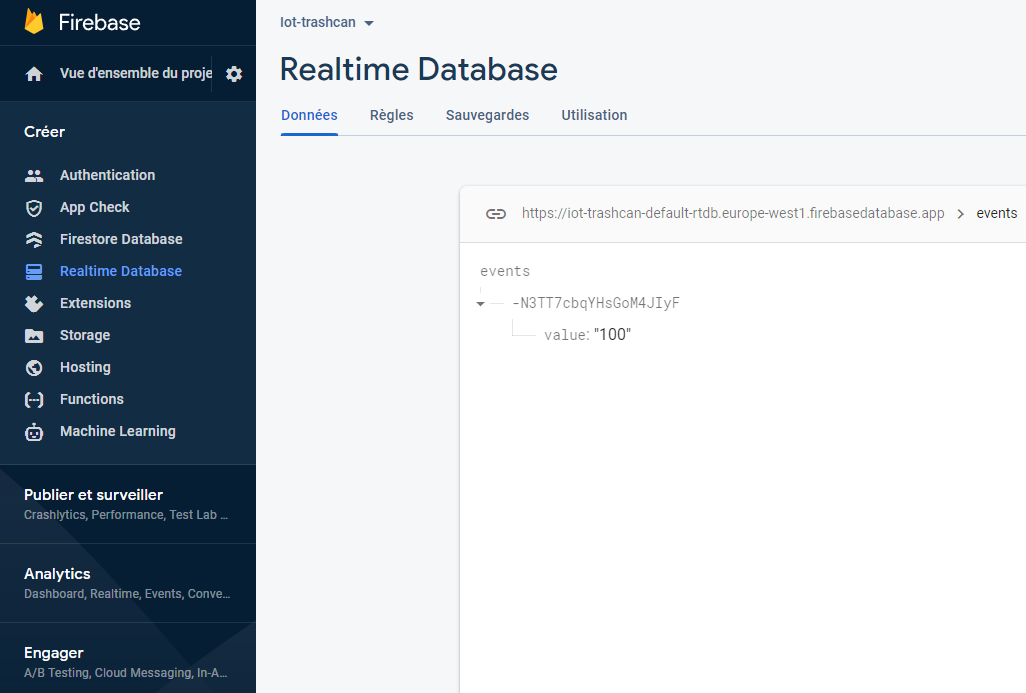
    First, we opened a new database on Google Firebase to store our values. We only had to get the link of the database to start communicating with it.

    Then we had to communicate from the python script to the database. For this we used the "requests" library. We added a few lines at the end of the script to : delete the previous value, send the new one and display some status codes of the requests in the console.

    Here is the final code :

    import RPi.GPIO as GPIO
    import time
    import requests
    
    """ < VAR DEF > """
    TRIG=18
    ECHO=24
    RED=2
    BLUE=8
    GREEN=25
    ln_trash = 50 #Length of the trash
    ln_avg = 5 #Number of values used to calculate the avg length
    values = []
    
    
    """ < SETUP OF THE GPIOs > """
    GPIO.setmode(GPIO.BCM)
    GPIO.setup(TRIG,GPIO.OUT)
    GPIO.setup(ECHO,GPIO.IN)
    GPIO.setup(RED,GPIO.OUT)
    GPIO.setup(GREEN,GPIO.OUT)
    GPIO.setup(BLUE,GPIO.OUT)
    
    
    """ < RESET OF THE LEDS > """
    GPIO.output(RED, False)
    GPIO.output(BLUE, False)
    GPIO.output(GREEN, False)
    
    
    """ < MAIN PROCESS > """
    while (True) :
    
            #CALCULATING THE DISTANCE
            GPIO.output(TRIG,False)
            time.sleep(0.5)
            GPIO.output(TRIG, True)
            time.sleep(0.00001)
            GPIO.output(TRIG,False)
    
            while GPIO.input(ECHO)==0:
                    pulse_start = time.time()
    
            while GPIO.input(ECHO)==1:
                    pulse_end=time.time()
    
            pulse_duration=pulse_end-pulse_start
            distance=pulse_duration*17000
            distance=round(distance,1)
    
            #Calculating the avg value
            if len(values) == ln_avg :
                    values.pop(0)
            values.append(distance)
    
            avg_value = 0
            for val in values :
                    avg_value += val
            avg_distance = avg_value/len(values)
    
            print("Distance : ",avg_distance,"cm")
    
            #UPDATING THE DATA AND THE LED
            if (distance < ln_trash*0.3) : # < 30% remaining
                    GPIO.output(RED, True)
                    GPIO.output(BLUE, False)
                    GPIO.output(GREEN, False)
                    print("LED color : RED")
                    value = 100
    
            elif (distance < ln_trash*0.6) : # <60% remaining
                    GPIO.output(RED, True)
                    GPIO.output(BLUE, False)
                    GPIO.output(GREEN, True)
                    print("LED color : YELLOW")
                    value = 60
    
            else :                           # >60% remaining
                    GPIO.output(RED, False)
                    GPIO.output(BLUE, False)
                    GPIO.output(GREEN, True)
                    print("LED color : GREEN")
                    value = 30
    
            #SENDING DATA TO THE SERVER PART
            response =  requests.delete("https://iot-trashcan-default-rtdb.europe-west1.firebasedatabase.app/events.json")
            print("> Delete data : ",response.status_code)
    
            params = {'value': value}
            headers = {'Content-Type': 'application/json'}
            response = requests.post("https://iot-trashcan-default-rtdb.europe-west1.firebasedatabase.app/events.json", json = params, headers = headers)
            print("> Send data : ",response.status_code,"\n")
    
    
    GPIO.cleanup()
    

    Last thing, we had to open a server on Netlify and put our code on it. We linked our github account to Netlify, put our code on Github and selected it on Netlify. We had to change the HTML code the add an updating part in order to have a real time changing display according to the data. So we added a JSON script and a CSS stylesheet at the beginning of the code and here is the final result for the dashboard page :

    <HTML>
    <HEAD>
    <style>
    .red-square {
      height: 461px;
      width: 602px;
      background-image: url("./map rouge.png");
      background-repeat: no-repeat;
    }
    .green-square {
      height: 461px;
      width: 602px;
      background-image: url("./map vert.png");
      background-repeat: no-repeat;
    }
    .yellow-square {
      height: 461px;
      width: 602px;
      background-image: url("./map jaune.png");
      background-repeat: no-repeat;
    }
    </style>
    </style>
    <script src="https://ajax.googleapis.com/ajax/libs/jquery/3.6.0/jquery.min.js"></script>
     <script>
        $( document ).ready(function(){
            setInterval(function(){
                $( "#results" ).empty();
                $.getJSON("https://iot-trashcan-default-rtdb.europe-west1.firebasedatabase.app/events.json", function(data, status){
                    $.each(data, function(key, val) {
                        if(val.value == 30) {
                            $("<div class=\"green-square\"></div>'"...
    Read more »

  • [Session 6] Box and HTML

    Antoine05/28/2022 at 10:39 0 comments

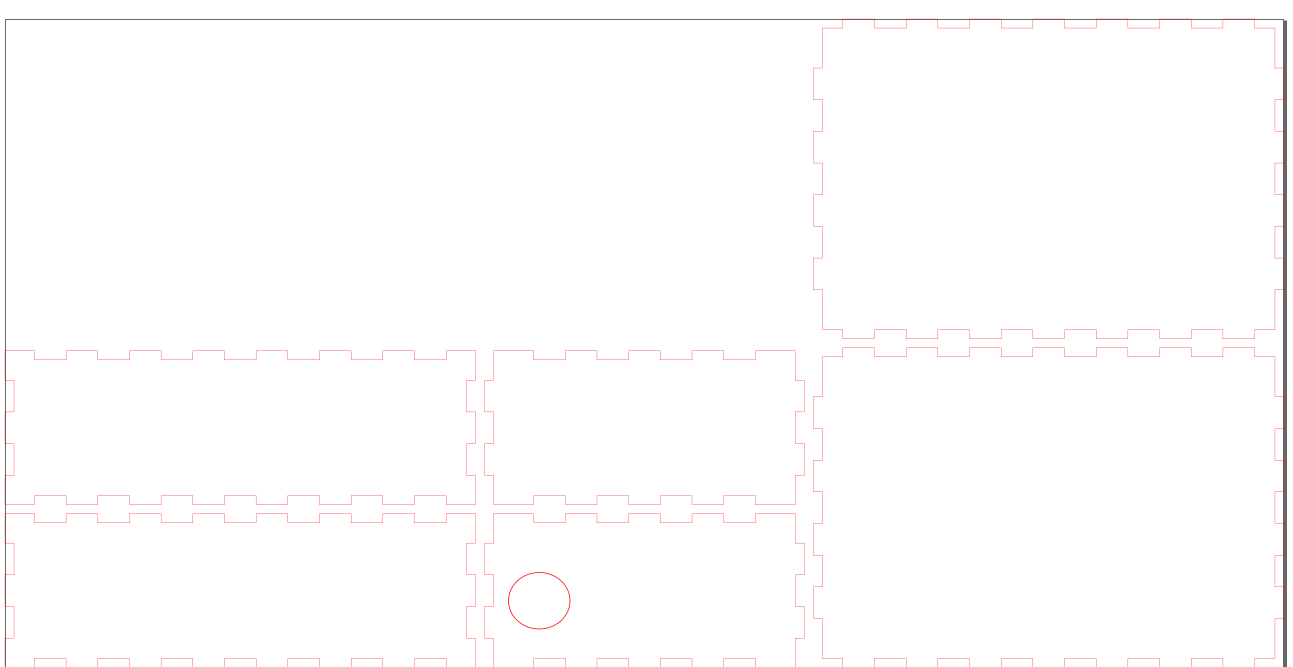
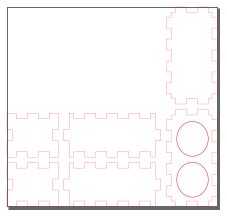
    Today, we went to the Lab to make the box of our device. We decided to lasercut two boxes, a big for the main part (battery, raspberry, breadboard and LED) and a small one only for the sensor.

    We used the lasercut schems we did at the beginning of the project (here are the SVG codes)

    Big box :

    <?xml version="1.0" encoding="UTF-8" standalone="no"?>
    <svg
       width="424mm"
       height="215mm"
       viewBox="0 0 424 215"
       version="1.1"
       preserveAspectRatio="xMidYMid meet"
       id="svg199"
       sodipodi:docname="box.svg"
       inkscape:version="1.1.2 (b8e25be833, 2022-02-05)"
       xmlns:inkscape="http://www.inkscape.org/namespaces/inkscape"
       xmlns:sodipodi="http://sodipodi.sourceforge.net/DTD/sodipodi-0.dtd"
       xmlns="http://www.w3.org/2000/svg"
       xmlns:svg="http://www.w3.org/2000/svg">
      <defs
         id="defs203" />
      <sodipodi:namedview
         id="namedview201"
         pagecolor="#ffffff"
         bordercolor="#666666"
         borderopacity="1.0"
         inkscape:pageshadow="2"
         inkscape:pageopacity="0.0"
         inkscape:pagecheckerboard="0"
         inkscape:document-units="mm"
         showgrid="false"
         inkscape:zoom="0.39905906"
         inkscape:cx="800.63337"
         inkscape:cy="197.96568"
         inkscape:window-width="1920"
         inkscape:window-height="991"
         inkscape:window-x="-9"
         inkscape:window-y="-9"
         inkscape:window-maximized="1"
         inkscape:current-layer="svgGroup" />
      <g
         id="svgGroup"
         stroke-linecap="round"
         fill-rule="evenodd"
         font-size="9pt"
         stroke="#000"
         stroke-width="0.25mm"
         fill="none"
         style="stroke:#000;stroke-width:0.25mm;fill:none">
        <path
           style="color:#000000;vector-effect:non-scaling-stroke;fill:#ff0000;stroke:none;-inkscape-stroke:none"
           d="M -0.05078125,163.94922 V 164 173.80078 H 2.9492188 v 10.39844 h -3.00000005 v 10.60156 H 2.9492188 v 10.39844 h -3.00000005 v 9.85156 H 9.8007813 v -3 H 20.199219 v 3 h 10.601562 v -3 h 10.398438 v 3 h 10.601562 v -3 h 10.398438 v 3 h 10.601562 v -3 h 10.398438 v 3 h 10.601562 v -3 h 10.398439 v 3 h 10.60156 v -3 h 10.39844 v 3 h 10.60156 v -3 h 10.39844 v 3 h 9.85156 v -9.85156 h -3 v -10.39844 h 3 v -10.60156 h -3 v -10.39844 h 3 v -9.85156 h -9.85156 v 3 h -10.39844 v -3 h -10.60156 v 3 h -10.39844 v -3 h -10.60156 v 3 H 93.800781 v -3 H 83.199219 v 3 H 72.800781 v -3 H 62.199219 v 3 H 51.800781 v -3 H 41.199219 v 3 H 30.800781 v -3 H 20.199219 v 3 H 9.8007813 v -3 z m 0.1015625,0.10156 H 9.6992188 v 3 H 20.300781 v -3 h 10.398438 v 3 h 10.601562 v -3 h 10.398438 v 3 h 10.601562 v -3 h 10.398438 v 3 h 10.601562 v -3 h 10.398438 v 3 h 10.601561 v -3 h 10.39844 v 3 h 10.60156 v -3 h 10.39844 v 3 h 10.60156 v -3 h 9.64844 v 9.64844 h -3 v 10.60156 h 3 v 10.39844 h -3 v 10.60156 h 3 v 9.64844 h -9.64844 v -3 h -10.60156 v 3 h -10.39844 v -3 h -10.60156 v 3 h -10.39844 v -3 H 93.699219 v 3 H 83.300781 v -3 H 72.699219 v 3 H 62.300781 v -3 H 51.699219 v 3 H 41.300781 v -3 H 30.699219 v 3 H 20.300781 v -3 H 9.6992188 v 3 H 0.05078125 v -9.64844 H 3.0507813 V 194.69922 H 0.05078125 V 184.30078 H 3.0507813 V 173.69922 H 0.05078125 Z"
           id="front_outsideCutPath" />
        <path
           style="color:#000000;vector-effect:non-scaling-stroke;fill:#ff0000;stroke:none;-inkscape-stroke:none"
           d="M 161.94922,163.94922 V 164 v 9.69922 h -3 v 10.60156 h 3 v 10.39844 h -3 v 10.60156 h 3 v 9.75 h 13.35156 v -3 h 10.39844 v 3 h 10.60156 v -3 h 10.39844 v 3 h 10.60156 v -3 h 10.39844 v 3 h 10.60156 v -3 h 10.39844 v 3 h 10.55078 2.80078 v -9.75 h 3 v -10.60156 h -3 v -10.39844 h 3 v -10.60156 h -3 v -9.75 h -13.35156 v 3 h -10.39844 v -3 h -10.60156 v 3 h -10.39844 v -3 h -10.60156 v 3 h -10.39844 v -3 h -10.60156 v 3 h -10.39844 v -3 H 164.75 Z m 0.10156,0.10156 h 2.69922 10.44922 v 3 h 10.60156 v -3 h 10.39844 v 3 h 10.60156 v -3 h 10.39844 v 3 h 10.60156 v -3 h 10.39844 v 3 h 10.60156 v -3 h 13.14844 v 9.75 h 3 v 10.39844 h -3 v 10.60156 h 3 v 10.39844 h -3 v 9.75 H 259.25 248.80078 v -3 h -10.60156 v 3 h -10.39844 v -3 h -10.60156 v 3 h -10.39844 v -3 h -10.60156 v 3 h -10.39844 v -3 h -10.60156 v 3 h -13.14844 v -9.75 h -3 v -10.39844 h 3 v -10.60156 h -3 v -10.39844 h 3 z"
           id="left_outsideCutPath" />
        <path...
    Read more »

  • [Session 5] Coding and Sensor issues

    Antoine05/19/2022 at 10:52 0 comments

    Today, we worked on the code to make the LEDs and the sensor work. We installed on the raspberry pi the library Python3 to be able to code in Python, and started making some programs.


    To create a program on the root of the raspberry, you need to type "touch name.py" in the console and to edit it, you need to type "sudo nano name.py".

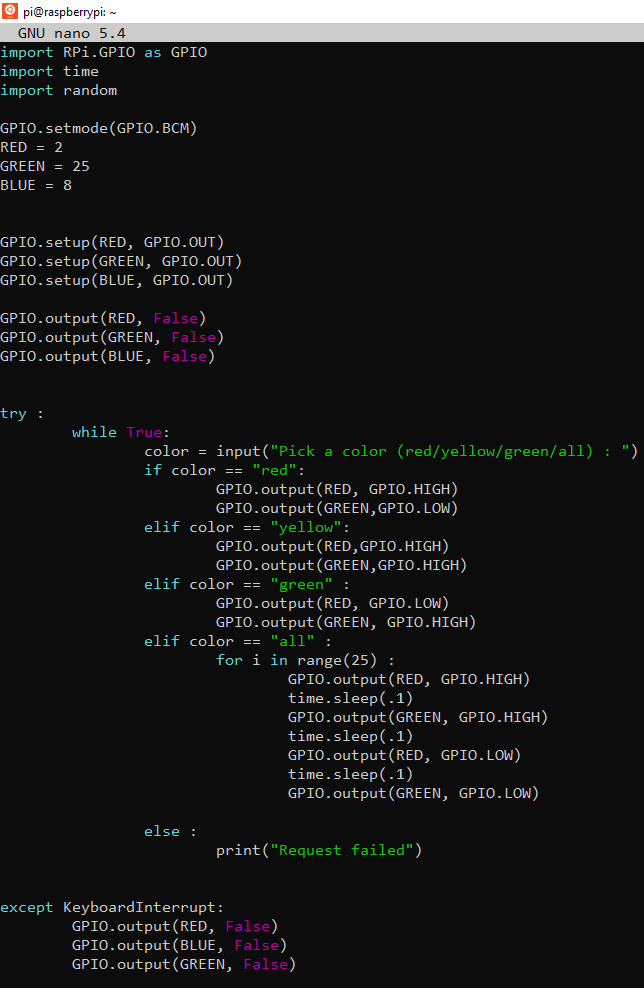
    - We made a first one to test the LEDs.  In order to program the GPIOs (the pins of the card) you first need to choose a mode (BCM/BOARD) to choose between the name of the pin or the number of the pin. Once it's done, you need to setup the GPIOs you're going to use. For LEDs, we set them all as OUTPUTs. Then we can code a program and to change the color of the LED, we only have to use "GPIO.output(N°_of_the_pin, True/False)". And that is how we created the following program to test the 3 different colors we needed for the project. 

    /!\ The GPIOs give only binary outputs so the value of red, green and blue can only be 0 or Vcc each. To have other values, you should use a DAC (Digital to Analog Converter)

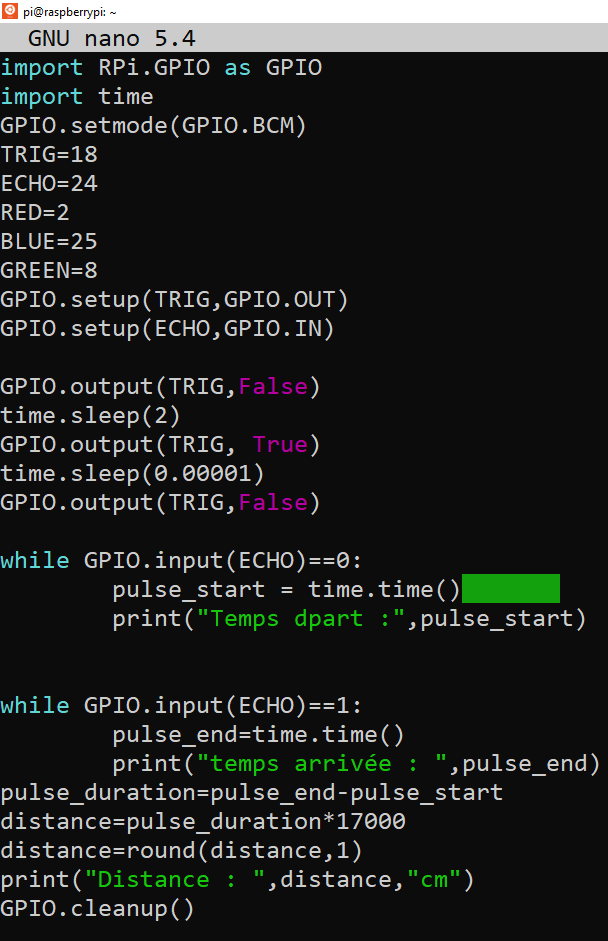
    - Then we tried to use the sensor. We first noticed we didn't use the right values of resistors on the ECHO line. We needed the part connected to the mass to be twice the one between the resistors, so we changed to 750 and a 1500 ohms. Then, we copied the following code from the Internet, adapting it to our wiring but we kept getting some strange values. Whatever the distance, the distance displayed in the console was around 8 cm but never a consistent  value, sometimes peaking to 24cm, sometimes lowering to 3cm. We though that the HC-SR04 (ultrasonic sensor) we were using was the problem, so we changed to a US-015, and it worked !

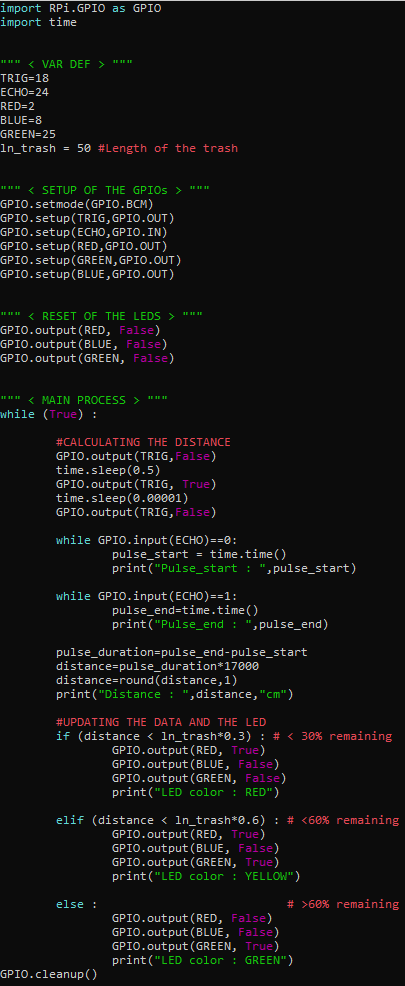
    - Now, we know that both LED and the sensor work, so we can start coding the main program. We want it to change the color of the LED according to the distance compared to the size of the trashcan. ANd after a few tries, recodings and tests, we ended up with this first version of the program :

    Here is the eletric schem updated with the right sensor and the right resistor values :

    For the next time, we'll have to find a way to send the data to server from a Python program and also change the code to be less affected by some strange values that sometimes pop.

  • [Extra Session] Focusing on the network and code environment (Raspberry Pi 4)

    Antoine05/15/2022 at 09:02 0 comments

    Since we didn't manage to make the Raspberry work during the sessions at school, I went to a friend's house who already used a Raspberry Pi to help me set this up. We went threw a few different steps :

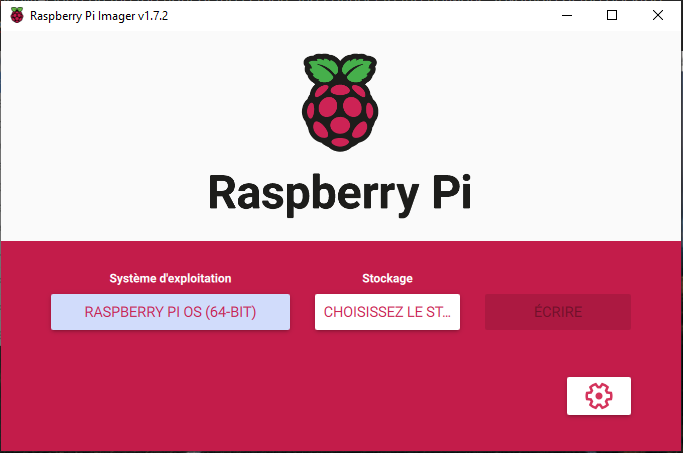
    - First of all, we need to install the OS on the microSD card : download the "Raspberry Pi Imager" , plug the SD card on your computer, select the OS "Raspberry PI OS (64 bits)" and choose your SD card before starting writing.

    - Then, we need to comunicate with the Raspberry : plug a keyboard and a mouse on the USB ports of the card, and plug a microHMDI to HDMI cable between the card and a screen. The raspberry is working like a computer so we need some peripherals to communicate easily. You'll see the desktop of the raspberry on the screen and you can use the mouse and the keyboard (in QWERTY) to control it.

    NB : you can set everything up by modifying the SSH files of the microSD card if you want to do this headless, but we had a lot of trouble doing it this way so we chost this method.

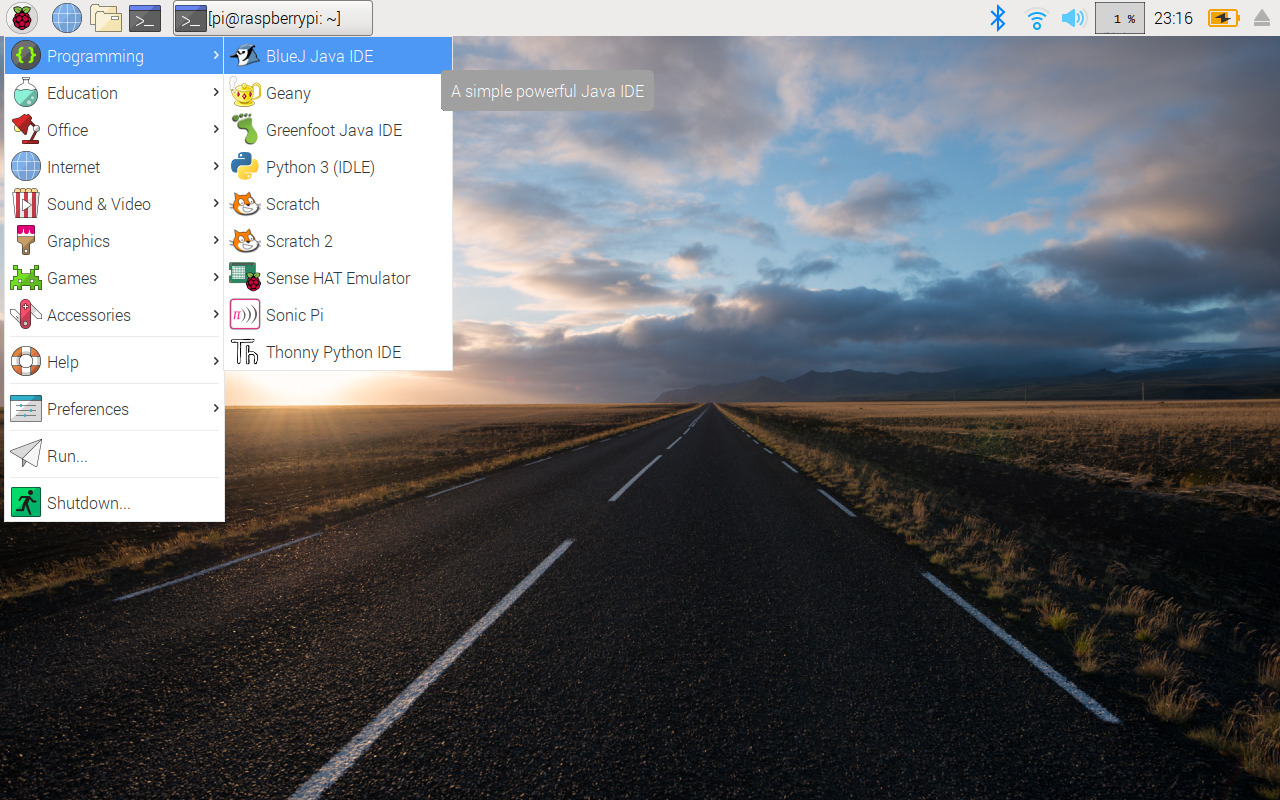
    - Next step is to connect the raspberry to a network/hotspot on which you can connect your programming computer.  We chost to make an hotspot on our cellphone to always be able to have the same network wherever we go. We only need to connect it to the WiFi like a regular computer, we click on the WiFi logo on the top right of the screen and connect to the network.  (example of the desktop below)

    Raspberry Pi OS — Wikipédia

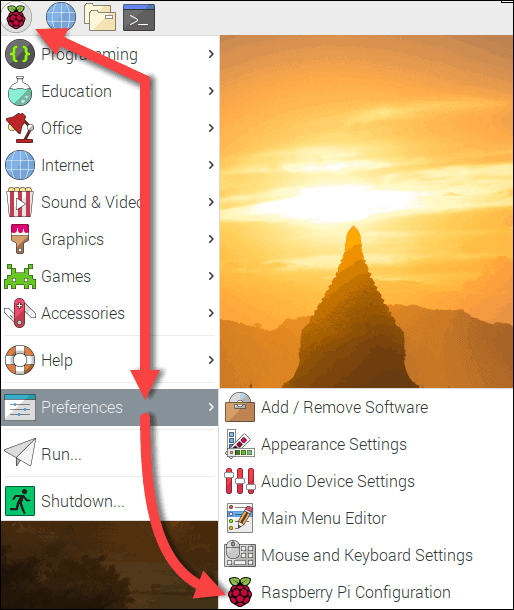
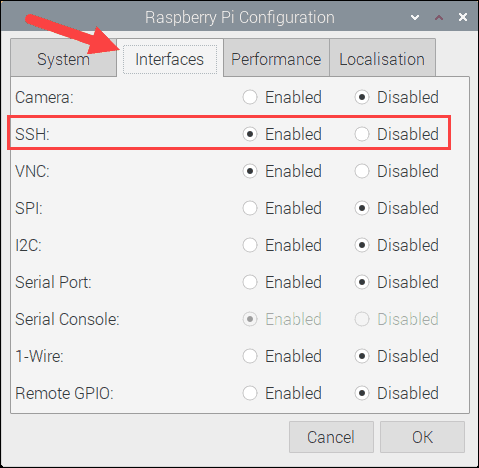
    - Now you should configure SSH on the raspberry PI. In order to do it, you need to click on the raspberry on the desktop, go to preferences and click on Raspberry Pi Configuration. Then you should be able to enable the SSH through a menu. Try to restart the raspberry to be sure the SSH is well activated.

    (see this tutorial online if you need help https://phoenixnap.com/kb/enable-ssh-raspberry-pi)

    Raspberry Pi GUI configuration options menu.Raspberry Pi Interface Configuration menu with SSH option enabled.

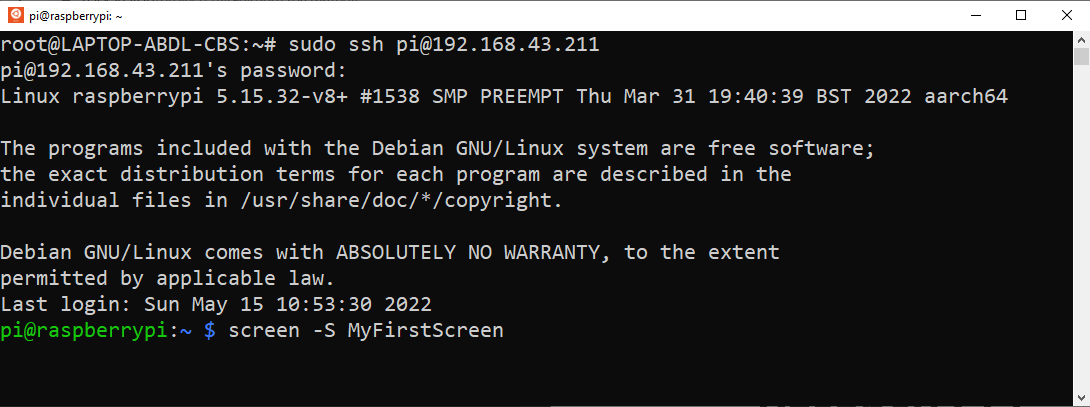
    - The last step is to connect your computer to command the raspberry : For this step, you need a computer connected on the same network as the raspberry PI. You have to open a Unix console (I use Ubuntu) on your computer to start the setup. If you're using a Android phone to create the hotspot you can see the IP-adress of the connected devices in the parameters of the hotspot, you need to find the IP-adress of the Raspberry. To connect to it, type  "sudo ssh username@ip_adress" to connect to it (the password is pi for me). 

    Once you are connected, you directly talk to the console of the raspberry by your command prompt. 

    Tip : If you close the Console, the programs would stop working. If you want it to keep going, you can create a "Screen" on the console and connect to it, allowing you to close the console without killing it on the raspberry. You only need to type : "screen -S NameOfYourScreen" when you just have been connected to the raspberry or : "screen -r NameOfYourScreen" if you want to connect back to a screen you already created. 

    Now you're connected to the raspberry console, you can start coding using classic Unix commands (install Python3 ...) but we'll see it more in details during the next session.

  • [Session 4] Finalising the box and the web page

    Antoine05/12/2022 at 09:22 0 comments

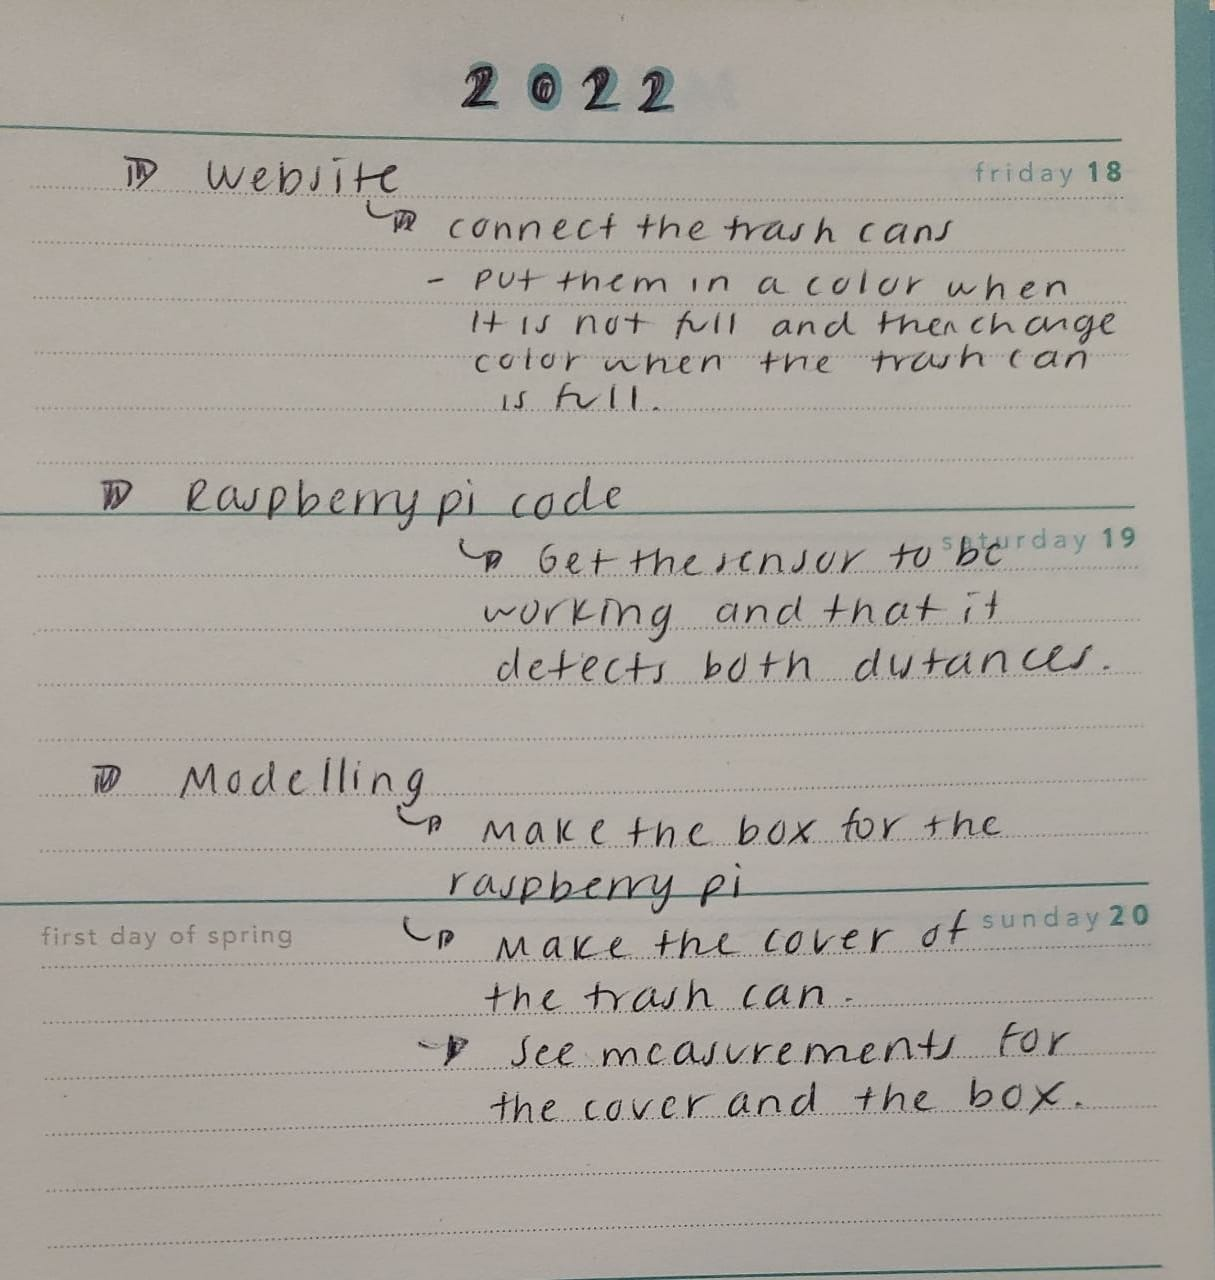
    Today, we chost to spread the different tasks in the team to be more efficient. Since we only have three weeks left, we summarized the remaining part of the project and started working on them independantly.

    - The modelisation of the box has been done on https://fr.makercase.com/#/basicbox. We had to find the measure the components to make them fit in, and we finally arrived to a design with two boxs, a big one of 100x150x45mm and  small one for the sensor of 47x22x18mm. So we finally ended up with those two files, that we will use to lasercut the box.

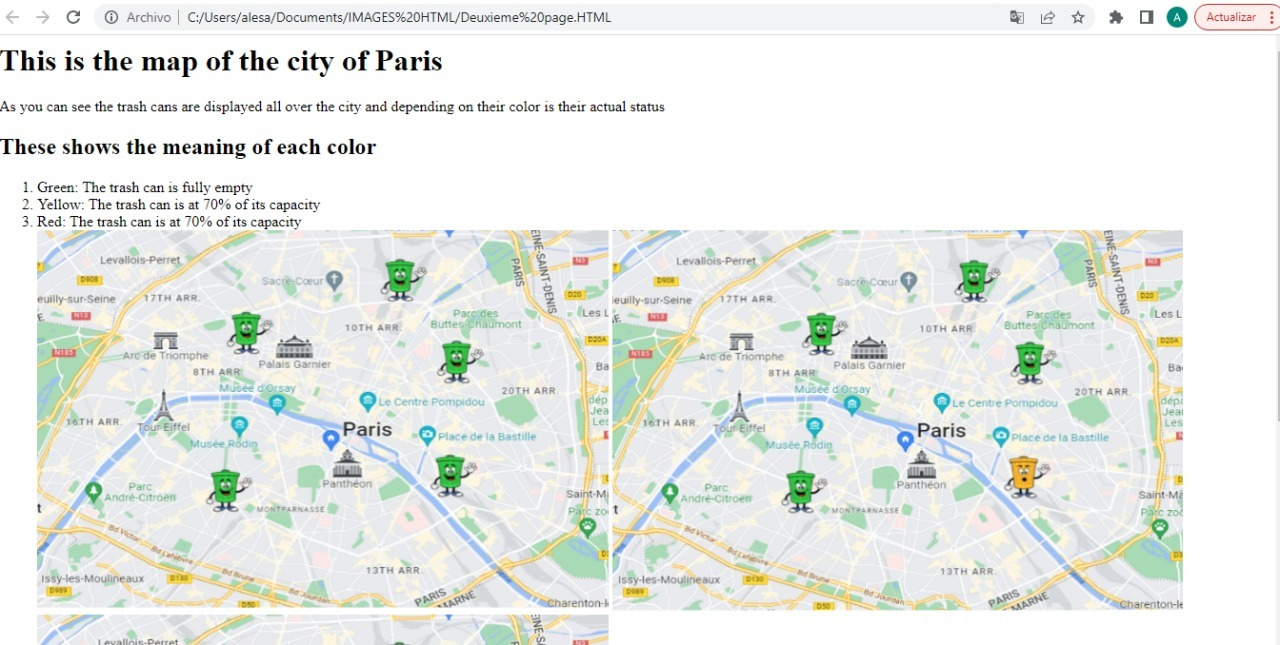
    -  For the website, we kept coding the front part on HTML, to have a map of Paris and some icons to show if a trash can is empty (0-70%), nearly full (70-90%) or full (<90%).

    - In order to start coding, we need to have the right wiring so we remade the wiring of the whole project to be sure we did not do any mistake. To link the raspberry pi to a network and work on the code, I'll see a friend of mine used to work on raspberry this week-end because we didn't manage to do it only by ourselves.

  • [Session 3] Coding part / Raspberry network setup

    Antoine05/05/2022 at 08:51 0 comments

    The wiring part of the project is now done, now we need to find a way to communicate with an app, and create a box for the device.

    We first though about connecting the device and a computer on the same network, like a wifi network, but a wifi network can't be deployed around a whole city. So we needed to find an other way to connect the device. We then though about connecting the device to internet and make it send data using internet to a website that can update the fullness of the trash can on a map. We wrote down the differents parts lasting in order to complete the project 

    For today, we decided to focus the box for the device and start coding the website and the program.

    For the box we finally decided to use some plexiglas to enable the box to be waterproof. So we took the measurement of the components and drafted some configurations.

    For the website, since we did not yet find the exact way to send data from the raspberry pi to the database, we coded the frontend of the website in HTML.

    For next time, we'll have to finish the modelling of the box by picking a final configuration and find a way to send data from the card to a database.

  • [Session 2] First prototype

    Antoine04/21/2022 at 09:43 0 comments

    During this session, we first decided to digitize our project by converting our wiring diagram to an EasyEDA file and writing down this proposal of the whole project :

    Whole schematic

    For the general project in the Iot city we want to provide a system in which the trash cans of the city are connected to an app that the sanitary department uses. In this case each trash can would have a sensor to identify the capacity in which it is at present time, this meaning to know when it is about to be filled so it can be emptied before litter hits the ground.

    The sensor will send a signal to the app when the trash can reaches 75% of its capacity so the driver can be notified that in a brief time it will be necessary to pick up the trash. Once it reaches 90% a notification will arise that it is time to pick up the trash, simultaneously it will identify the other trash cans in the area that also need to be taken care of. Due to the fact that each sensor has an integrated GPS to it, a path will be generated so the driver knows what streets to take in order to optimize time and make the route as efficient as possible.

    In an ideal system trash would not have to be on the floor because there would always be space in a trash bin to put it, avoiding soil pollution and helping the environment.

    Nowadays there is a device that has one of our features called: Bin-e. But it is used only to monitor the capacity of the trash can and the different trash types.
    https://www.bine.world/howitworks/

    There is also a company that sells sensors that monitor trash in Slovakia called “Sensoneo”.

    https://sensoneo.com/es/solucion-inteligente-de-gestion-de-residuos-para-empresas/

    The EasyEDA diagram :

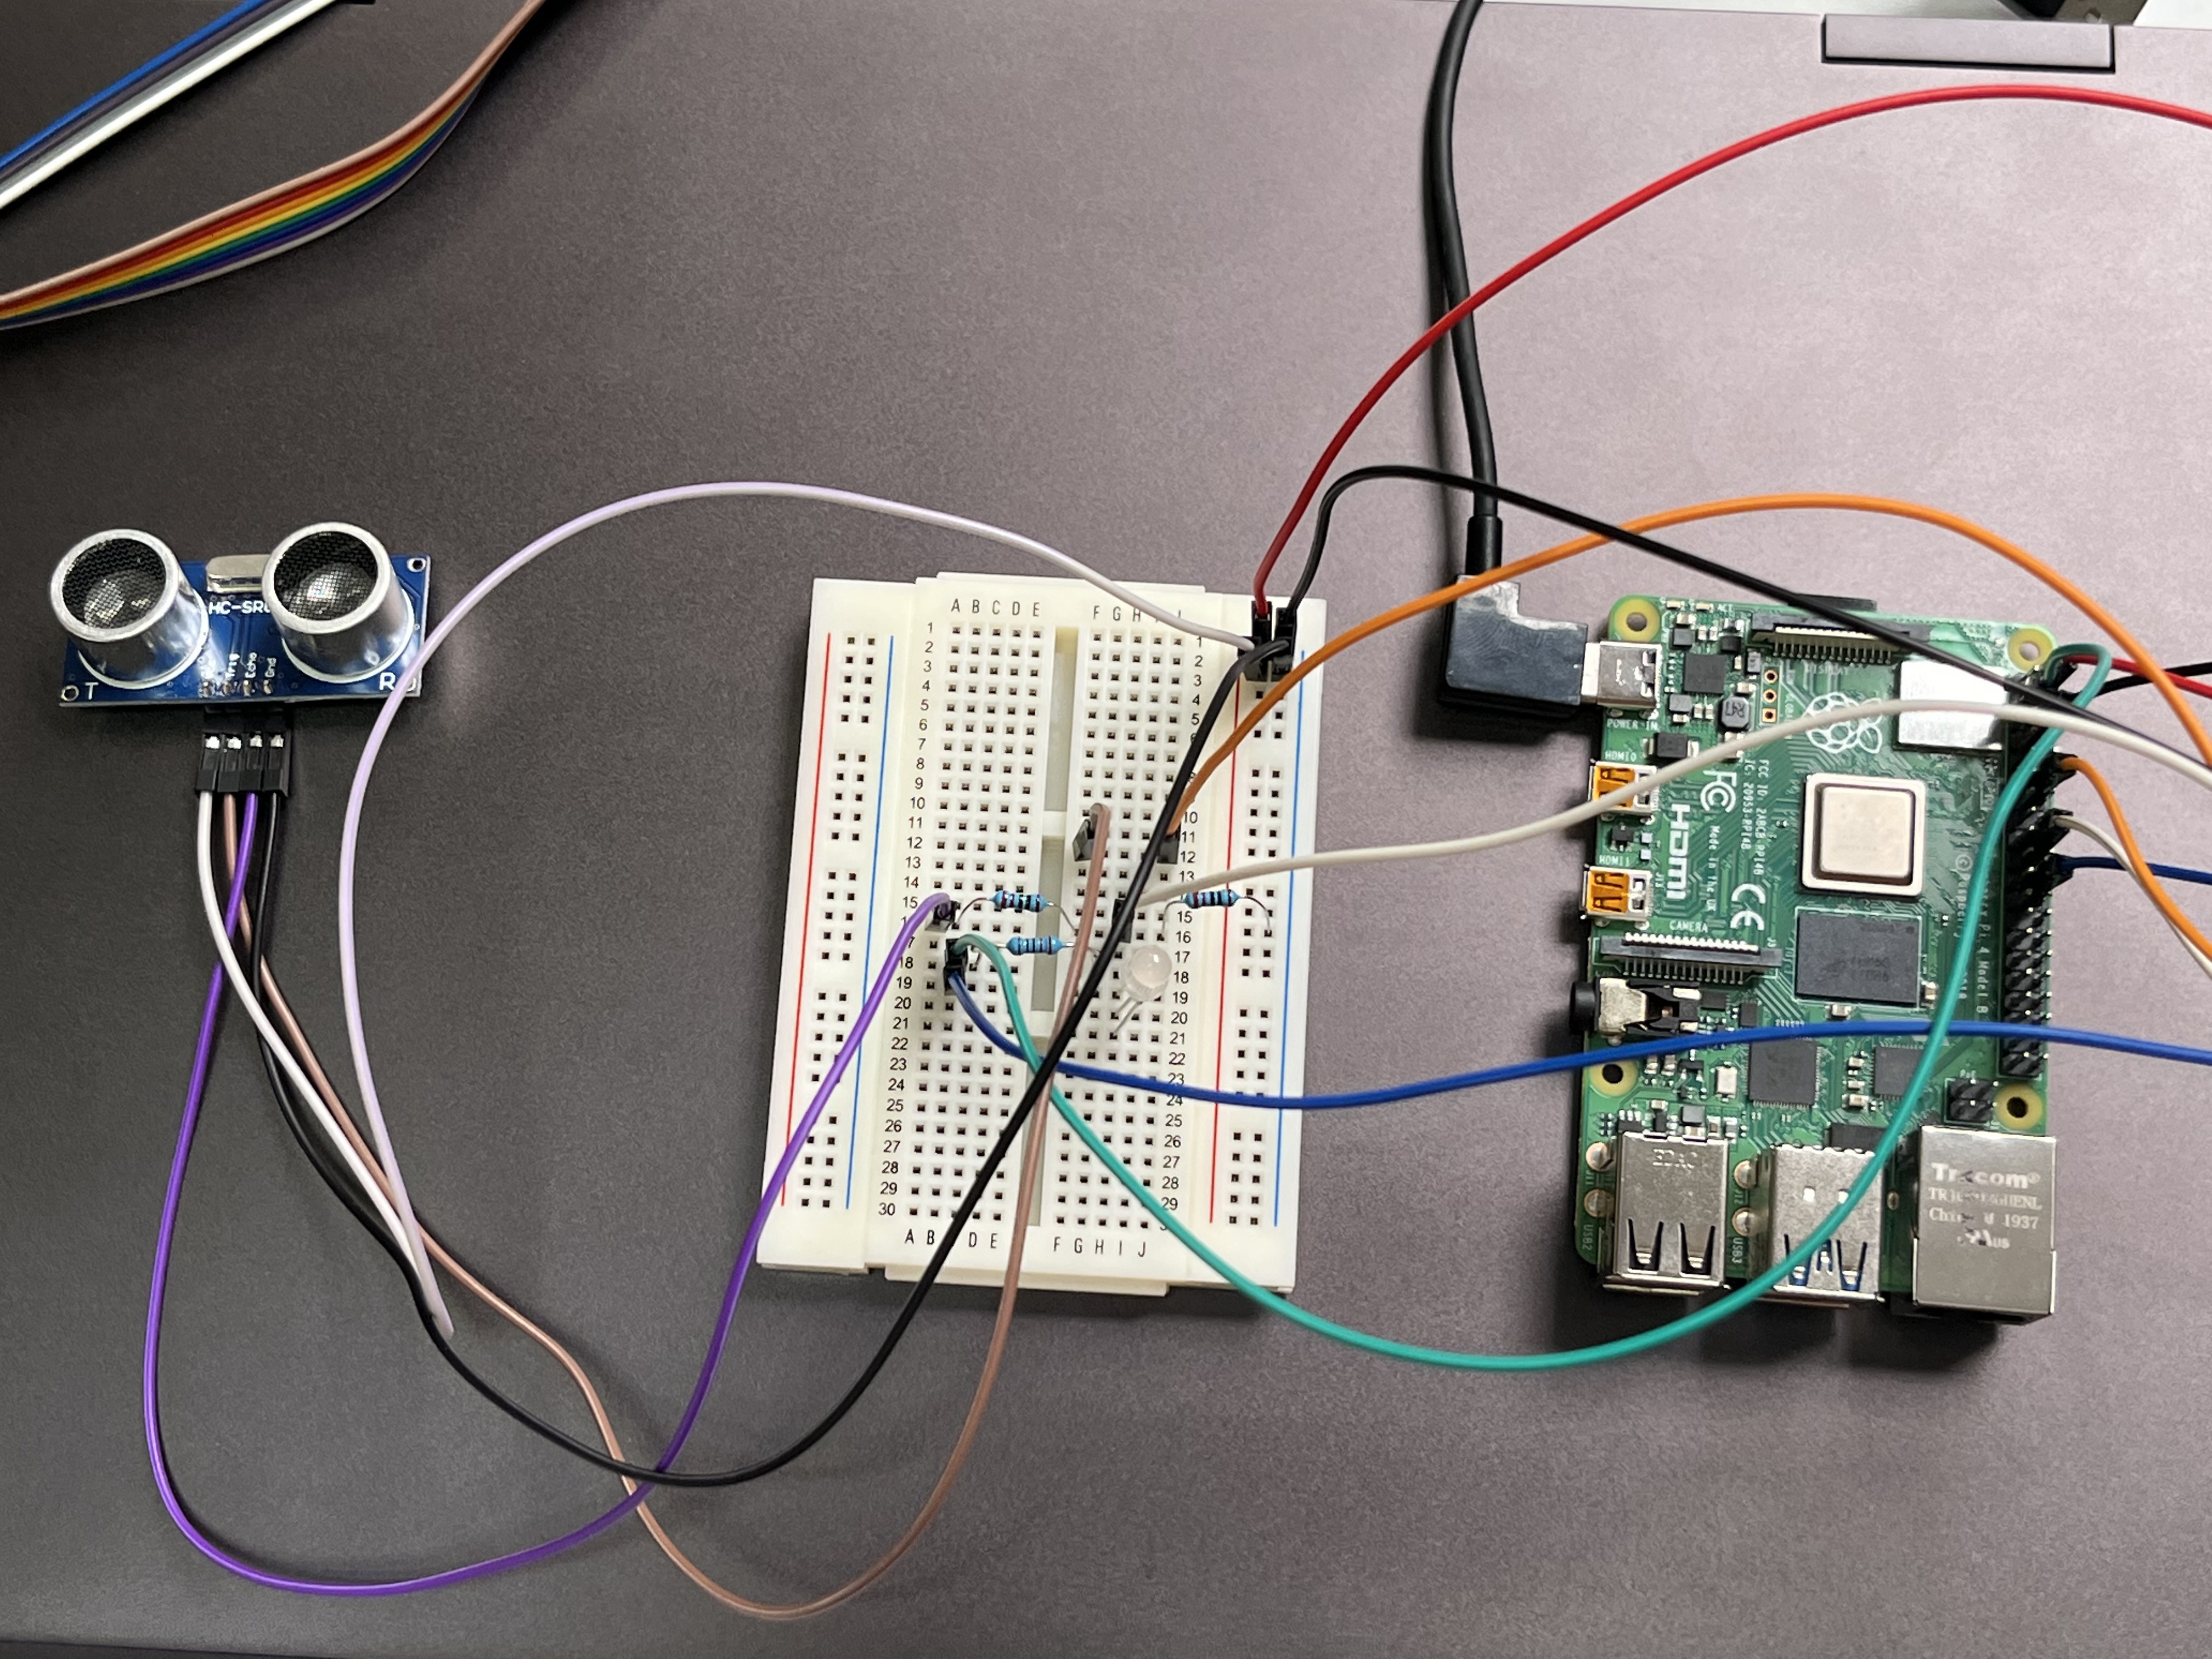
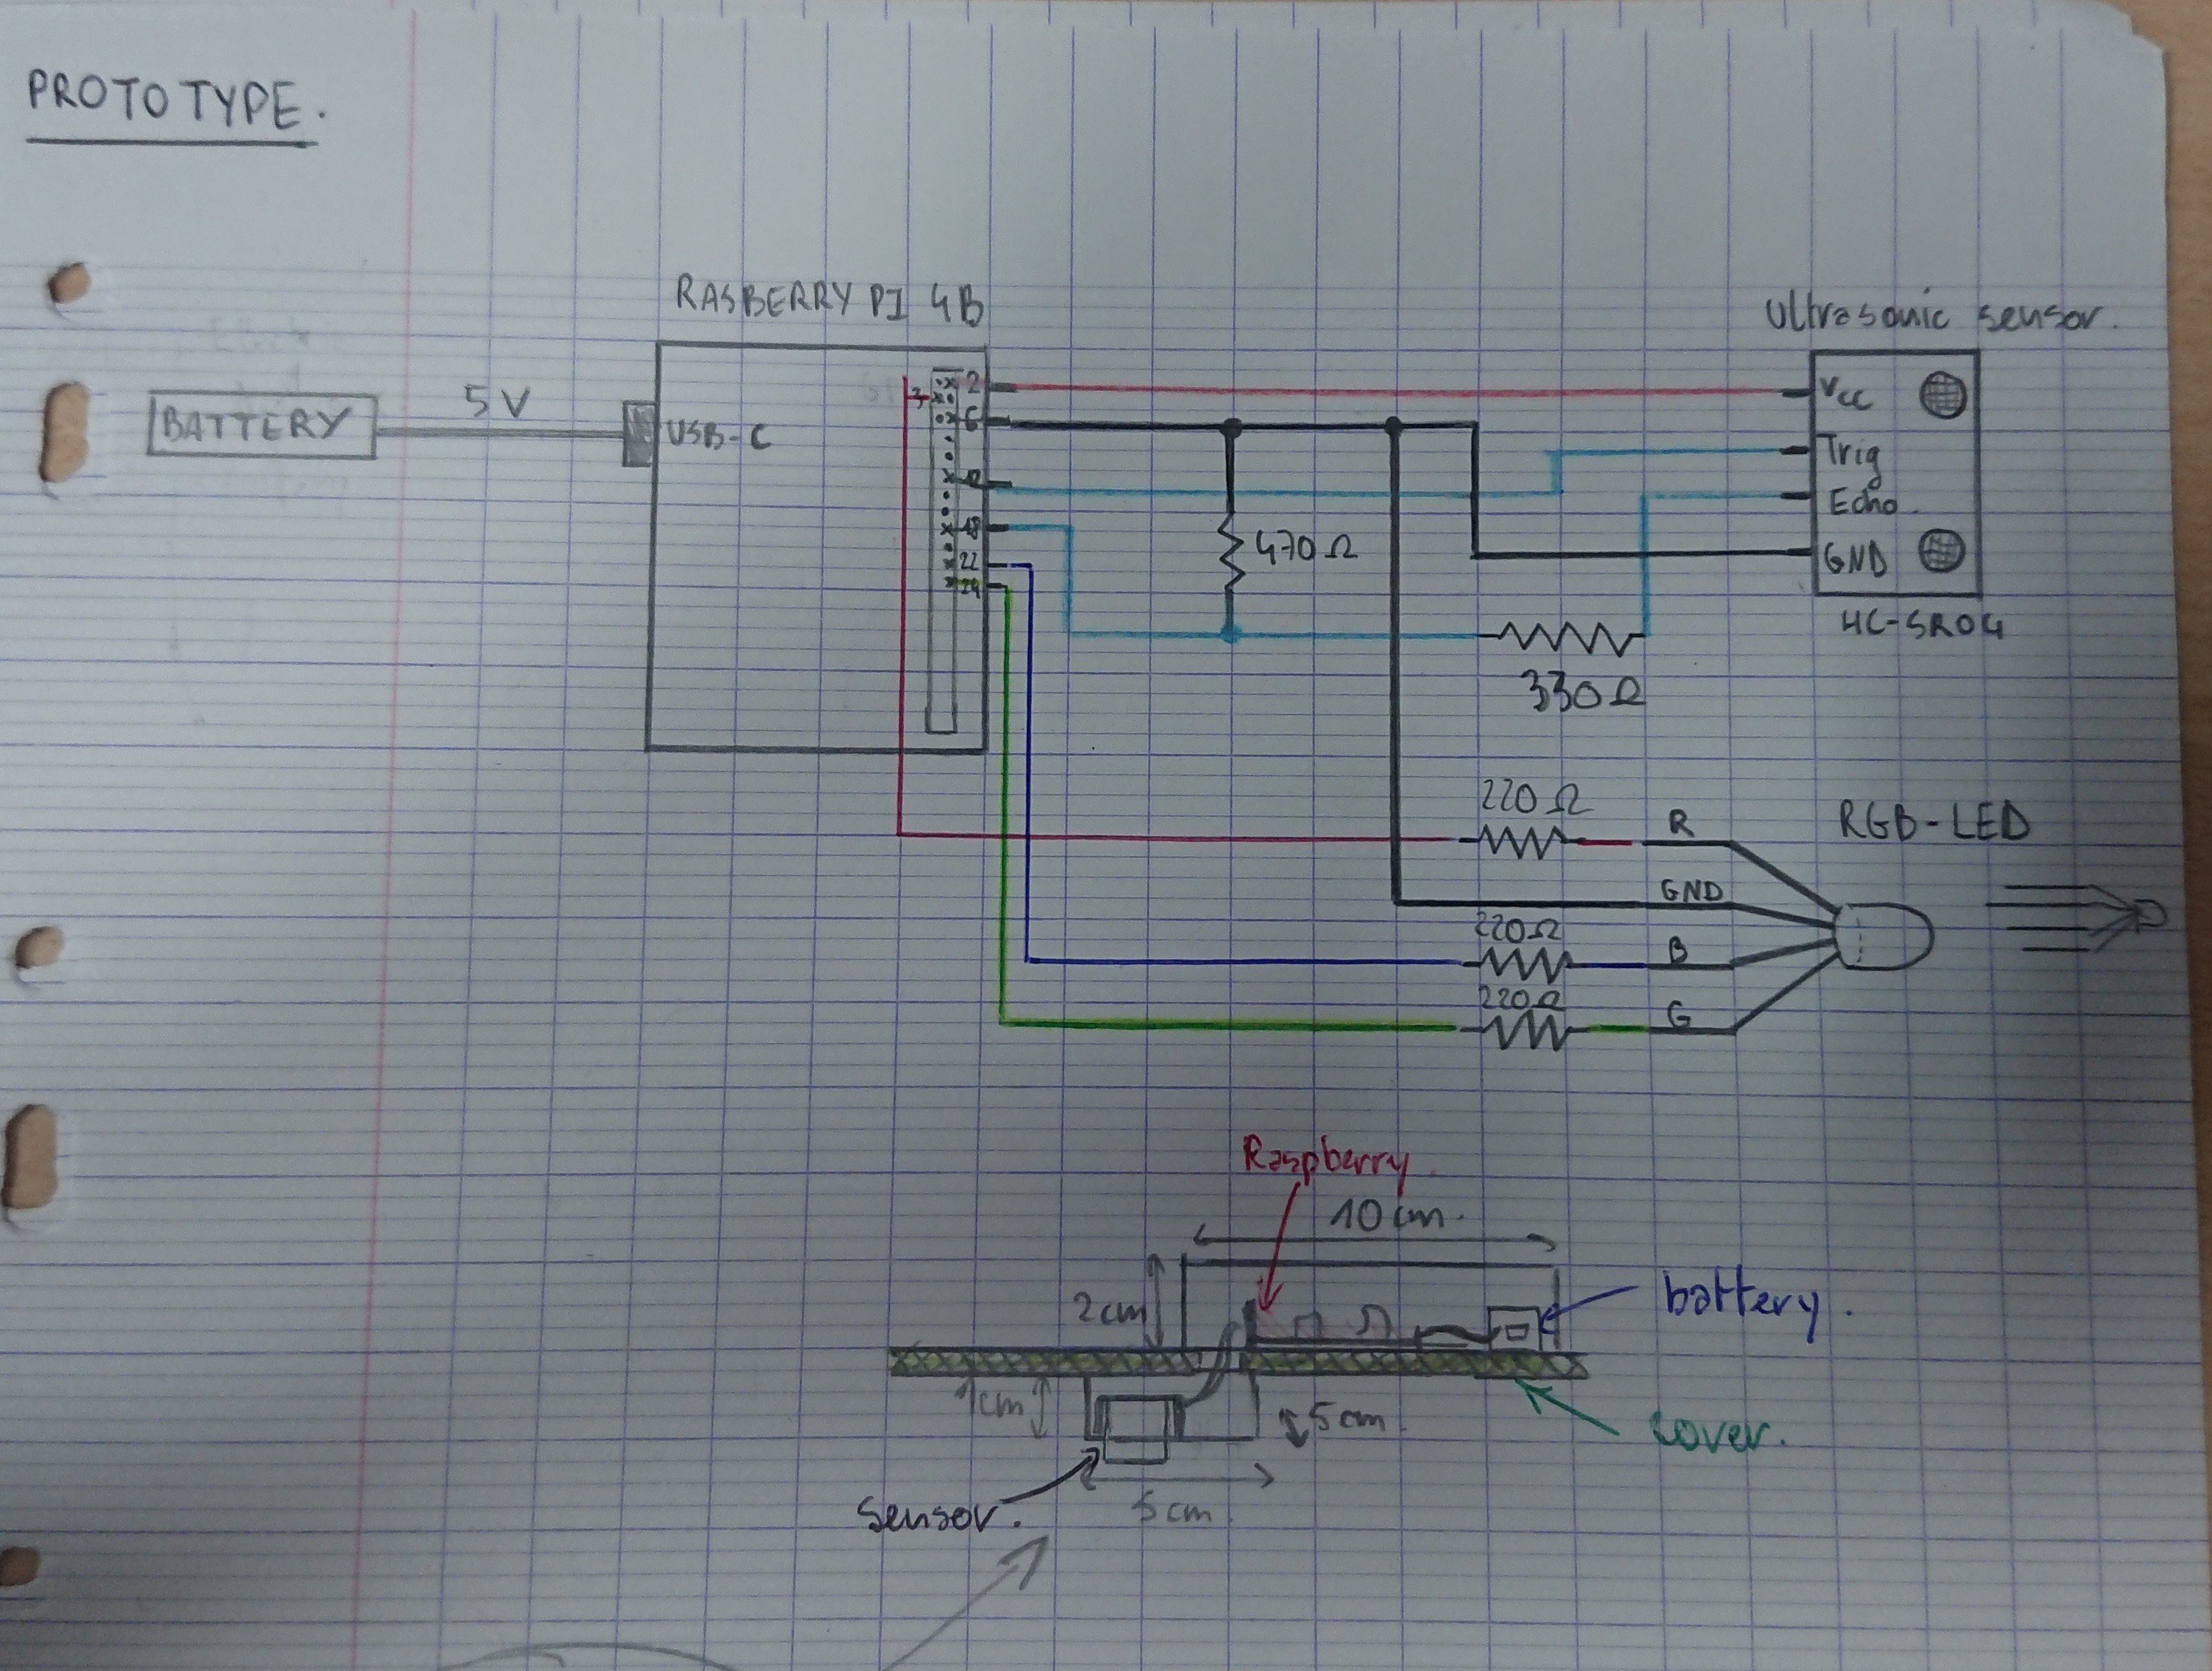
    Then, we started wiring the device to create a first version of the prototype :

    For next week, we'll have to start creating the box and the cover to puit over the trash can, dealing with the material resitance of the box and find a way to fix it.

  • [Session 1] Start of the hackaday project - First sketches

    Antoine04/17/2022 at 10:36 0 comments

    We're having an IoT class at school, and we needed to come up with a idea to help the city department we chose, "the Environmental Dpt".

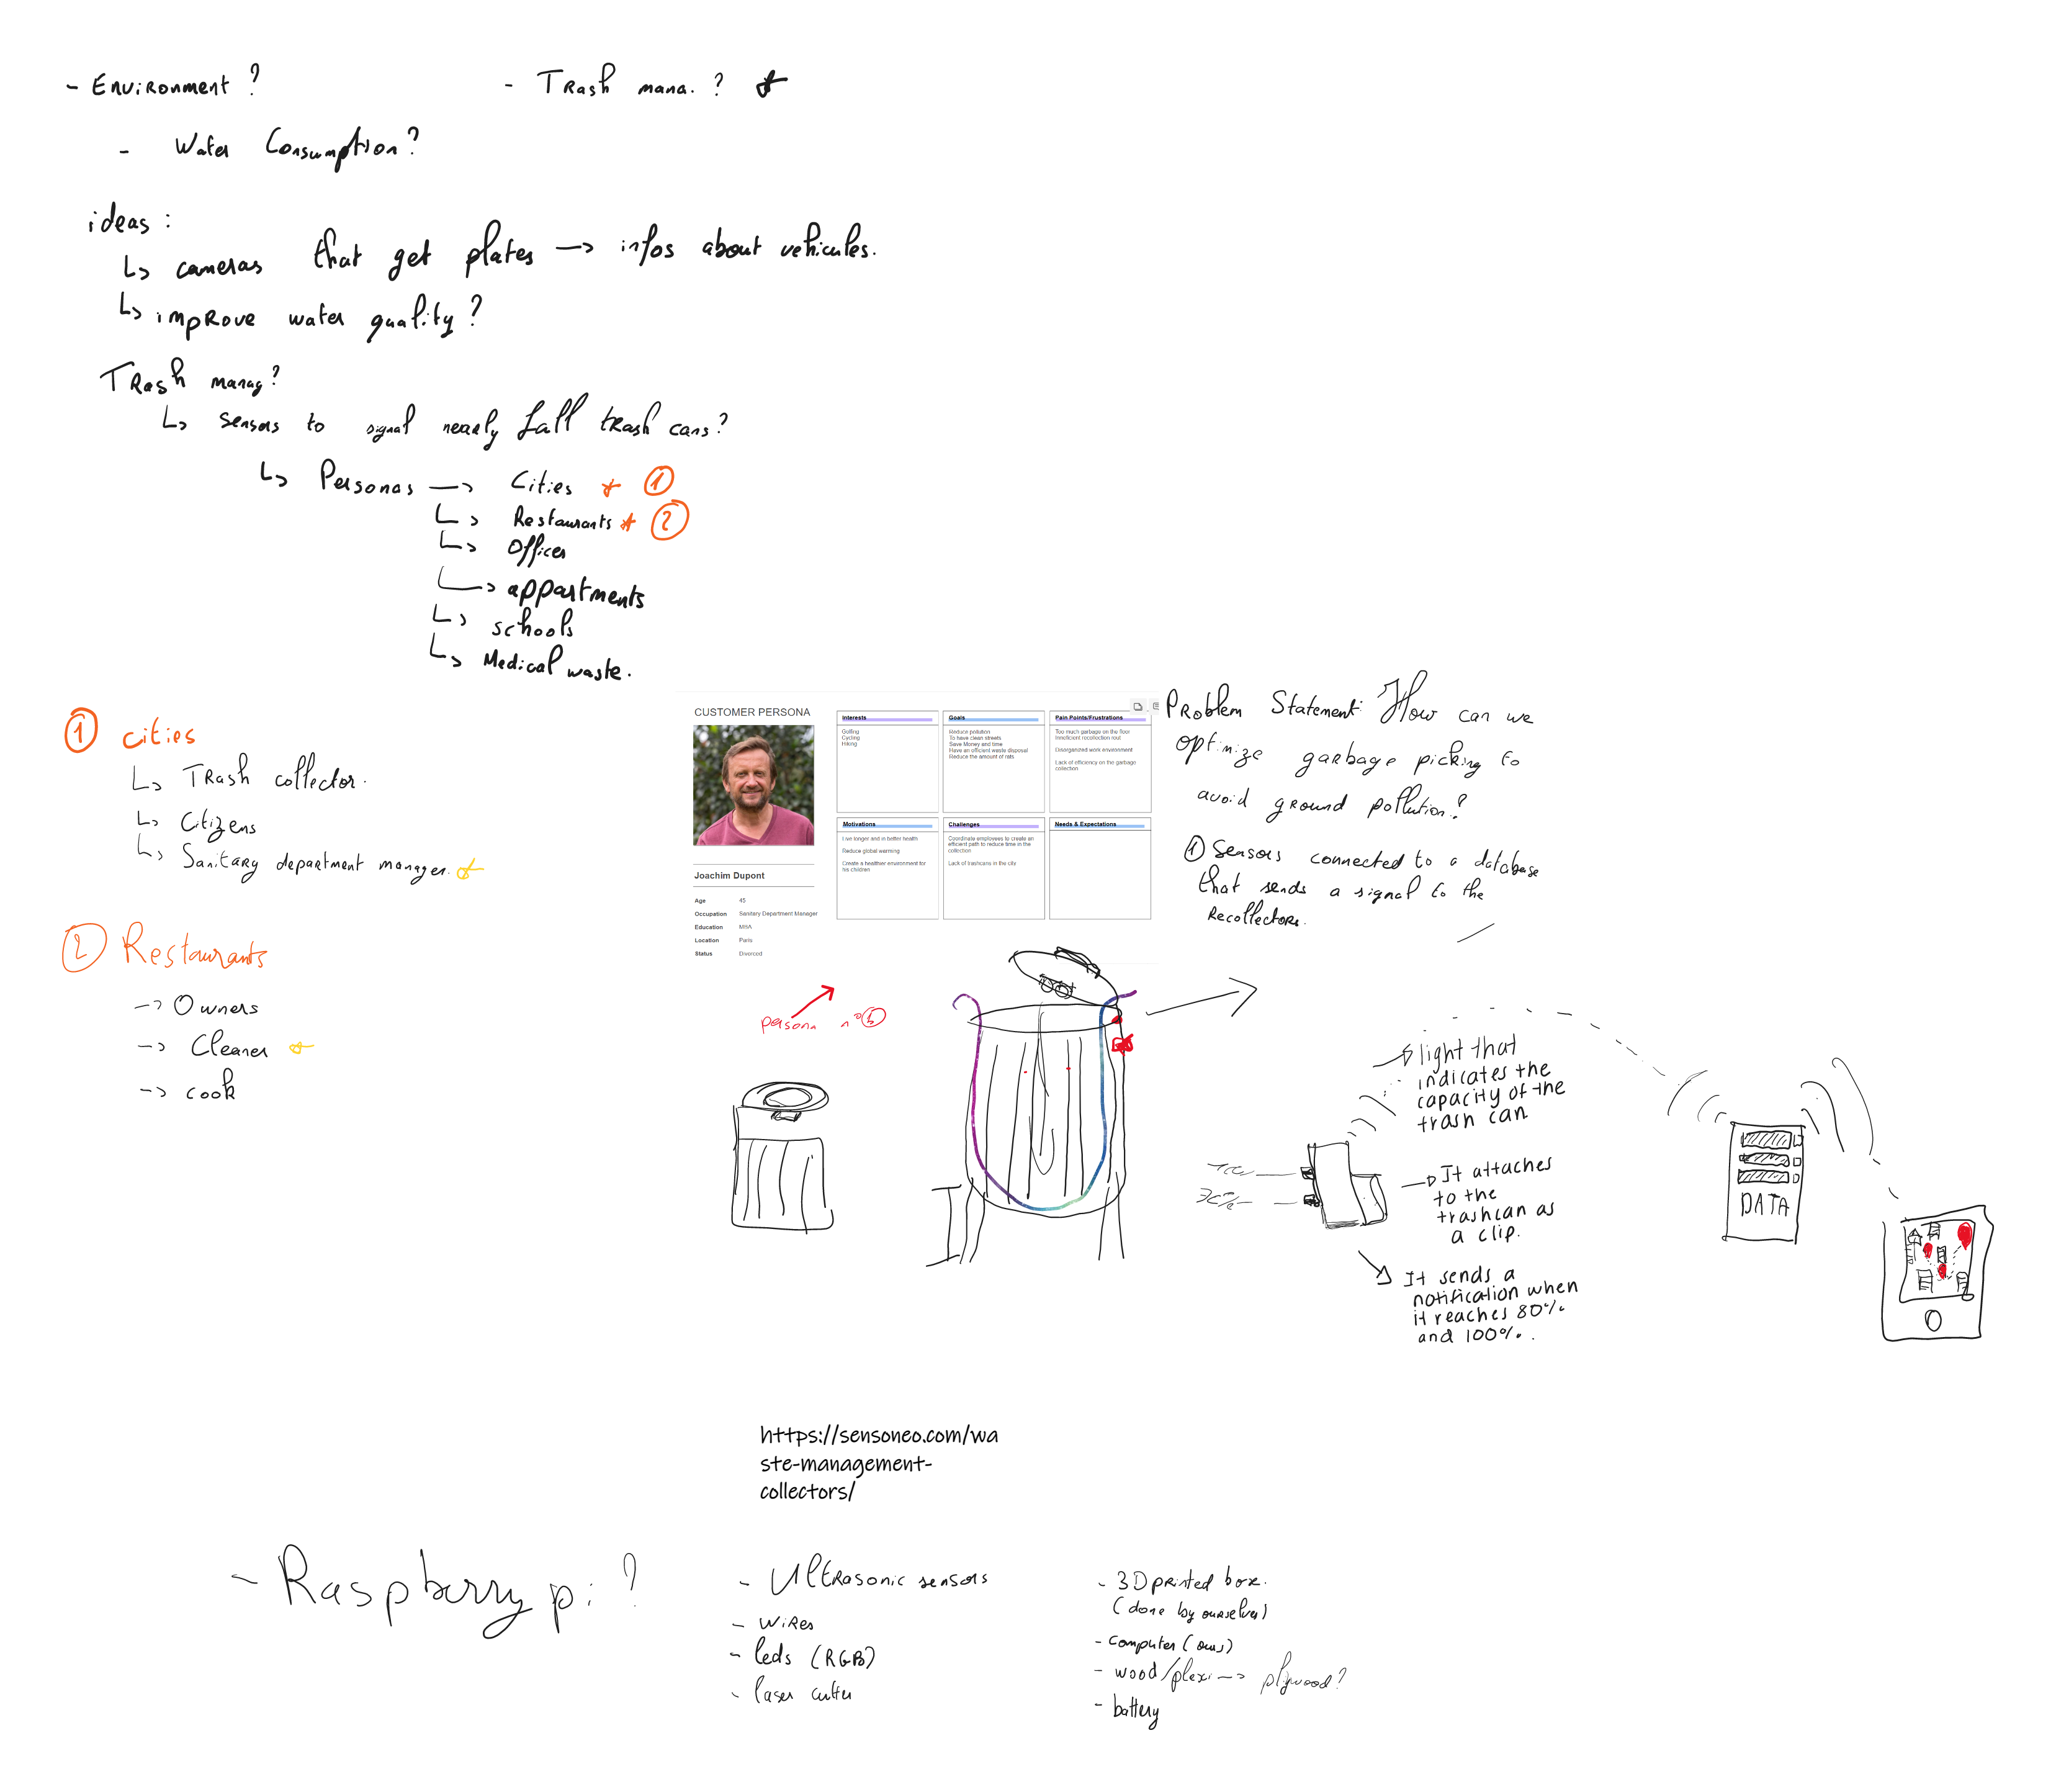
    We thought about focusing on the trash management citywide, made a persona to identify a specific type of clients, and even started sketching the aspect and the features of our project.

    Once we had the outline of the project, we started looking for how to connect the different components together, and we came up with a first handmade wiring diagram.

    We also find out that as we walk through Paris, most of the trash cans don't have a cover so we'll need to think of a way to create one that can fit on most of the bins with our device integrated.

View all 9 project logs

  • 1
    Wiring of the Raspberry Pi 4B

    [Needed : 3x 220/ 1x 750/ 1x 1500 Ω resistors, Raspberry Pi 4B, US-015, LL509RGB, jumper cables, breadboard]

    Using the breadboard, wire the Raspberry Pi following this diagram :

  • 2
    Configuration of the Raspberry Pi

    [Needed : microSD reader, network, USB-C to USB cable, power source]

    The whole configuration process has been explained in this log :  [Extra Session] Focusing on the network and code environment (Raspberry Pi 4)

    Follow those steps but be aware that the configuration is tricky and you might spend a lot of time on it.

  • 3
    Create a database

    [Needed : Google account]

    Create a new database on https://firebase.google.com/ and copy the link (add .json at the end)  :

View all 7 instructions

Enjoy this project?

Share

Discussions

Similar Projects

Does this project spark your interest?

Become a member to follow this project and never miss any updates