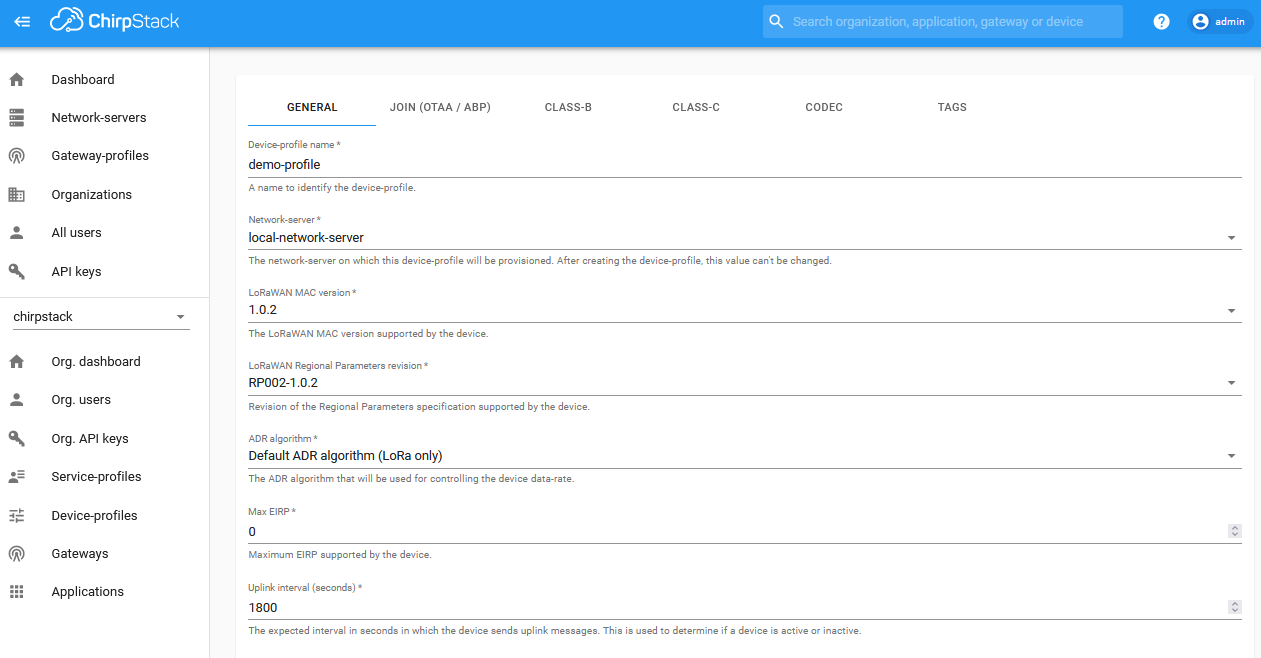
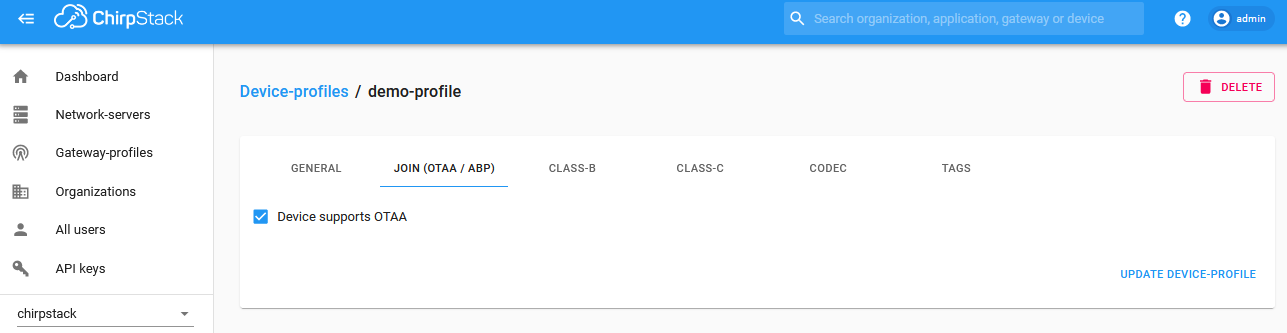
Add a device profile. Settings here might differ based on the LoRaWAN implementation your end-devices use. These settings are for the RN2483 with firmware version 1.0.5. Once you created the profile, edit it and check "Device supports OTAA" under Join.
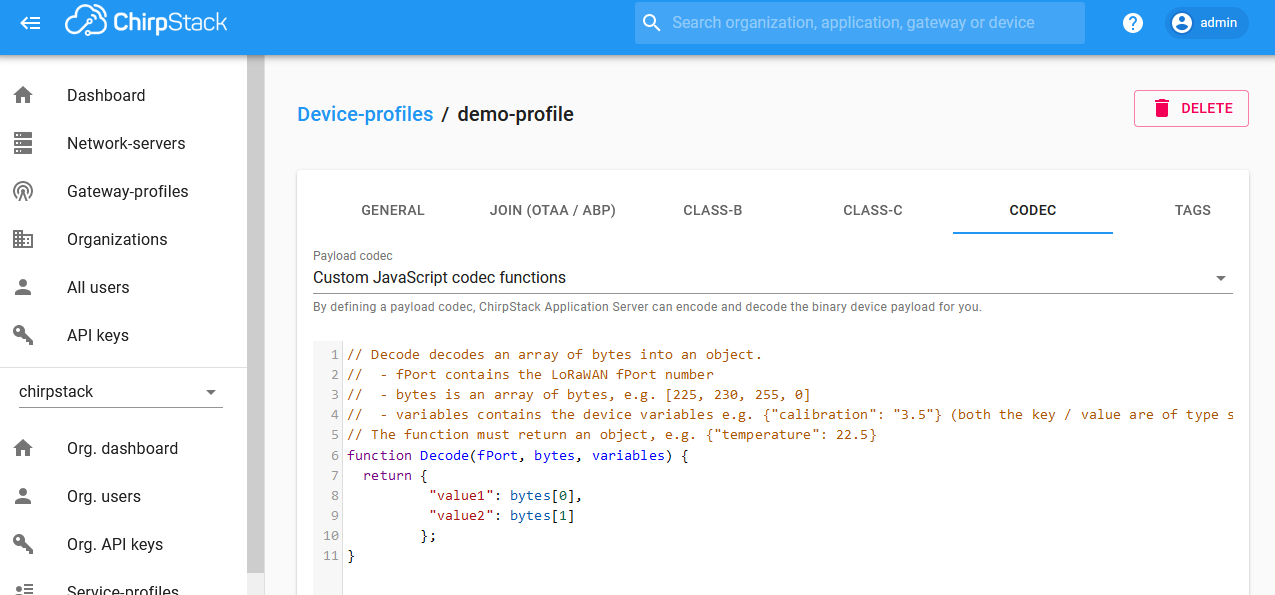
Create a Custom JavaScript codec. These are used to interpret the decrypted byte array coming from the sensor into more meaningful objects that can be forwarded to other pieces of software. We will package the first two bytes into a simple object
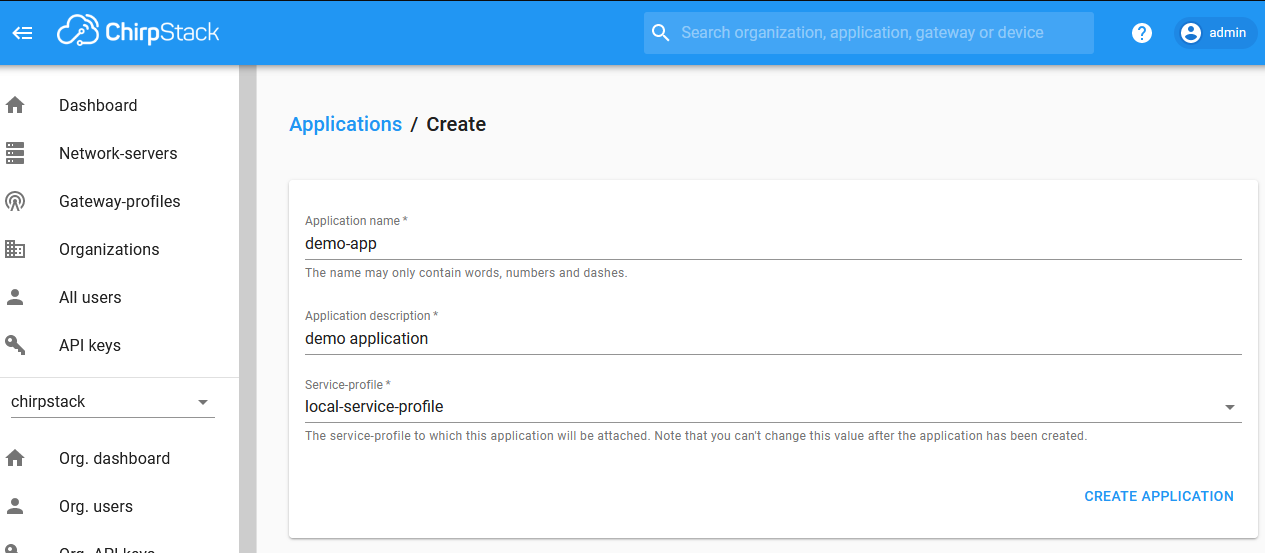
Create an application
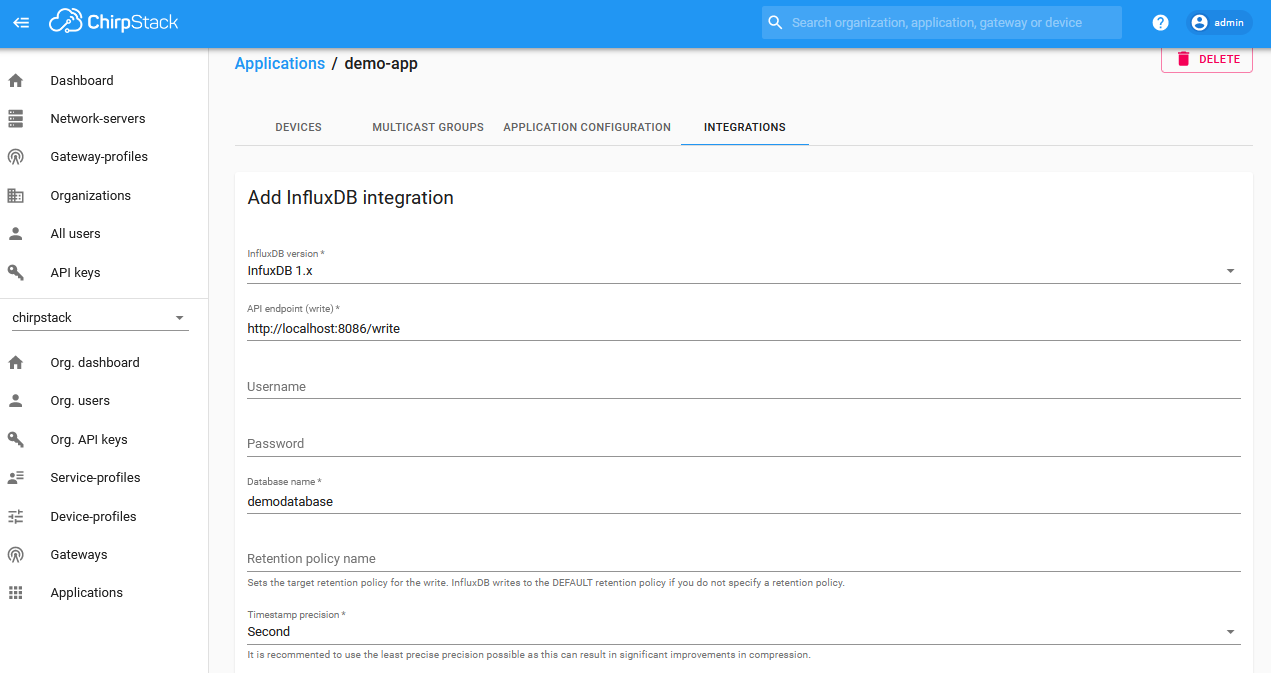
[Optional] Create an InfluxDB integration. This requires that InfluxDB is installed. You will be able to see traffic from your sensor without this, but there will be no data persistency.
[Optional] Create the database in InfluxDB. On your server do
lora@loraserver:~$ influx
Connected to http://localhost:8086 version 1.8.10
InfluxDB shell version: 1.8.10
> create database demodatabase
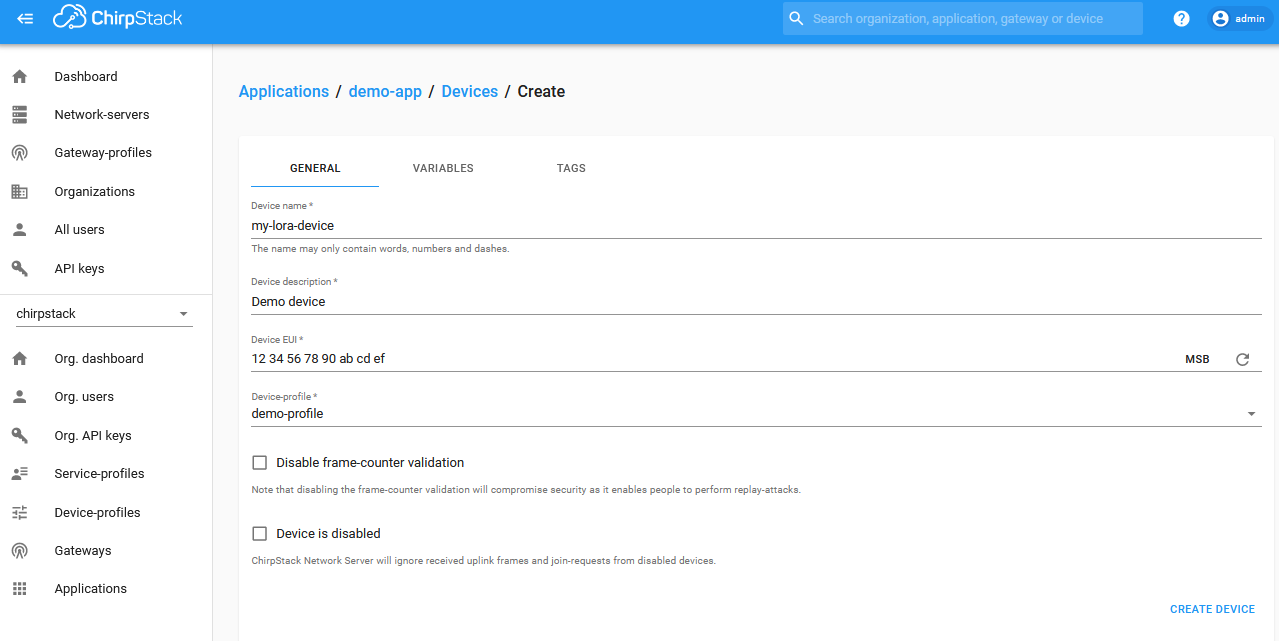
Under the newly created application, create a device. The DeviceEUI should be unique within your network. The RN2483 comes preprogrammed with a unique device EUI that you can use.
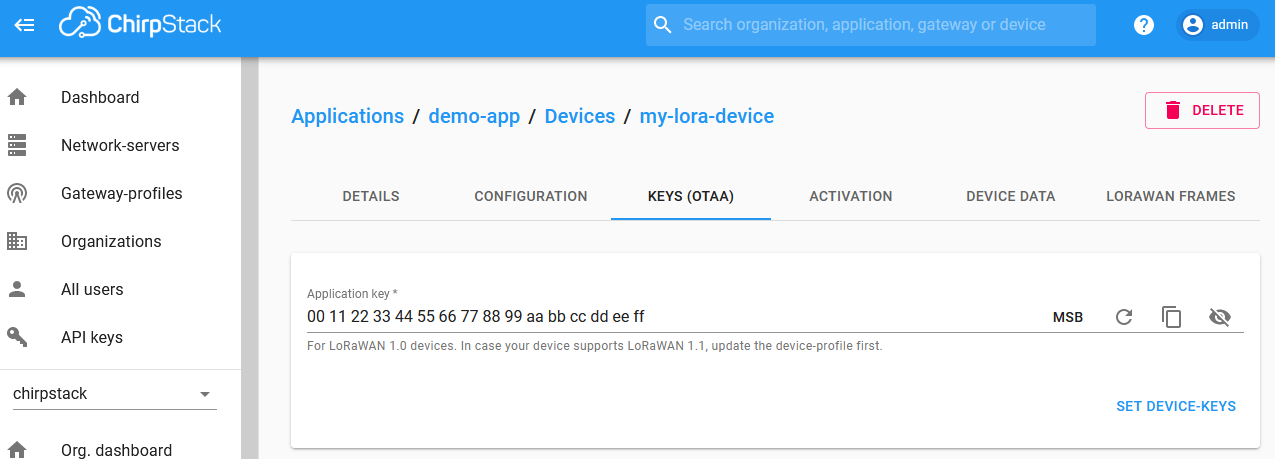
Set the Application key for this device. You can generate a random one from the button on the right
Send some data from your end device. Assuming you are using a RN2483 modem, you can use the follwing commands (modem responses included)
mac set deveui 1234567890abcdef
ok

mac set appkey 00112233445566778899aabbccddeeff
ok

mac join otaa
ok
accepted

mac tx cnf 1 00ff
ok
mac_tx_ok

mac tx cnf 1 01fe
ok
mac_tx_ok

mac tx cnf 1 02fd
ok
mac_tx_ok

mac tx uncnf 1 04bf
ok
mac_tx_ok

mac tx uncnf 1 08f7
ok
mac_tx_ok

mac tx uncnf 1 10ef
ok
mac_tx_ok
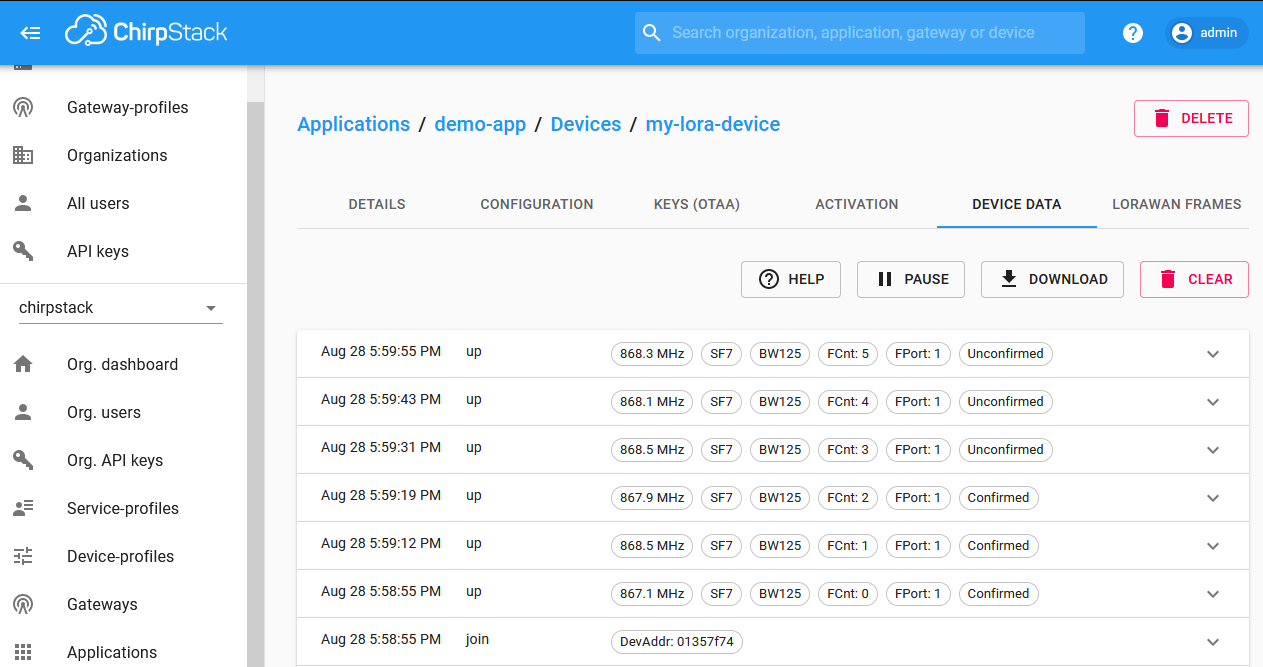
Check that the data can be seen in ChirpStack
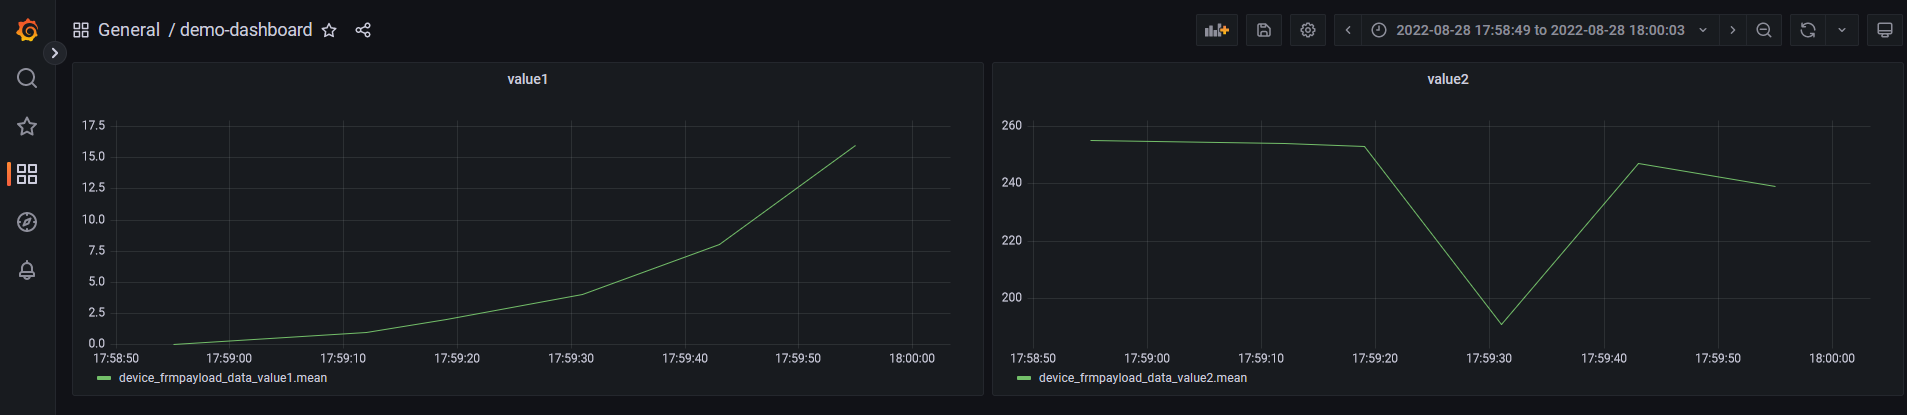
[Optional] Use Grafana to show a plot of the two bytes you sent. You need to set the data source in Grafana appropriately to read from your InfluxDB database
 mihai.cuciuc