Ahmed Oyenuga
-
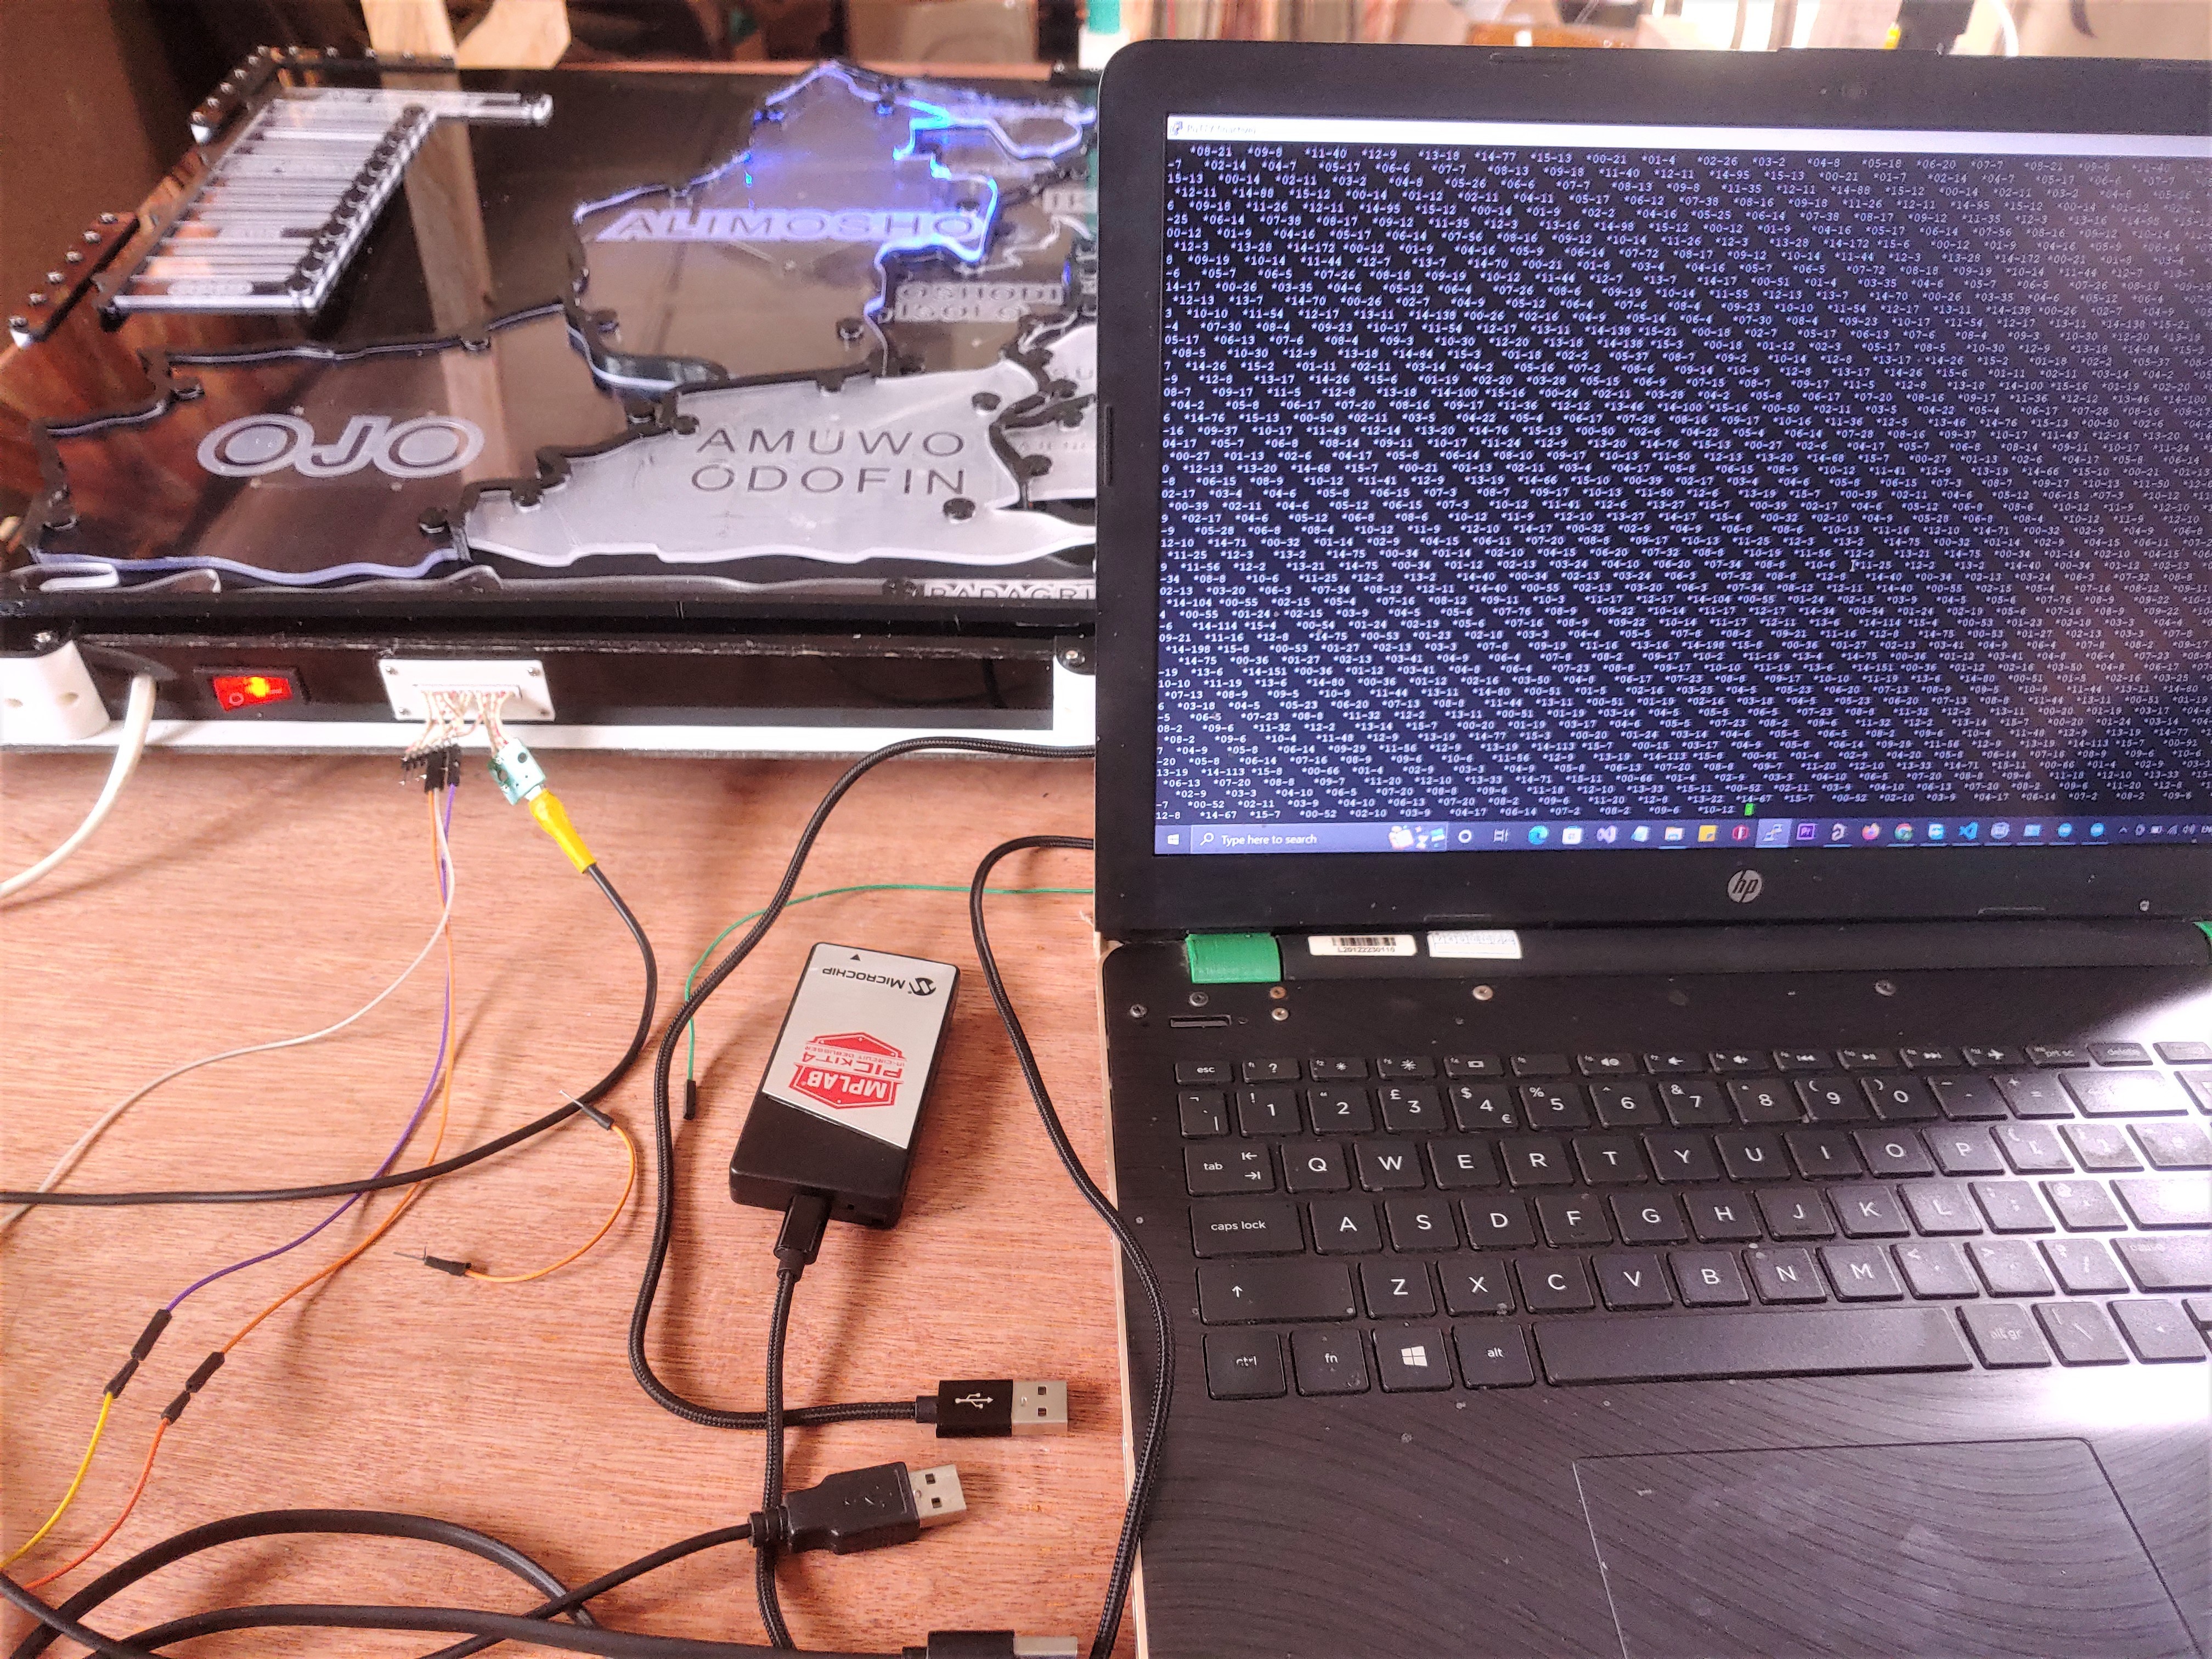
Visualizing Air Quality & GPS Data
10/21/2022 at 15:08 • 0 comments -
Assembling The Air Quality Logger
10/21/2022 at 00:43 • 0 comments...
-
Recalibrating after Framing the Map
10/20/2022 at 20:37 • 0 commentsCapacitive touch sensing is very sensitive, to both physical and electrical changes, so I wasn't surprised to find that touch detection on the map became erratic after I enclosed it, the switching power supply and large aluminum back panel is the likely cause of this problem.
I did anticipate the noise issue which is why I designed a coplanar shield into the touch pads, but I underestimated the severity of the noise and elected not to wire the shield on the pads to ground.
![]()
Fix
To deal with a noisy signal, you first have to record and study it, I implemented an auto-updating touch detection algorithm, by collecting a little signal sample and then recalculating the threshold based on how noisy the sample is, for the spikes in the signal, I implemented a gate to allow only a specific range of values through, and I also used an exponential filter to smooth out the signal, MPLAB'S Data visualization software helped a lot here.
Luckily I thought to break out the SWD pins for programming the capacitive touch controller board to a side on the frame, so I did not have to open up the map to recalibrate it.
See the Project repository to see the full code.
![]()
-
Inside the Map
10/20/2022 at 19:42 • 0 comments...
-
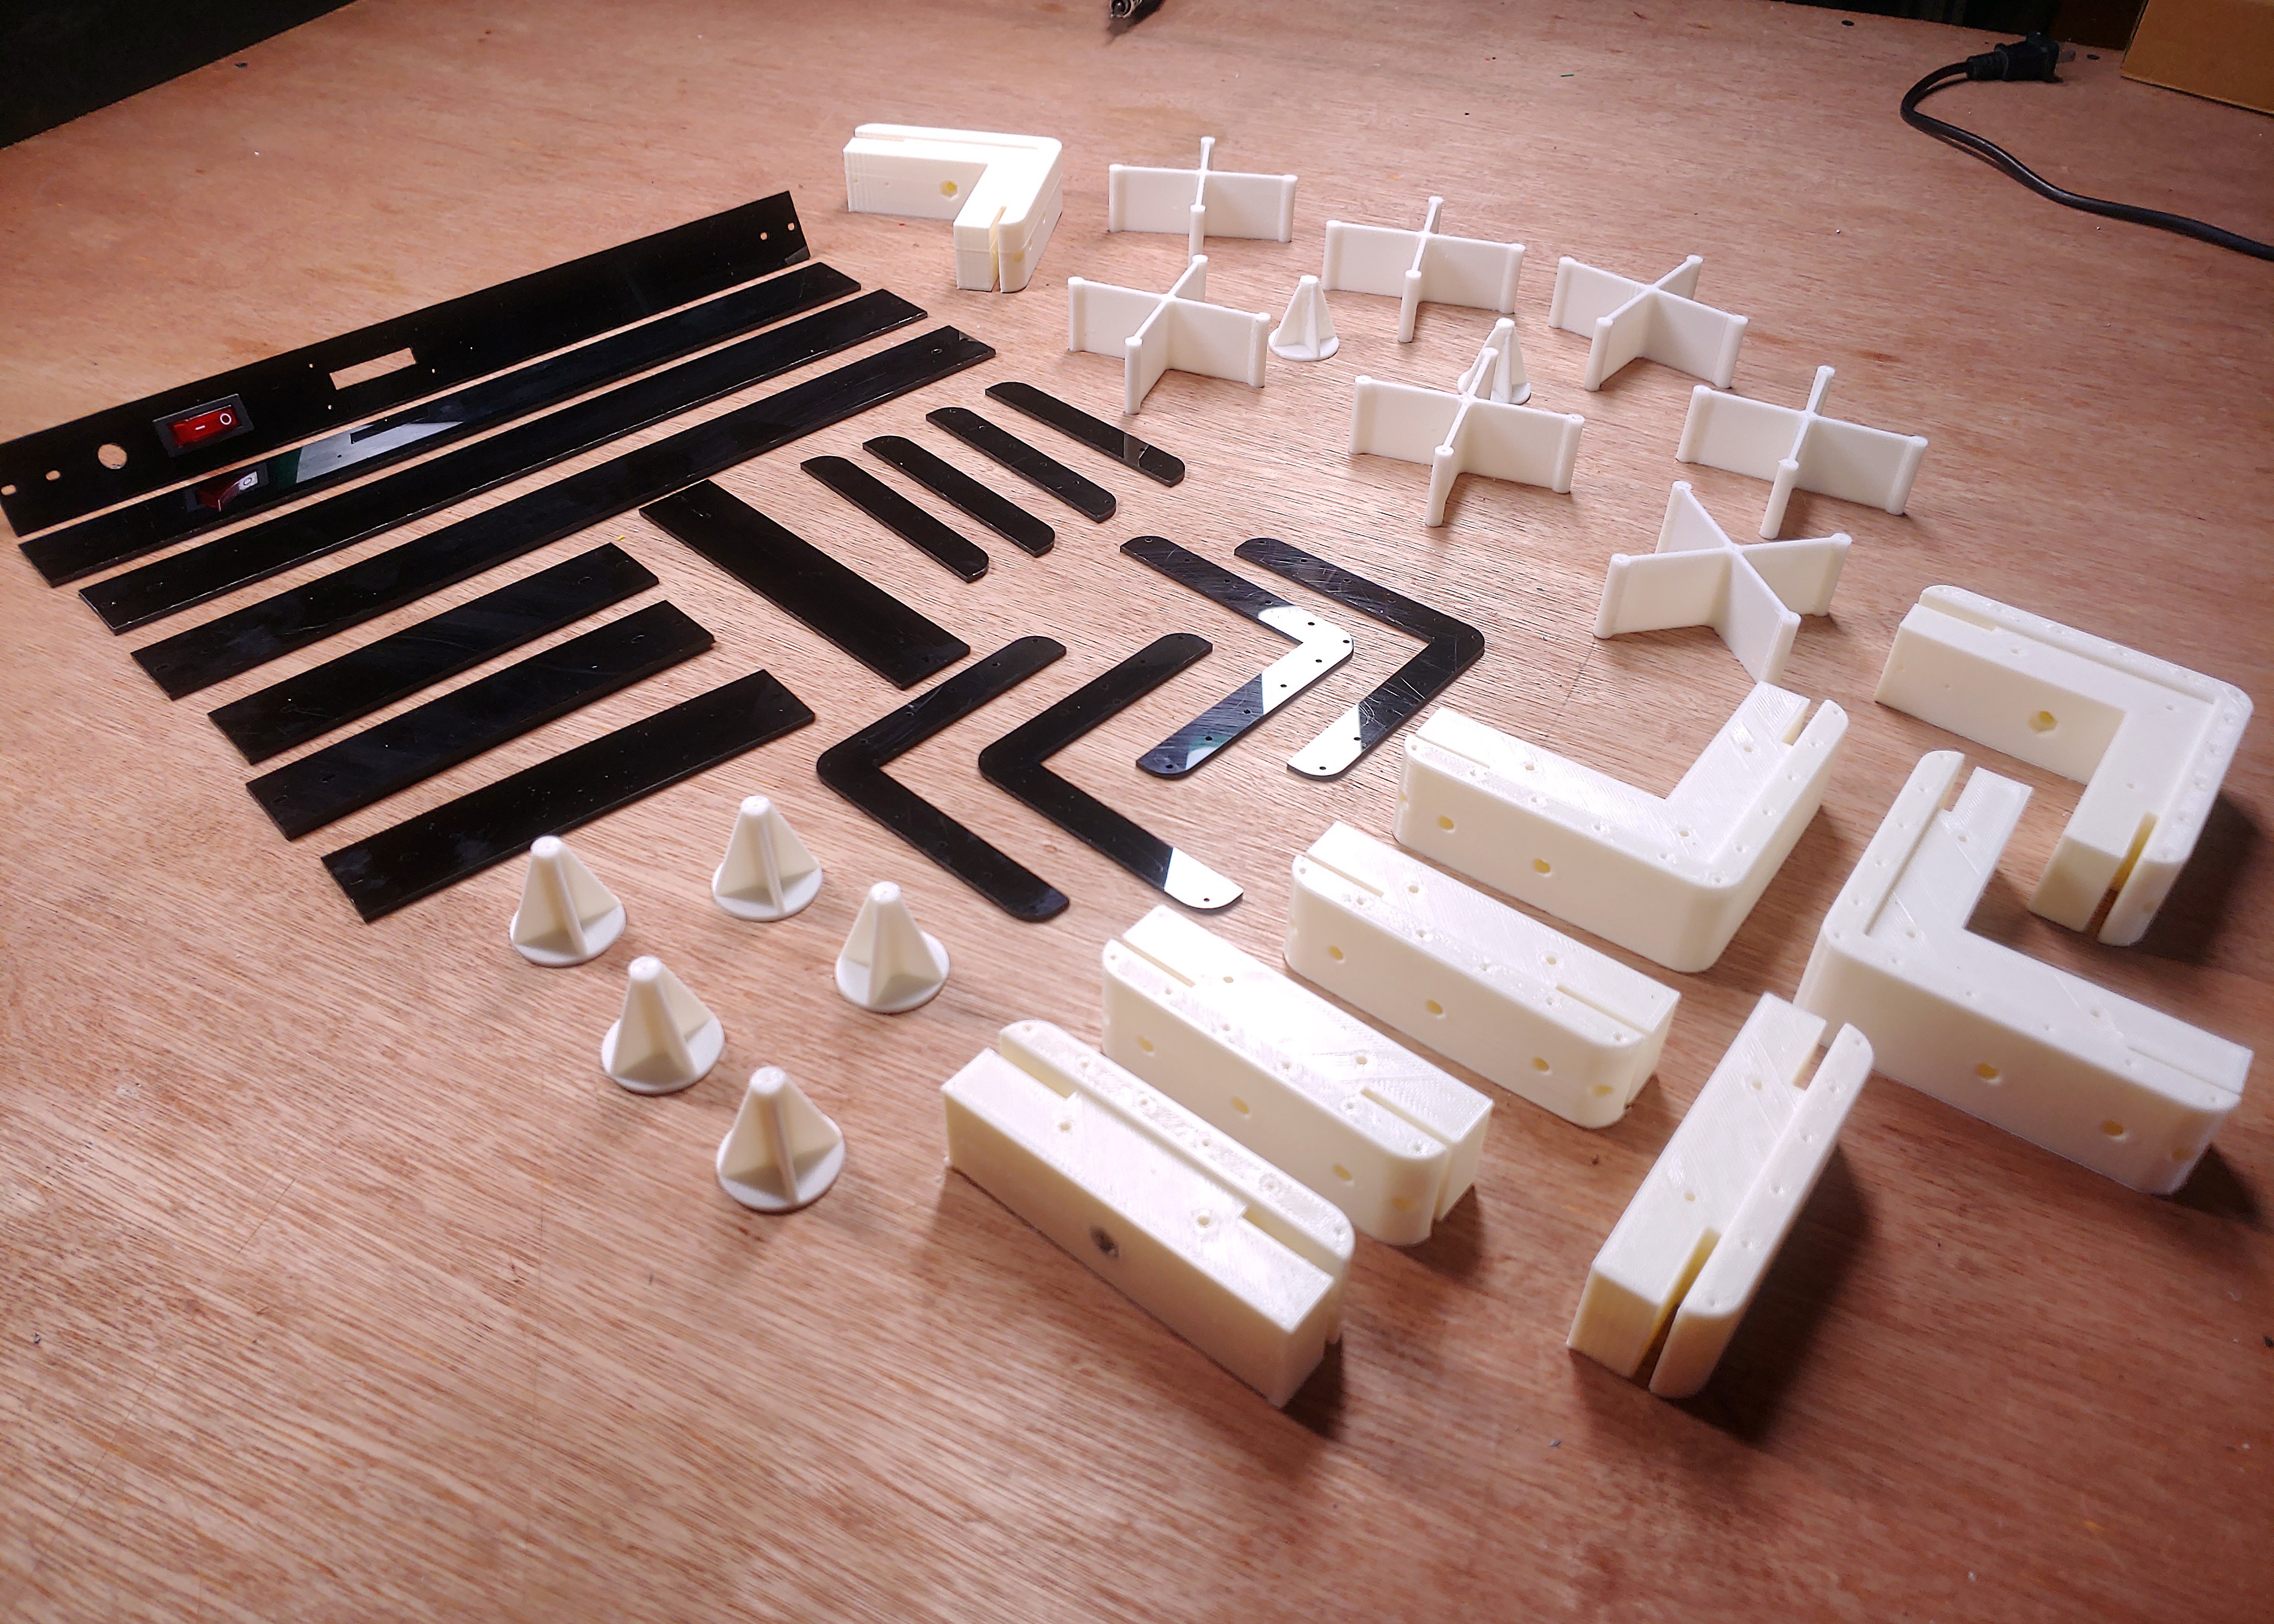
Assembled the Map's Frame
10/13/2022 at 01:49 • 0 commentsI used a combination of 3d printed parts (White parts), CNC cut acrylic, with a 4mm thick aluminum composite board as the back panel to give the map rigidity.
![]()
![]()

Aluminium Composite -
Getting Air Quality Data to the Map & Reverse Geocoding
10/07/2022 at 00:16 • 0 commentsThe Air quality map currently gets all its air quality data from the DesignSpark Environmental Sensor Development Kit (ESDK), the data is being reported via MQTT to the Arduino WIFI 1010 on the map, the map reacts to data on a per area basis, and although I am yet to collect air quality data from most of the locations on the map, I did program random levels for the areas, except for "Ikorodu", which is the area I live in Lagos, so, the data shown for that area is live.
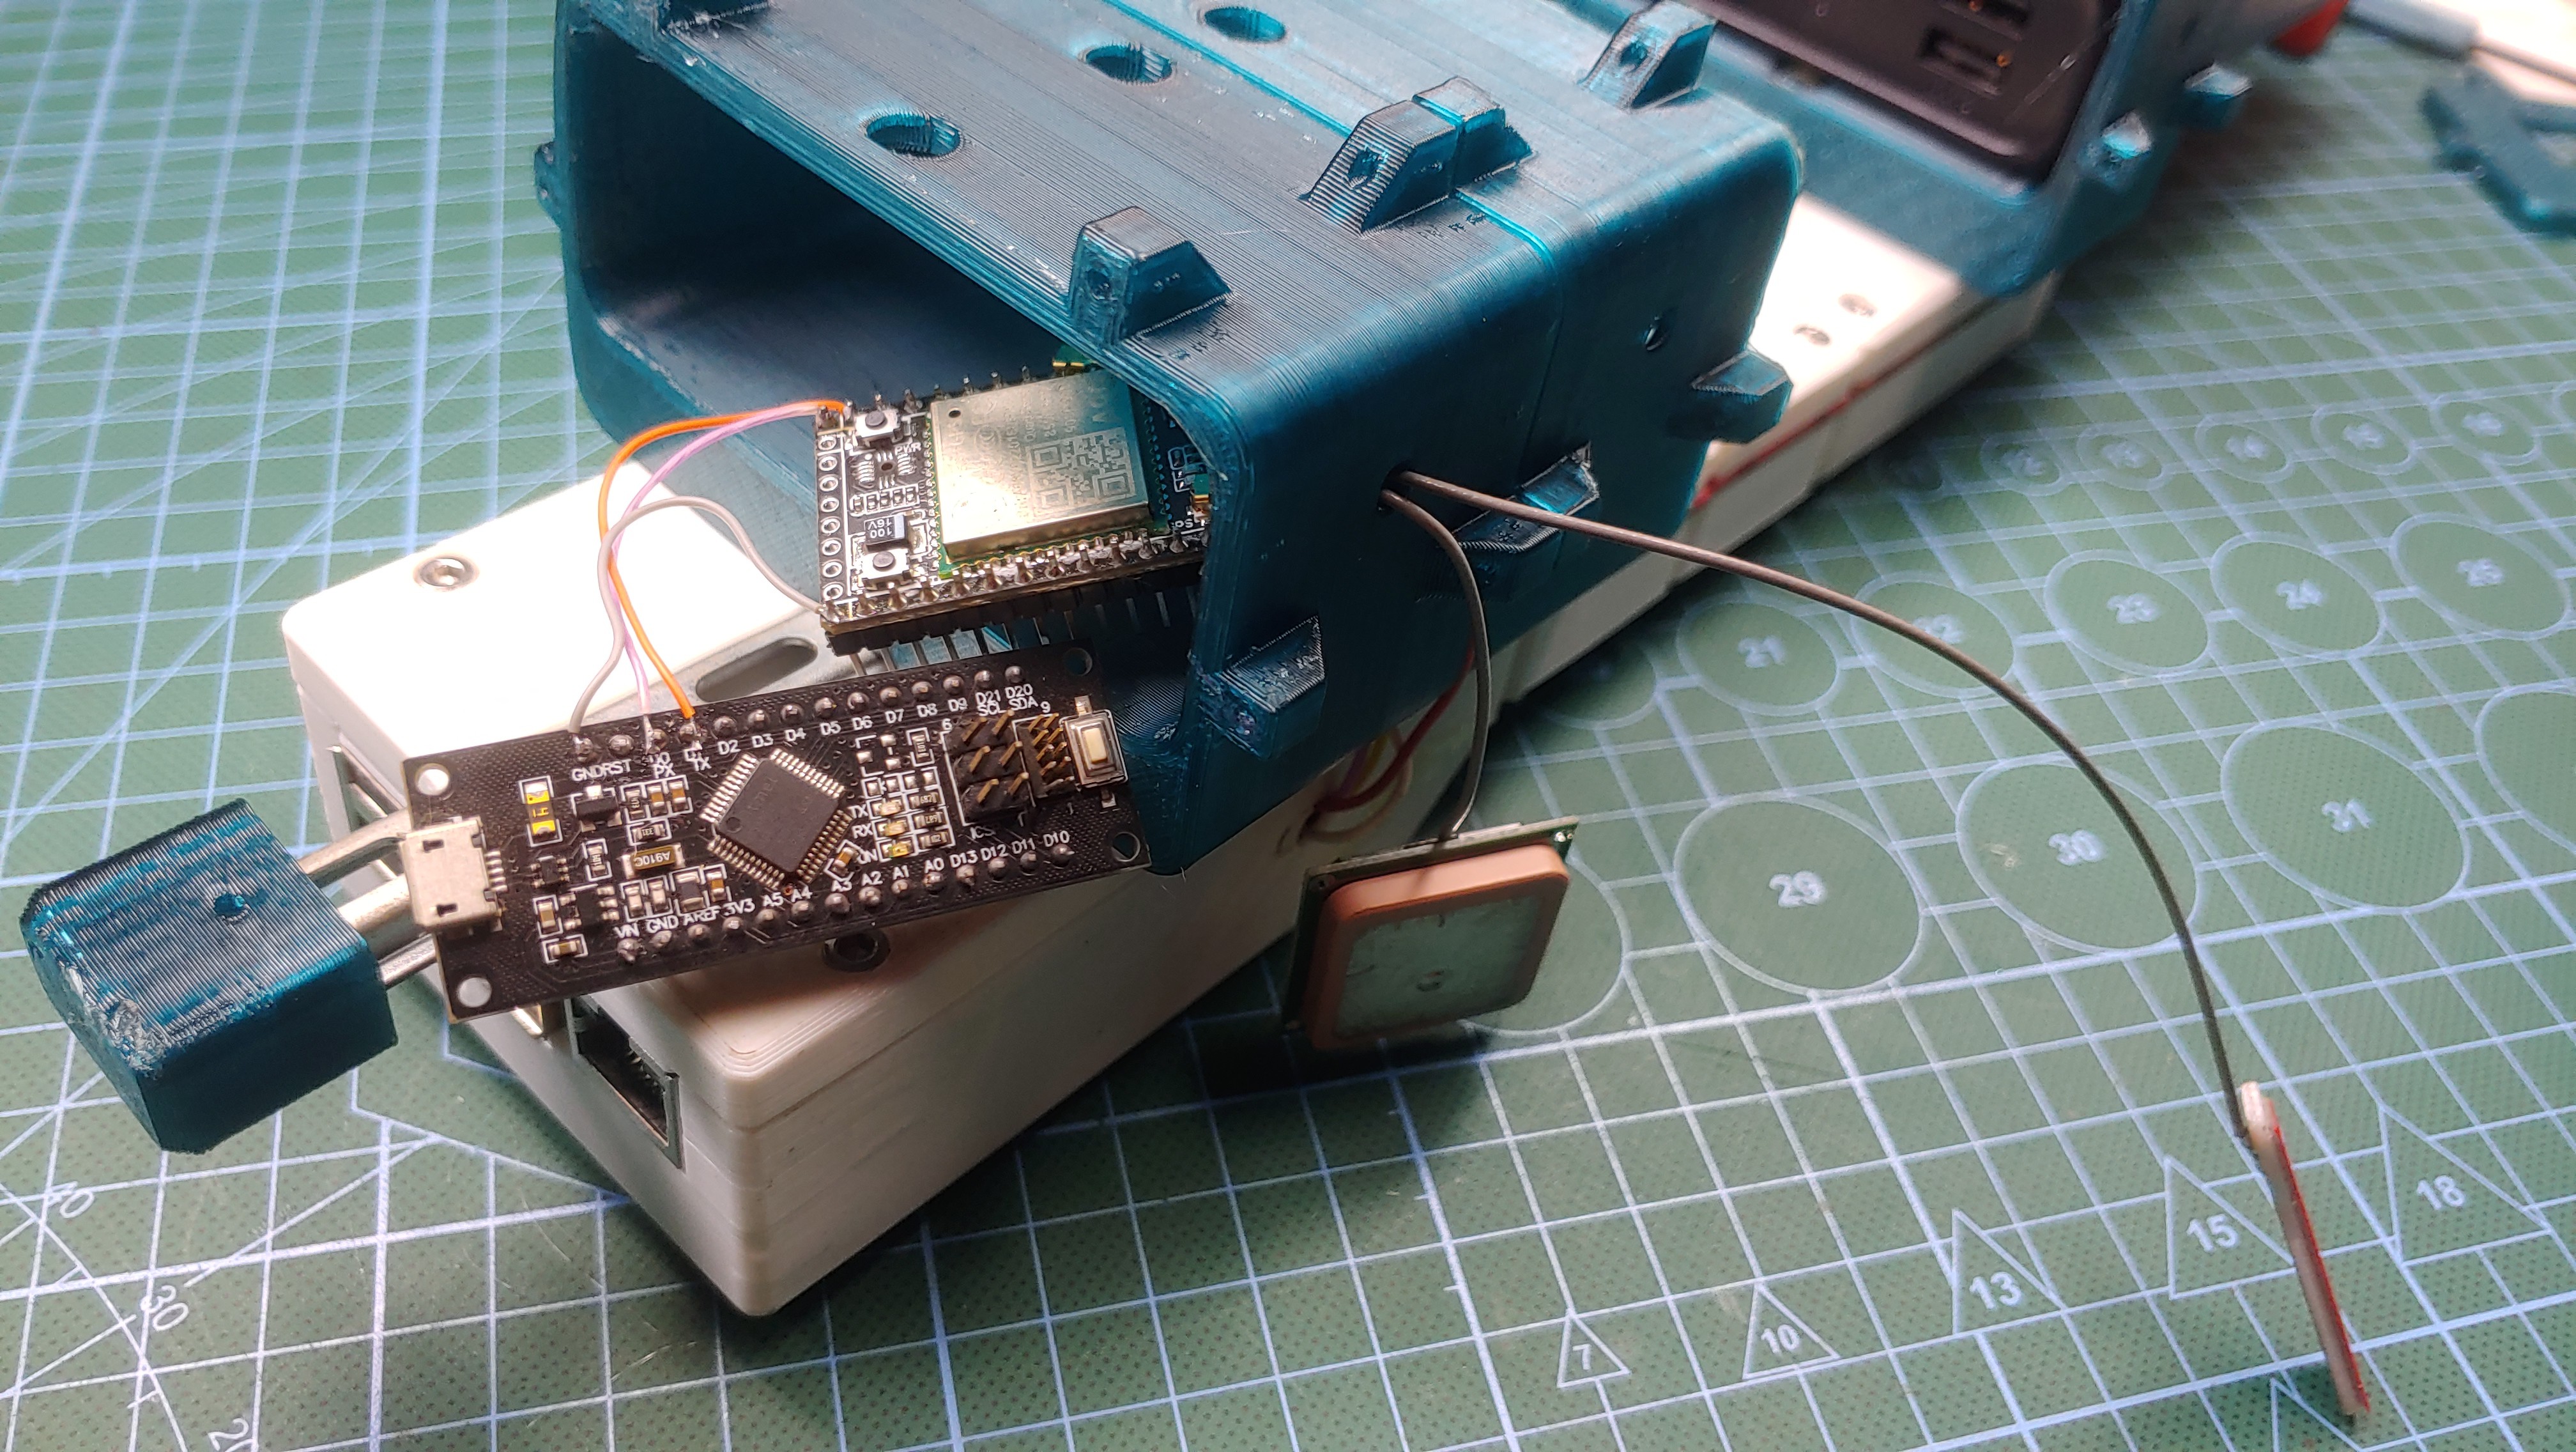
GPS
I hacked an A9G GPRS/GPS module into my air quality sensor which is what I'm currently using to record the GPS location from wherever I collect air quality data, I also created a little python program running on the raspberry pi on the sensor kit, the script combines the air quality data from the sensor with the GPS coordinates from the A9G module.
![]()
Reverse Geocoding
the A9G module gives me the GPS coordinates of the sensor, but the latitude and longitude doesn't really help the air quality map to understand where data is coming from, for that I needed to implement reverse geocoding, which is the process of converting latitude and longitude into readable address. I am using google's geocoding API for this purpose, all I have to do is send a GET request to the URL - https://maps.googleapis.com/maps/api/geocode/json?latlng=” Latitude here”,” Longitude here”&key=” API key here”, and then read and interpret the JSON response in my code.
from unittest import result
import requests

apiquery = "https://maps.googleapis.com/maps/api/geocode/json?latlng=latitude,longitude&key=API_key"

response = requests.get(apiquery)
data = response.json()

for i in data:
    if i == "results":
        try:
            print(data["results"][0]["address_components"][3]["long_name"])
            gotArea = data["results"][0]["address_components"][3]["long_name"]

        except:
            print("got index error")
The python script running on the sensor extracts the area/province name from the reverse geocoding response and appends the string to the air quality data, before sending it off to the
-
Assembling the Interactive Air Quality Map
10/07/2022 at 00:00 • 0 commentsI just finished assembling the Interactive Air Quality Map, Watch the assembly, wiring, and first tests.
-
Cutting the Map Cells
10/06/2022 at 23:57 • 0 commentsOnce I was satisfied with the design of the whole map, I proceeded to cut the first area of the map, but first, I rearranged the cells on the map in a way that fits as many of them on my CNC’s build area.
I was originally going to cut the cells on the map in a way that leaves only the area names untouched, so the entire cell surface except the text is milled down about 0.1mm, but I started to second guess this decision a few cuts in, I did not like the way it looked when lit, and it took way too long using the 1mm endmill I was using. I eventually updated the map design to feature offset texts instead which turned out pretty good.
-
Modeling the Map
10/06/2022 at 23:33 • 0 commentsThere are no two identical places on earth, every area on the map is unique, this is an important point to keep in mind throughout this build, seen as the process used to build up one area on the map will need to be repeated to make up the rest of the areas on the map.
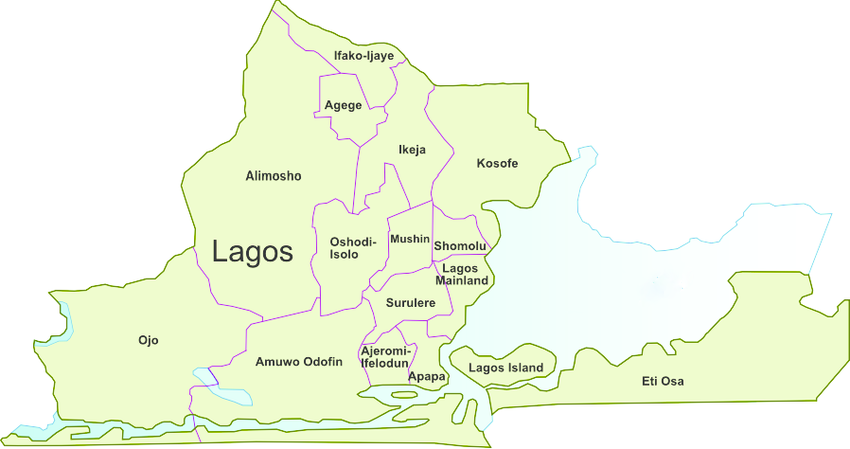
I am building the air quality map for Lagos, the state in Nigeria where I live, Lagos state has 18 main local government areas, so I’ll be making 18 map cells.
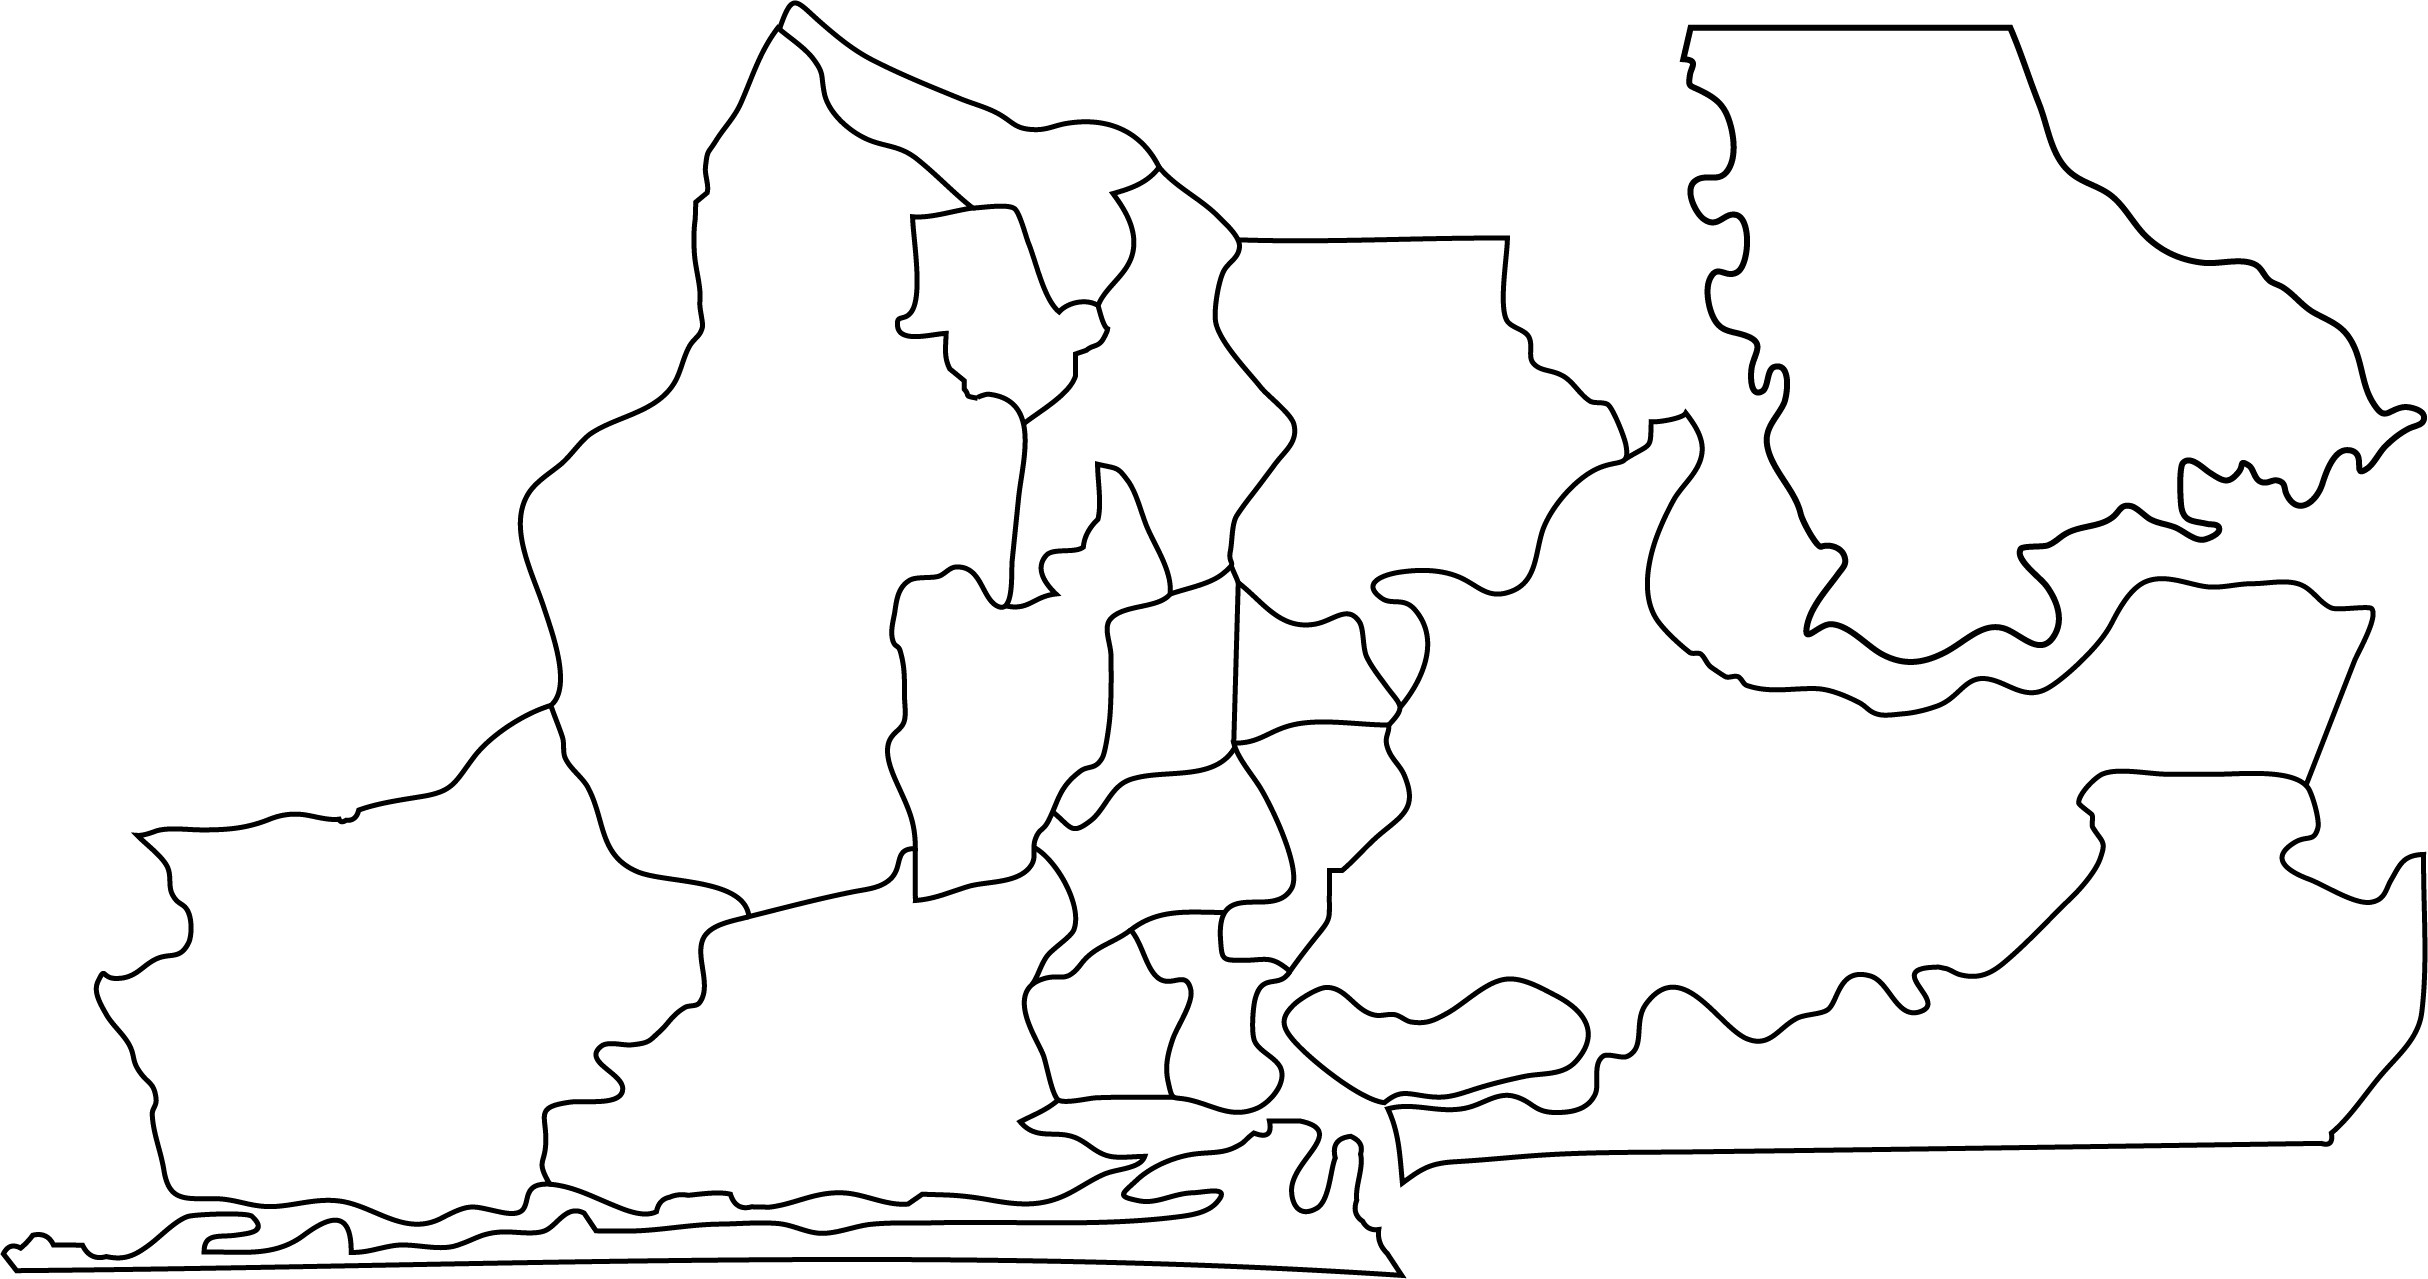
The first step I took was getting an image of the map of Lagos state, the google map is highly detailed and the areas have complex outlines which makes it a bad source for an area image as far as building an air quality map is concerned, although, I did eventually reference google maps for the one area (ikorodu) that was not represented on the free stock image I got off of google, I happen to live in ikorodu and I wasn't about to ignore it.
![]()
The next step is creating a vector outline of the areas on the map image, I found that there's no real shortcut to this process, I just had to trace the image out on a vector graphics software painstakingly, I recommend Inkscape for this, but any vector graphics software should work the same.
![]()
It's important to simplify the paths on the traced image, this process reduces the number of points on the vector paths, doing this will greatly help throughout the modeling process and eventually in the machining process.
Once I had the vector graphics file as an SVG file, I imported it into fusion 360 to begin modeling the map,
I needed to figure out how to individually light the areas represented on the map, with minimal light crossover, the map is going to be built from a combination of 3d printed and CNC cut parts, so I had to consider that, although things might fit together perfectly in CAD, it probably won't work out exactly as designed in real life, so I got creative with the height distribution of the areas on the map, with the added benefit of having the map look more three dimensional, the lower areas on the map will have their touchpads embedded into the back panel, while the raised areas will have separate 3d printed holders for the touchpad.
I tried to model as many of the required features as I could, to minimize any additional manual cutting and drilling, all the required holes should ideally be machined during the CNC cutting process.
![]()
-
Making a Touch Responsive Map Cell
10/06/2022 at 22:08 • 0 commentsThe proximity sensing used on the map is self-capacitance sensing, which simply means each area on the map will have a dedicated touchpad whose proximity will be detected individually.
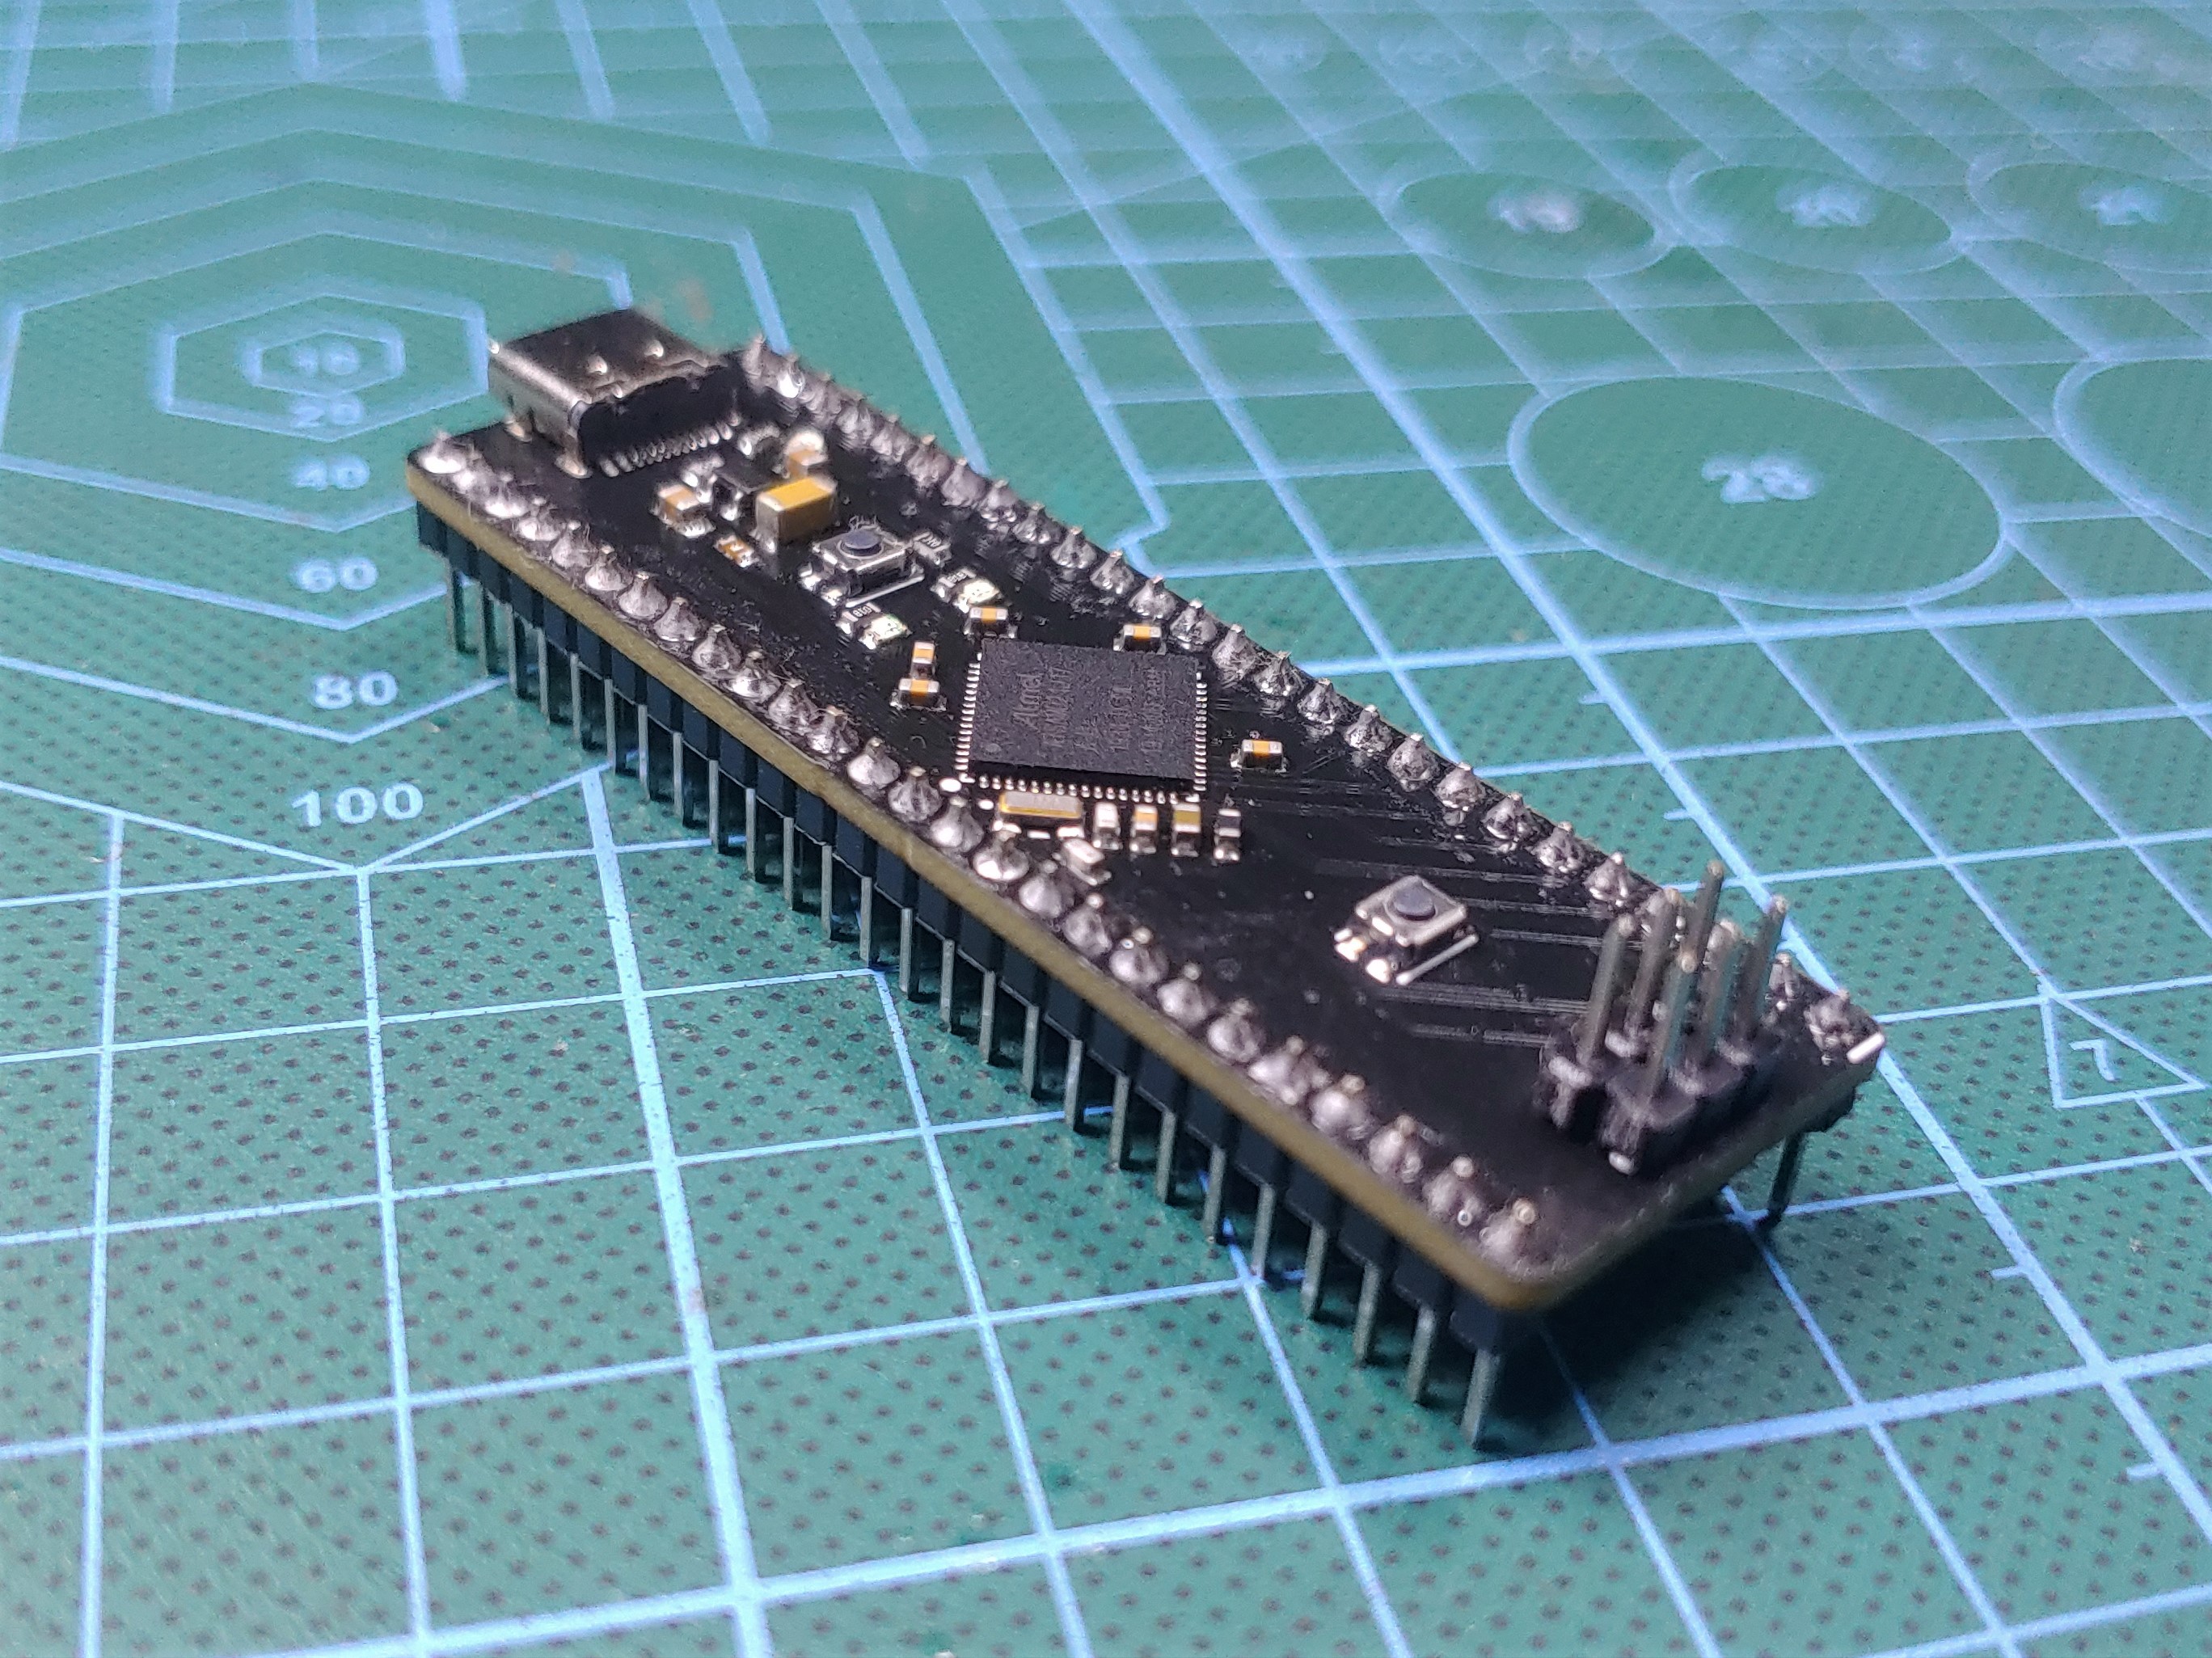
The Capacitive Proximity Controller
I originally planned to use an Arduino Zero board to control the proximity sensing on the map, I chose the zero because it features the ATSAMD21G18 chip, a microcontroller from Microchip that has a capacitive sensing module built-in, but I realized I had a different chip, the ATSAMD21J17 which I bought for a different project, this chip is part of the ATSAMD21 family of microcontrollers, so it also features a capacitive sensing module, with the added advantage of having more pins and hence more capacitive touch channels. I designed a very basic development board using this chip,
![]()
Board files - https://github.com/ahmsville/ATSAMD21J17-DEV-BOARD
Pads
the areas on a map usually have different shapes, and sizes, I needed to figure out to put a capacitive touchpad behind each cell on the map, for this I decided to design two custom PCBs, the board is just a simple square board with a circular pad in the center, I made the board in two sizes, 50x50mm and 20x20mm, the larger pad will go behind the larger area on the map, while the small areas will have the small pad.
![]()
The Interactive Air Quality Map
A Physical Touch Reactive Map that shows the Air Quality of a location