Capt. Flatus O'Flaherty ☠
-
XGboost Code Tested
04/29/2023 at 14:36 • 0 commentsI found some nice code for testing XGboost classification. It was a bit out of date, but with some judicious tweaking I managed to bring it up to date and work nicely.
#!/usr/bin/env python
# cd /home/flatus/Documents/solar_harvester/swarm_predicter && python3 xgboost_test_07.py

# Data:
# https://www.kaggle.com/datasets/liujiaqi/hr-comma-sepcsv?select=HR_comma_sep.csv

import warnings
warnings.filterwarnings("ignore")
warnings.filterwarnings( "ignore", module = "matplotlib\..*" )
warnings.filterwarnings( "ignore", module = "xgboost\..*" )

import pandas as pd
import numpy as np
import xgboost as xgb
from sklearn.model_selection import train_test_split
import matplotlib.pyplot as plt
from sklearn.preprocessing import LabelEncoder
from sklearn.metrics import confusion_matrix
from termcolor import colored

print(colored("Start", 'blue'))
# print(colored('The Accuracy on Test Set is: ', 'blue')

df = pd.read_csv('/home/flatus/Documents/solar_harvester/swarm_predicter/HR_comma_sep.csv')
print(df.head())

#data process
X = df[['satisfaction_level', 'last_evaluation', 'number_project', 'average_montly_hours', 'time_spend_company', 'Work_accident', 'promotion_last_5years', 'sales', 'salary']]
y = df['left']

# Extract text features
cats = X.select_dtypes(exclude=np.number).columns.tolist()

# Convert to Pandas category
for col in cats:
   X[col] = X[col].astype('category')

# Splitting the dataset into the Training set and Validation set
Xt, Xv, yt, yv = train_test_split(X, y, test_size = 0.25, random_state = 0)
# dt = xgb.DMatrix(Xt.as_matrix(),label=yt.as_matrix())
# dv = xgb.DMatrix(Xv.as_matrix(),label=yv.as_matrix())

dt = xgb.DMatrix(Xt, yt, enable_categorical=True)
dv = xgb.DMatrix(Xv, yv, enable_categorical=True)


#Build the model
params = {
    "eta": 0.2,
    "max_depth": 4,
    "objective": "binary:logistic",
    "silent": 1,
    "base_score": np.mean(yt),
    'n_estimators': 1000,
    "eval_metric": "logloss"
}
model = xgb.train(params, dt, 3000, [(dt, "train"),(dv, "valid")], verbose_eval=200)

#Prediction on validation set
y_pred = model.predict(dv)

# Making the Confusion Matrix
cm = confusion_matrix(yv, (y_pred>0.5))
print(colored('The Confusion Matrix is: ', 'red'),'\n', cm)

# Calculate the accuracy on test set
predict_accuracy_on_test_set = (cm[0,0] + cm[1,1])/(cm[0,0] + cm[1,1]+cm[1,0] + cm[0,1])
print(colored('The Accuracy on Test Set is: ', 'blue'), colored(predict_accuracy_on_test_set, 'blue'))


# Based on the model we made, we can predict a employee whether he may leave or not after inputing his informaion:
print("")
print("Now make a single prediction: ")

satisfaction_level = 0.38
last_evaluation = 0.53
number_project = 2
average_montly_hours = 137
time_spend_company = 3
Work_accident = 0
left = 1   # Dont actually need this one as this is what we're trying to predict.
promotion_last_5years = 0
sales = "sales"
salary = "low"

# Make prediction:

# Use a dictionary type:
dict_ = {'satisfaction_level': satisfaction_level, 'last_evaluation': last_evaluation, 'number_project': number_project, 'average_montly_hours': average_montly_hours, 'time_spend_company': time_spend_company, 'Work_accident': Work_accident, 'left': left, 'promotion_last_5years': promotion_last_5years, 'sales': sales, 'salary': salary}
my_HR_test = pd.DataFrame([dict_])

# Get rid of the 'left' column:
my_HR_test = my_HR_test.drop('left', axis=1)

# Extract text features
cats = my_HR_test.select_dtypes(exclude=np.number).columns.tolist()

# Convert to Pandas category
for col in cats:
   my_HR_test[col] = my_HR_test[col].astype('category')

my_HR_test = xgb.DMatrix(my_HR_test, enable_categorical=True)

# Make prediction
new_prediction = model.predict(my_HR_test)

print("new prediction: ",new_prediction)

if(new_prediction > 0.5):
    print(colored("This employee will leave!", 'blue'))
else:
    print(colored("This employee will not leave!", 'green'))
The key to success was to bring the 'One Shot' prediction data into Pandas as a dictionary. Not seen this done before, but it makes the code nice and clear and easy to see what needs to happen in deployment.
I cant test it much on the bee swarming data yet as I've not actually seen any swarms yet, so there's no boolean 'Trues' for 'swarm seen in apiary'.
-
Catch hive in position
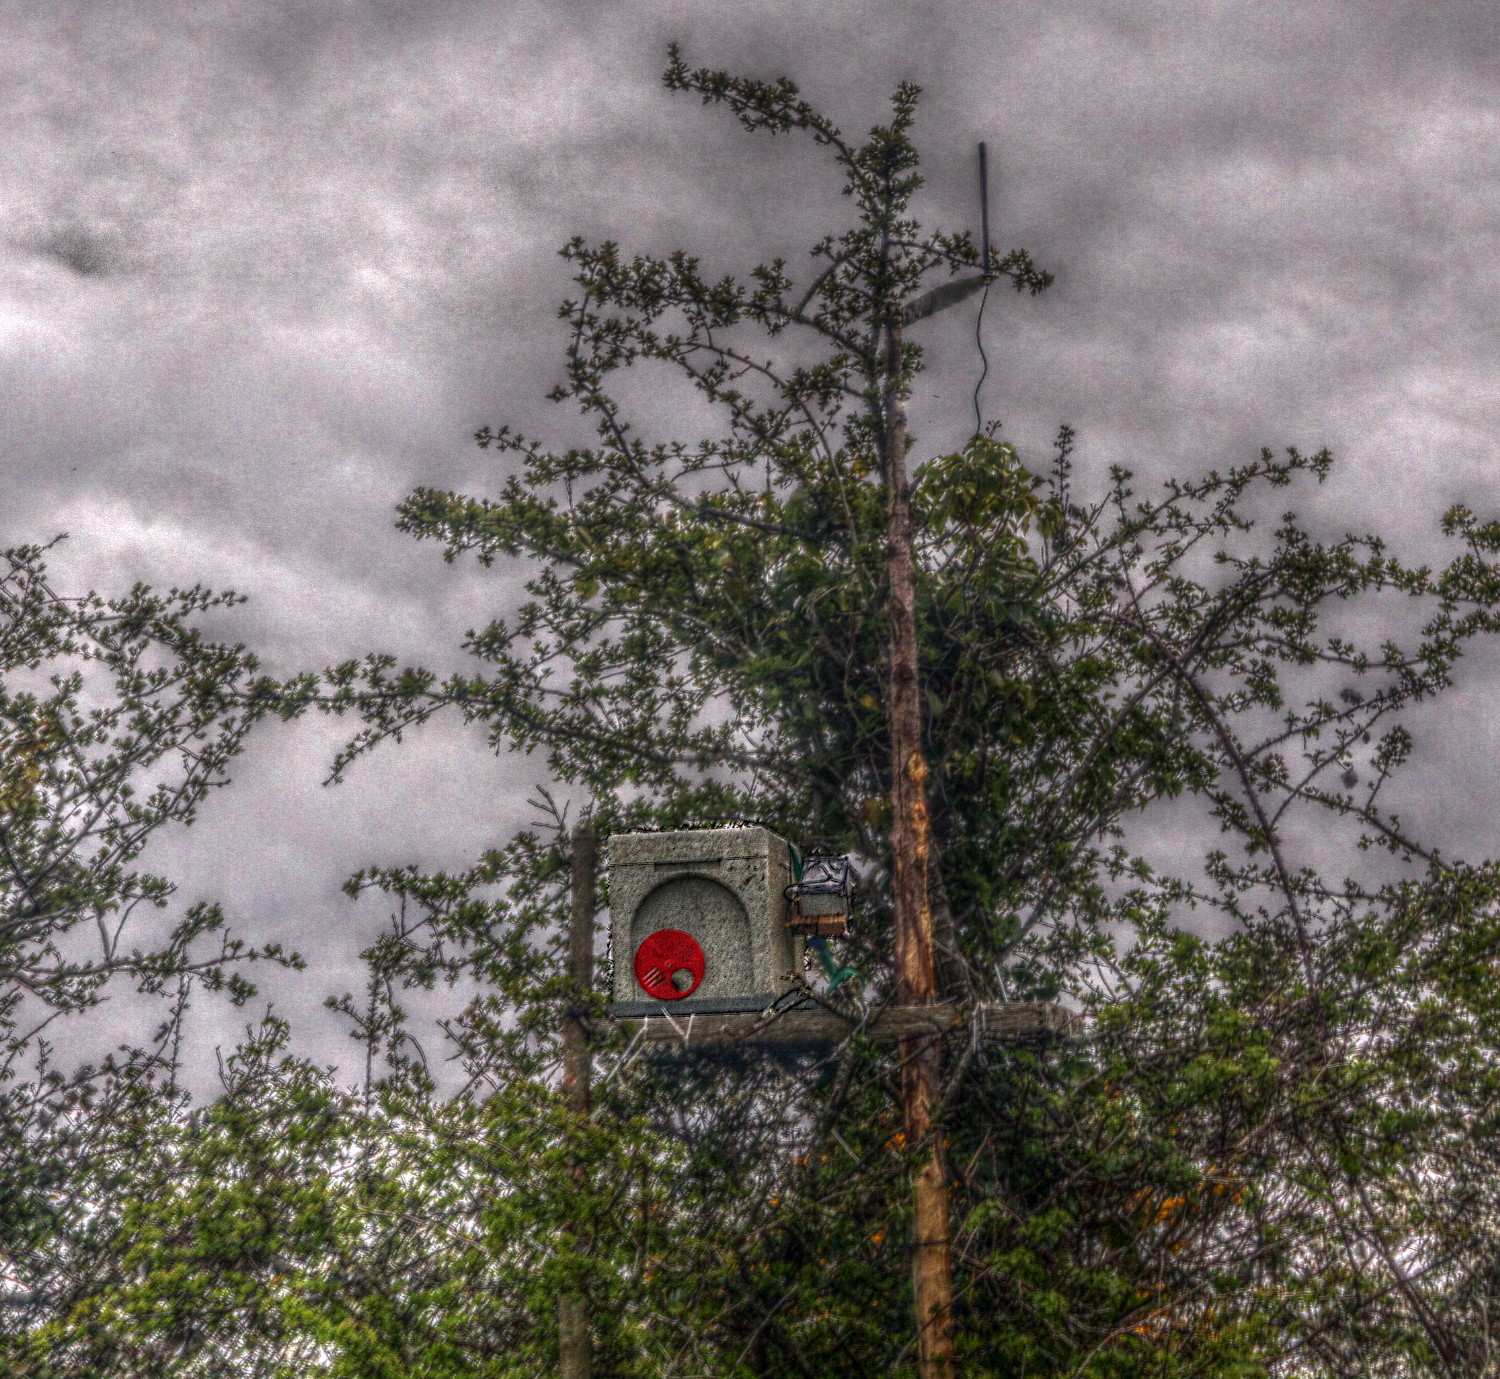
04/27/2023 at 13:12 • 0 commentsCatch hive in position high up in a tree above the apiary .....
![]()
........ but no sign of any swarms so far:
-
Data collection has started
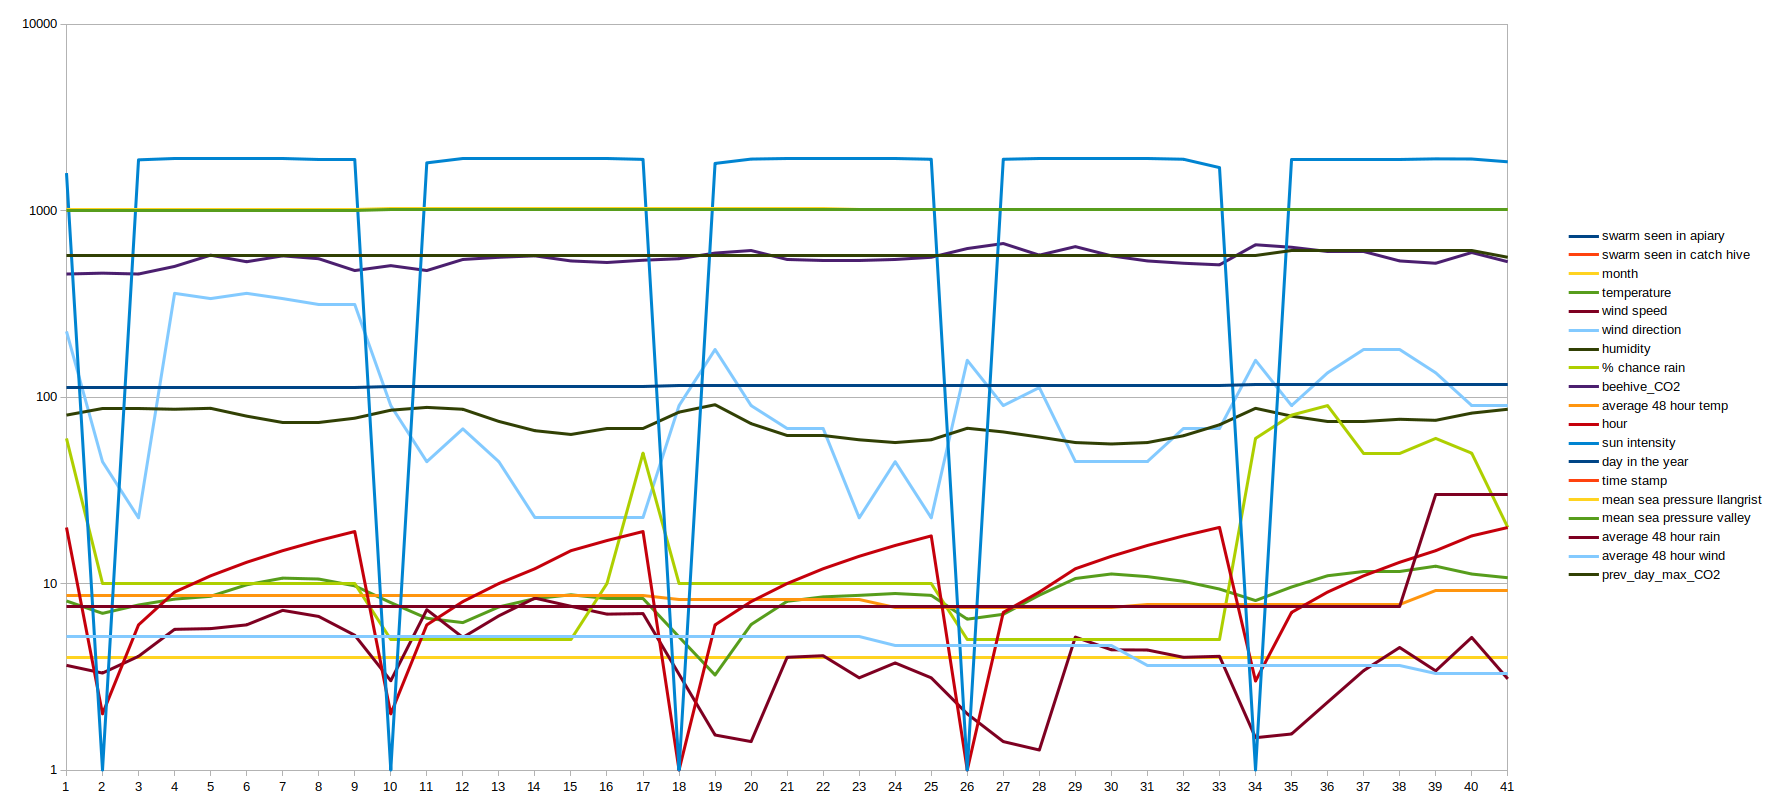
04/24/2023 at 17:30 • 0 commentsData collection has started, as below:
![]()
I've carefully chosen data parameters that seem to be important from past experience. The most obvious environmental parameter to collect is sun intensity as it's extremely unlikely that the bees will try and swarm in the dark. The importance of the various parameters can be checked when analysing the trained model but to get started we have to rely on experience and educated guessing. The next factor of importance is quite possibly the month of the year as the bees never swarm before April. Temperature is a another major factor and if the average 48 hour temperature is low, then it is probably because there is a cold snap. Rainfall is probably next important and this system is using a website that estimates rainfall from satellite information and is generally quite accurate. Wind speed is probably next important as the bees generally wont fly in strong winds and would find it hard to difficult to maintain the aerial structure of the swarm. Bees are unlikely to want to swarm in cold easterly winds and seem to much prefer to swarm in high humidity for some reason. Lastly, and probably least important, is atmospheric pressure although analysing the model could well prove me wrong.
Checking for swarms will be done every afternoon at about 6pm and probably more often if the CO2 levels in the catch hive dramatically increase. The catch hive itself will be checked if nighttime CO2 levels are significantly higher than normal.
A fellow bee keeper recently reminded me that swarming very often occurs after a period of wet or stormy weather, so a factor could be introduced into the data similar to 'average temperature in the last 48 hours' but it would relate to rain and 'storminess'. Also, bees tend to do a lot of scouting for their new home the day before they actually swarm so a value for 'max CO2 level on the previous day' was added to the data structure.
Ai Honey Bee Swarm Detector / Predictor System
Local C02 sensor and weather data scraped off interwebs predict swarming