-
daylight saving time
10/29/2023 at 09:46 • 0 commentsOn the night of Saturday October 28 to Sunday October 29, 2023, we gained an hour's sleep and set our clocks back an hour.
This occured at change between 2am to 3am during the night.
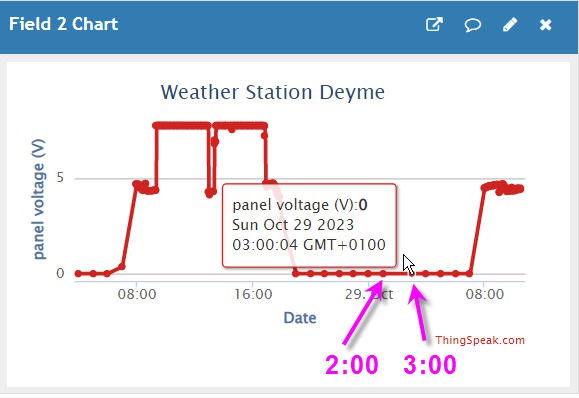
And here is how the Weather Station reacted :
![]()
It's a success, the station woke up at 3am "summer time" and the Ntp server told GTW0 that it was still 2am (but winter time)... GTW0 updated its RTC and sent the time to the GTW1. Both slept one hour more (it was during night). And finally at 3am "winter time" both wokeup again and so on !
Thingspeak is even showing a "lapse" of 2 hours on the X axis, but time has changed only one hour !
This behavior was expected but seeing it in real time was a pleasure !
-
Validation, tests and planning
10/09/2023 at 08:17 • 0 commentsThis project seems simple but like all projects needs a consistant phasis of tests and validation.
Testing approach
I took my inspiration from the European Space Standards (I am a space ingeneer !) and taylored the ECSS-E-ST-40C which is the "Verification Standard" for space systems !
Stop kidding, I only kept from this standard the overall philosophy consisting in documenting and testing the specifications under realistic use cases including degraded modes of the hardware and software.
Here are the testing cases that have been currently checked:
- Hardware tests
- overall test of the board
- systematic test of each sensor
- power management optimization (see V2 of this board)
- degraded conditions
- empty the battery and check of low level protection
- energy monitoring during charge
- cut off of charging process when battery full
- calibration of sensors (see specific logs)
- test of water resistance of the shell
- test of high temperature resistance of the shell (above 50°C done ths summer)
- communication tests
- lora tests (frequency, spreading factor, RSSI)
- optimization of the antenna (see biquad antenna)
- time sysnchronization between GTW0 and GTW1
- RTC initialization
- integration tests and degraded conditions
- protocol between GTW0 and GTW1
- breaking the link and see the system recovering connection (GTW0 side and GTW1 side)
- wifi credentials setup
- integration with ThinkSpeak
- integration with WindyApp
- daylight saving time test
- long term testing (operationnal scenario)
- Wind only version tested for more than 3 months 24/24 7/7 . (October 9th, more than 37000 measurements stored into thingspeak)
- Full version tested only on ground... deployment to be done
- bad weather conditions tests
- heavy rain : tested under several thundstorms (wind only version yet)
- strong wind : tested under more than 60km/h wind and (with a car) at 100km/h
- high temperature : tested above 50°C
- cloudly days : tested during almost one week
- ice or snow : not yet tested
- modularity
- sensors configuration and choice is done (wind only and full station)
- interface with various "weather servers" done (currently thingSpeak and Windy App)
- extensibility to Home Assistant done
- extensibility to wider automation network done : see Rezodo project
Nothing fancy into this log... All these tests needed a lot of time, but they were the price to be paid to get confidence into the system.
The "wind only" weather station is now fully automatic, without any need for human intervention (initialization excepted).
ToDo List and planning
As said previously energy management was a critical part of the system. It has proven to work even now in october with longer nights than days!
The "wind only" station is considered as operationnal now (october 2023)
However I really want to test the system during winter to see if power balance is still positive. If not, I can easily decrease power consumption by decreasing measurement frequency (currently every 2 minutes). This could be done easily by a software "seasonnal" modification on GTW1 only.
Full weather station is currently only tested "on the ground" and proved to work. I have to deploy it and test it intensively.
Tests will focus on weighing rain gauge as the rest of the system is already qualified.
Special care will be put on snow and ice resistance. I have to "freeze" the bucket in place when temperature is too low to avoid to block the RC servo used to empty the bucket if snow or ice is blocking it. (not a complex modification !)
All this will be done during the 6 months to come. The goal is of course to have a system operationnal and tested during almost one year including hot summer and cold winter !
- Hardware tests
-
going further ? Usefulness of low cost IoT Weather Station
10/06/2023 at 16:30 • 0 commentsAs stated into the introduction, this project started under the impulsion of farmers who needed a low cost Weather Station remotely controled from their farm located at 2km away from their fields.
Currently two models of the station do exist and have proven their reliability.
But is this concept viable in the long term, is there a "market" or even a need for this low cost approach ?
I started a light "market analysis" for weather stations and found :
quite a lot of solutions in the range 100 to 200$ but almost none with long range Lora transmission.
When looking specifically for "lora weather station" the cheapest I found was the Raddy L7 Lora station, but at a price of 180 USD.
Then come more expensive solutions like Meteo Helix (839€)
None of them seems to have weighing bucket rain gauge and use standard tipping buckets.
Does it mean that my very low cost station at 65€ is "the" solution ?
Well, while searching for evidence on internet I found a very interresting paper called :
This paper is a very recent (may 2023) preprint from gi.copernicus.org
(Geoscientific Instrumentation, Methods and Data Systems (GI) is a not-for-profit open-access interdisciplinary electronic journal for swift publication of original articles and short communications in the area of geoscientific instruments).
![]()
This paper is available for download and worths spending some time reading it.
I have picked up a few sentences:
"Environmental observations are a pillar of environmental science. They provide the necessary data to describe and model the state of the environment and its spatial and temporal changes. Furthermore, the data collected can be used to identify and assess 20 possible natural risks and thus warn of potential natural hazards. Environmental observations also form the basis for decisionmaking in environmental policy and for monitoring the outcome of the resulting measures, which requires reliable and systematically collected data."
This seems to be perfectly in line with the "save the world" challenge#5 objectives !
Later they do insist on the usefullness of low cost Weather Stations:
"Developments over the last two decades in the field of the Internet of Things (IoT) allow this shortcoming of institutional measurement networks to be addressed. The availability of ever smaller, cheaper, more power-efficient devices and sensors combined with the ubiquitous availability of connectivity to the internet make it possible to collect and process data where it is needed. Even if the quality and reliability of such devices is lower than that of official measuring stations, the resulting datasets with higher spatial and temporal resolution can represent added value."
And finally, I would like to address the requirements they propose for low cost sensors systems :
"To improve the resolution of any official environmental measurement network, the sensor systems have to fulfil different requirements. When using a high number of sensor systems, they have to be low-cost while maintaining a certain level of data quality and reliability to ensure an effective application. Thus, sensors have to be quality checked before being used. To further reduce costs, the sensor system should be robust and low-maintenance. The proposed systems should be energy efficient so that the systems can operate for long periods of time without replacement or can be charged by solar panels. This would make the systems independent from being connected to the power grid, which maximises the possibilities for measuring sites. For real- or near real-time use of the data, the use of wireless connectivity is required to transmit the data from the sensors to the users. This also improves flexibility in the selection of measuring sites.The sensor system should be easy to install, use and maintain, ideally even by people not familiar with the subject. This also enables the use of volunteers (citizen scientists) to further reduce costs. Since not all requirements have to be met at all locations, modularity of the system would be desirable; be it the choice of sensors, power supply or connectivity. Further, to make the system as applicable and transferable as possible, open-source hardware should be used."
Frankly speaking this paper wasn't even published when I started my project. I had some intuition of what could be "good" for users but I couldn't imagine that my own specifications would match so perfectly the outcomes of this GI's preprint!
I let you read the full article, where (once again) tipping bucket rain gauge prove their difficulty to be properly calibrated...
But after reading this preprint I feel confident in my specifications and design:
- a battery operated + solar charger
- a wireless long range solution
- precise sensors based on existing solutions
- an accurate weighing rain gauge (calibrated both during tests and with self calibration procedure)
- an accurate (and calibrated) anemometer
- an accurate wind direction sensor
- an outstanding 65€ cost
- a full Open Source Open Hardware system
Obviously this system is easy to build and mostly intended for "hackers" community. But it could be easily manufactured and sold either as a kit or as a pre assembled system.
I will stay into the hackers side, but if you are interested, this system is open... Just keep me informed please!
-
Integrating the Weather Station with WindyApp
10/04/2023 at 11:45 • 0 commentsWindy App is probably one of the best Application for weather forecast.
You can find it on the web and run App on you phone as well.
![]()
I tried this app and fell immediately in love !
What is so different is the ability to compare models, to tune the App to your outdoor activity but also to select forecast at your specific location.
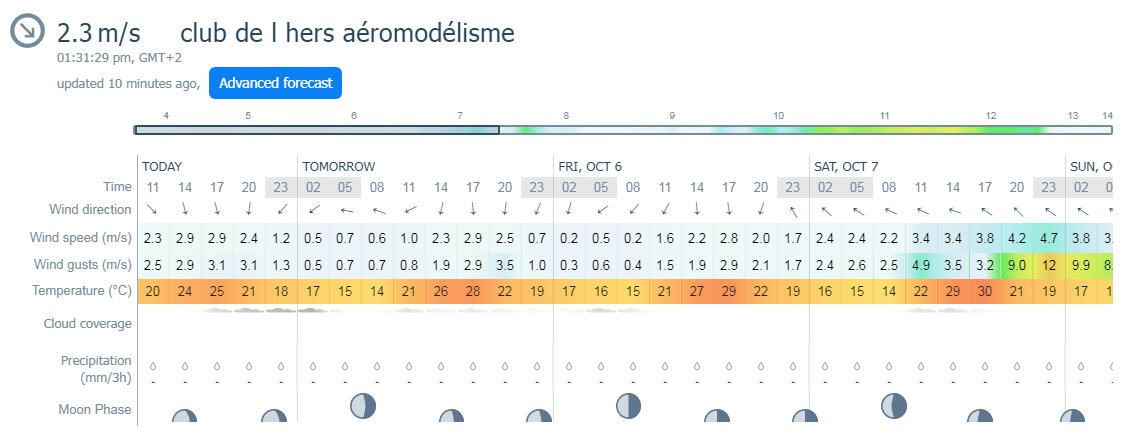
Here is how it looks like for our airfield:
![]()
This is the weather forecast for Deyme Airfield.
It's great but I wanted to see if it was possibile to integrate my Weather Station into windyApp (not the forecast but the real sensors measurements).
So I contacted WindyApp to ask them if a kind of API was existing. And the answer was YES
integrating windyApp API into your weather Station
Here is the documentation to integrate a local Weather Station.
Nadia from WindyApp was extremely patient to help me to interface the Weather Station. After a few trial and errors with https on ESP32, I finally succeeded in creating the Deyme_test station on WindyApp server and to upload my very first measurement.
Here is the sample code (the autorization token is of course obfuscated...)
/*
  https POST and GET to windyApp using ESP32
*/

#include <WiFiClientSecure.h>

const char* ssid = "YourSSID";
const char* password = "your Password";

const char*  server = "api.windyapp.co";  // Server URL


WiFiClientSecure client;

void setup()
{
  //Initialize serial and wait for port to open:
  Serial.begin(115200);
  delay(100);

//wifi connection
  Serial.print("Attempting to connect to SSID: ");
  Serial.println(ssid);
  WiFi.begin(ssid, password);

  // attempt to connect to Wifi network:
  while (WiFi.status() != WL_CONNECTED) {
    Serial.print(".");
    // wait 1 second for re-trying
    delay(1000);
  }

  Serial.print("Connected to ");
  Serial.println(ssid);


//first connection to WindyApp server
  client.setInsecure(); // avoid to check for certificate

  Serial.println("\n*** Starting connection to server...");
  Serial.print(server);
  if (!client.connect(server, 443)) //secure connection https on port 443
  {
    Serial.println(" connection failed!");
  }
  else
  {
    Serial.println(" *** Connected to server!");
    Serial.println("\n*****************************");
    Serial.println(" *** trying to POST to server!\n");
    // Make a HTTP request:
    client.setInsecure();

    String requestBody = "{\"station_id\":\"Deyme_test\",\"wind_speed\":2,\"metadata\":{\"station_id\":\"Deyme_test\",\"latitude\":0.1,\"longitude\":0.1,\"station_name\":\"aeromodelisme club de l\'Hers\",\"timestamp\":1687375555}}";

    /*
      POST /v10/partners/station/data HTTP/1.1
      Authorization: Bearer your token
      Host: api.windyapp.co
      Content-Type: application/json
      Content-Length: 163

      {"station_id": "test", "wind_speed": 2, "metadata": {"station_id": "test", "latitude": 0.1, "longitude": 0.1, "station_name": "testname", "timestamp": 1687375555}}
    */
    client.println ("POST /v10/partners/station/data HTTP/1.1");
    Serial.println ("POST /v10/partners/station/data HTTP/1.1");
    client.println ("Authorization: Bearer your token provided by WindyApp");
    Serial.println ("Authorization: Bearer your token provided by WindyApp");
    client.println ("Host: api.windyapp.co");
    Serial.println ("Host: api.windyapp.co");
    client.println ("Content-Type: application/json");
    Serial.println ("Content-Type: application/json");
    client.println ("Content-Length: " + String(requestBody.length()));
    client.println ();
    Serial.println ("Content-Length: " + String(requestBody.length()));
    Serial.println ();
    client.println (requestBody);
    Serial.println (requestBody);

    client.println();

    Serial.print("\n*** Request sent, receiving response... ");
    int requestTime = millis();


    while (client.connected()) {
      String line = client.readStringUntil('\n');
      if (line == "\r") {
        Serial.println("headers received ");

        break;
      }
    }
    // if there are incoming bytes available
    // from the server, read them and print them:
    while (client.available()) {
      char c = client.read();
      Serial.write(c);
    }

    Serial.println();
    Serial.print ("*** closing connection ");
    Serial.print(millis() - requestTime);
    Serial.println("ms later");
    client.stop();

}

void loop() {
  // do nothing
}
And bingo you get this log, your data have been received by windyApp servers.
*** Request sent, receiving response... headers received


{"status":"success","response":"The data for weather station gleyzes_jean_pierre_Deyme_test has been successfully added"}
Now that the tricky connection part is working, it becomes easy to publish real sensors values.
Note that :
- wind speed must be in m/s
- wind max (gust) must be in m/s
- temperature must be in °C
- timestamp is UNIX epoch (seconds since 1970) and in UTC
This being said, the source code of the Weather Station has been upgraded accordingly and will be available quite soon on the github page.
Of course the modifications only affect the GTW0 as the station itself is not modified !
finding your station in windyApp
Now comes the magic trick: there is nothing to do to find your station... Well almost nothing
- Open windyApp on your phone
- activate location services (GPS on)
- search for a "spot" very close to your station
- add this spot as "favorite" into windyApp
And now you get the weather forecast of this spot (as any other place in windyApp)
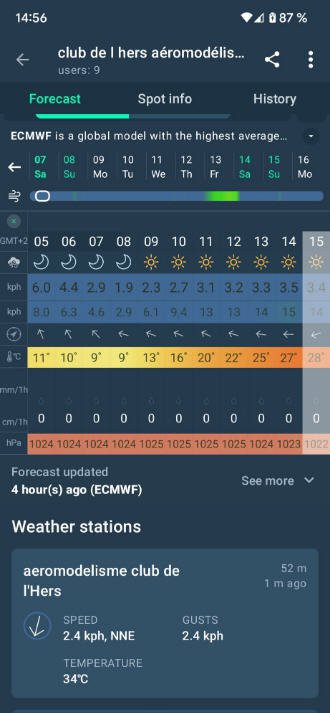
But, if you scroll down the page, then will appear the nearest weather stations (usually 3)
![]()
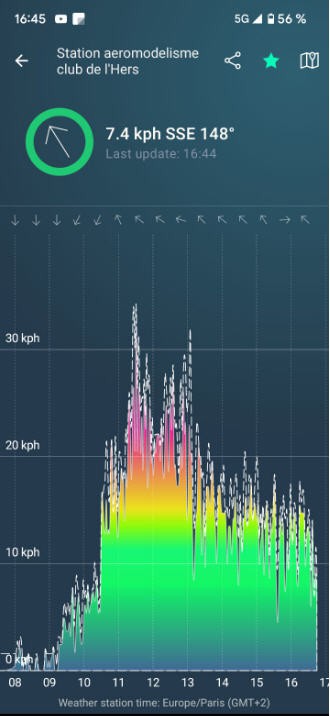
So "aeromodelisme club de l'Hers'" is actually the name I gave to my weather station and you have access to last measurement!
Top of the page is the local forecast, bottom of the page is the real time measurements made by the Weather Station. Very cool !
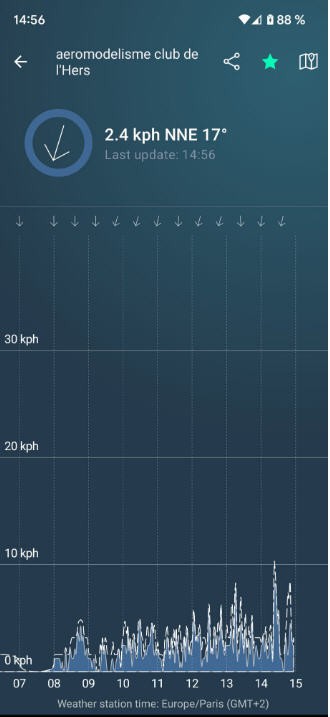
And if you click on this station then a new page pops up with detailled informations
![]()
Now simply click on the top right "star" icon (green on the picture) to keep this station as favorite
![]()
And that's it, you station is on your main screen as well as the location of your spot.
changing the color code for wind speed
Would be nice to get color palette adapted to your pilot profile .
I mean :
- green = no wind to light wind
- yellow = moderate wind
- red = no fly ... too much wind
Something like this !
![]()
Well this is very very easy with windyApp.
open the profile and change the color code !
![]()
Just one thing to say: Thanks windyApp for providing such a great application!
-
adding Wind Gusts to the weather station
09/20/2023 at 17:00 • 0 commentsA lot of our RC pilots were more interrested in "strong wind" rather than "averaged wind speed".
So they asked for Wind Gusts values.
I made it !
Gusts are measured every 5s during 30s while I also measure average wind speed.
Latest commit on my Github page contains all the source code.
While the thingspeak channel of our Airfield weather station can now proudly show "Gusts"
![]()
And it's the same for windyApp (here in dark blue)
![]()
-
configuring GTW0
09/09/2023 at 09:47 • 0 commentsYour GTW0 is the one which is connected to internet and which synchronizes the weather station (and other GTWs if a wider Rezodo network is in use).
To configure the GTW0 we have to set up the Wifi credentials and the frequency of sensors measurements.
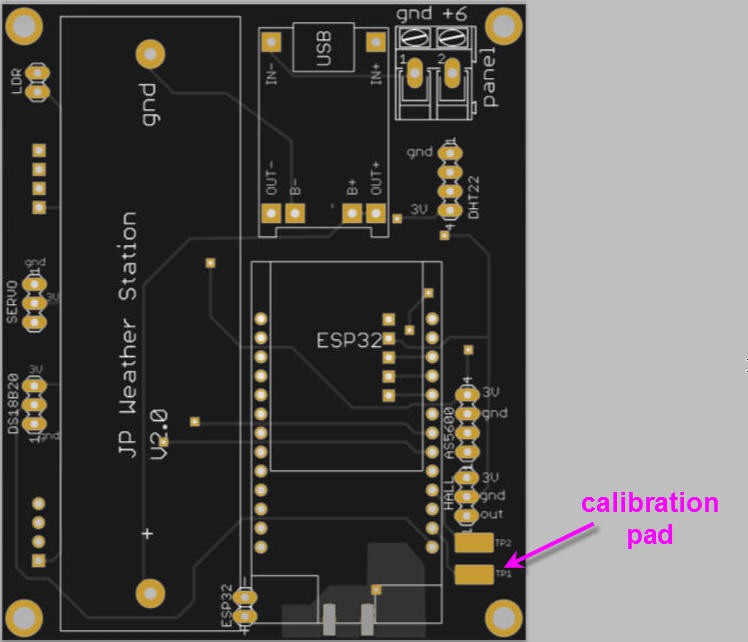
This is done by touching the TP1 pad on the PCB and (while touching the pad) resetting the ESP32
Then a web access point will pop up on which you can connect your smartphone
![]()
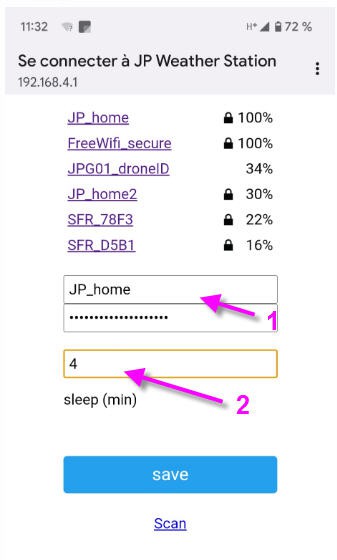
Connect to this hotspot then enter
- a valid wifi ssid and password
- the frequency to wakeup your weather station in minutes
![]()
that's it !
-
Wind Direction and weighing gauge calibration
08/18/2023 at 12:27 • 0 commentsWind direction sensor
Calibration the wind direction sensor simply consists in telling him where is the north !
Indeed the magnet can be glued in any position on the shaft so the north pole is totally into a random position!
To calibrate the "north" we simply align the sensor to the "north" direction, then we press the touch3 pad on the ESP32 and reset the ESP32 (remove your finger from the touchpad after releasing the reset button).
This touch pad( named TP1) is also in the bottom right corner of the PCB
![]()
Calibration is done by software and value is stored into the ESP32 flash memory.
It's straightforward and simple!
 float angleValue = as5600.rawAngle() * AS5600_RAW_TO_DEGREES;
  if (touch3detected) //calibrate sensors
  {
    Serial.println ("calibrate anemometer");
    calibAngle = angleValue;
    preferences.putFloat("calibAngle", calibAngle);
  }
You don't even have to physically point the sensor to the north. Just align the sensor with the axis of the PVC pipe (opposite direction of the solar panel).
But you will have to align the solar panel to the south direction when fixing the weather station on the roof.
![]()
So, wind direction sensor should be calibrated in this position:
![]()
weighing gauge calibrationCalibration of a load cell is quite easy:
- determine the zero offset "tare"
- substract the zero offset from the raw value and then linerly convert this value to weight
In my Weather station the zero offset is dynamically determined. The logic is simple :
- once a day empty the bucket --> get the zero offset
- if weight decreases, abnormal condition then empty the bucket --> get the zero offset
- if weight is too big then empty the bucket --> get the zero offset
The scle factor needs however a static calibration. It is done by weighing a know weight after having reseted the ESP32 while pressing the TP1 touch pad
 GetRawWeight();       //HX711 will sleep after weight acquisition
  if (touch3detected)
  {
    Serial.print ("calibration HX711... ");
    calib = CurrentRawWeight;
    Serial.println(CurrentRawWeight);
    preferences.putLong("calib", calib);
    emptyBucket();
  }
The "calib" parameter is stored into the ESP32 flash. This parameter coresponds to the raw value of a know weight which is "calibWeight". Note that this value is in tenth of grams. I do use a steel ball the weight of which being 33.5g...
Change this value to the weight of your calibration steel ball !
//scale
#define PIN_CLOCK  32        //output to generate clock on Hx711
#define PIN_DOUT   34        //input Dout from Hx711

long calibZero = 0;  //No load sensor Output
long calib = 130968;          //sensor output - calibZero for Weight calibration --> will be auto calibrated later
int calibWeight = 335;         //weight at which calibration is done --> expressed in gramsx10. eg 335 means 33.5g
So the procedure to calibrate the load cell is :
- insert your steel ball into the bucket
- press the TP1 touchpad and hold your finger on it
- reset the ESP32
- release your finger
That's it
You should note that the same touchpad is used to calibrate both the load cell and the wind direction sensor.
Be sure you are into the calibration conditions of these two sensors while calibrating
-
experience feedback (REX) on power management
08/17/2023 at 14:12 • 0 commentsA critical part of my project was power management.
Here are a few words of "REX" regarding these aspects.
The wind only weather station has now been operated on a daily basis (24/24) for more than 2 months and has performed sensor acquisition and transfer of data over Lora (2.5km range) every two minutes during day and once every 1 hour during night.
All this being operated on a single 18650 Li-ion battery charged with a small 2W 6V solar panel.
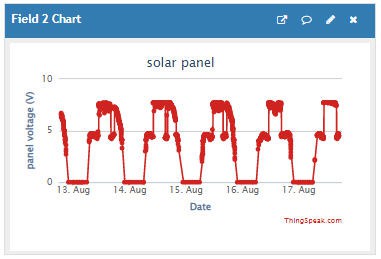
Here is the graph of the panel voltage captured during a few days :
![]()
We can clearly see the repeating pattern where the panel outputs 0V during night and boosts up to 7V during full sun.
If we zoom here is the detail:
![]()
- during night I automatically perform data sampling once every 1 hour to save power, at sunrize voltage is slowly climbing while at sun set it slowly decreases
- during a few hours the solar charger is lacking efficiciency (it's a linear charger...) and the panel falls down to 5V but charges the battery until full charge where the panel recovers and outputs full power (7V)
- but even during full charge when a cloud hides the sun, voltage may drop a little...
In conclusion, the system seems to be very well "balanced" with good margin to allow operation even during winter time...
In case of (unexpected) battery depletion I could easily change the sampling rate to 4 min instead of 2 min during winter season! But we will see this after a few months !
Currently the fast 2min acquisition is not a concern, even during very cloudy days the battery was charged enough to power the weather station.
-
gauges on ThingSpeak using Matlab
07/18/2023 at 19:13 • 0 commentsDIsplaying wind direction needs particular "compass gauges".
Here is how they look on my "wind Only" Weather Station
![]()
Among these gauges only the second one (wind Speed) is native, the first and third one need a few lines of matlab code.
Let's start by creating a "Matlab Visualization" on your channel:
![]()
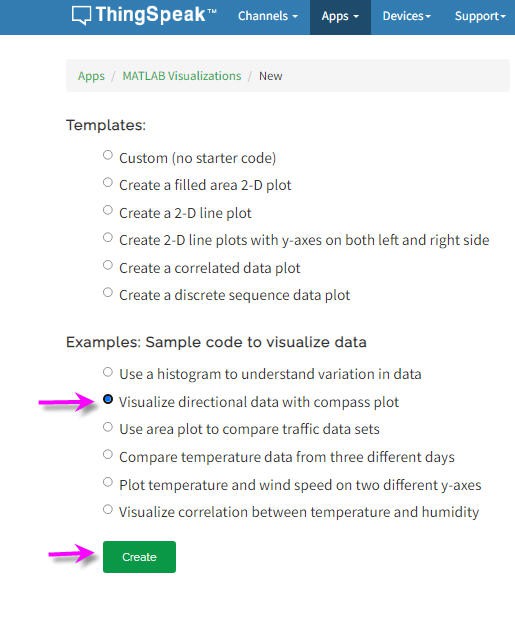
Click on "new visualization" then select the compass one:
![]()
Click on "create" and you will get sample code for this visualization:
![]()
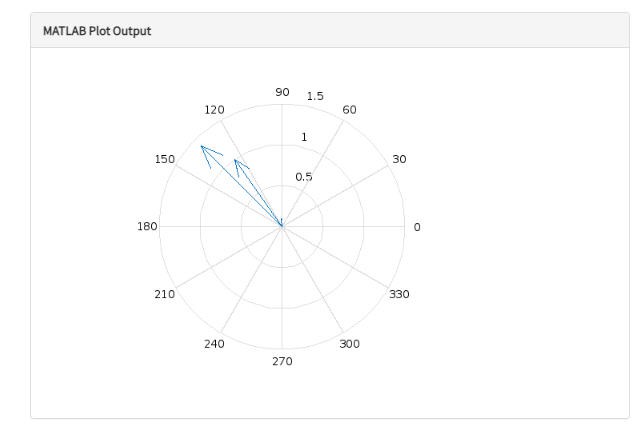
You can save and run this code to get this result:
![]()
Although it's a good starting point, it's far from being perfect to display wind direction:
- North south Est West are not displayed
- arrow lines are pointing to the the direction from where the wind is coming
- 0 is on the right side instead of pointing to north
- angles are counter clockwise instead of classical ClockWise
I managed to find Matlab Gurus to help me correct these defects.
The source code is self explainatory and can be found on my github page: https://github.com/f2knpw/Long_Range_Weather_Station/tree/master/Matlab
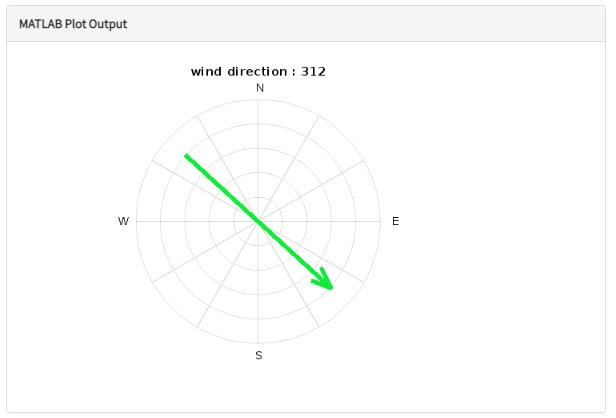
If you change the code by this one you will get the expected result:
![]()
You can of course save this gauge on your channel:
![]()
When reading the source code, you will discover that it is more a less a "hack"... There is no proper way to achieve this result... that's a pity !
-
Adding a biquad antenna to increase Lora range
07/18/2023 at 12:01 • 0 commentsTo increase range of my Lora network I decided to try a biquad antenna.
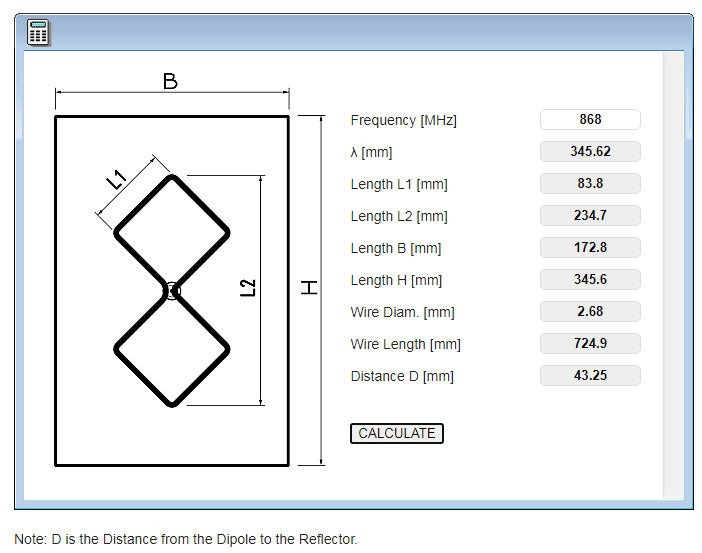
My lora frequency being 868 MHz I used this online calculator to get the proper design: https://www.changpuak.ch/electronics/bi_quad_antenna_designer.php
![]()
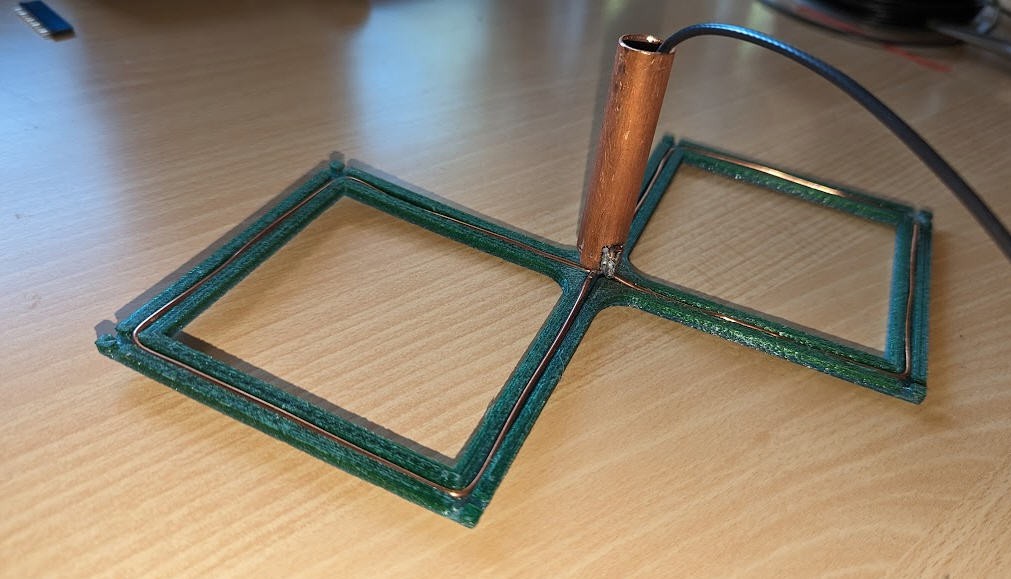
Then I built a jig tp help bending the 2mm copper wire. You can find it on Thingiverse : biquad antenna
![]()
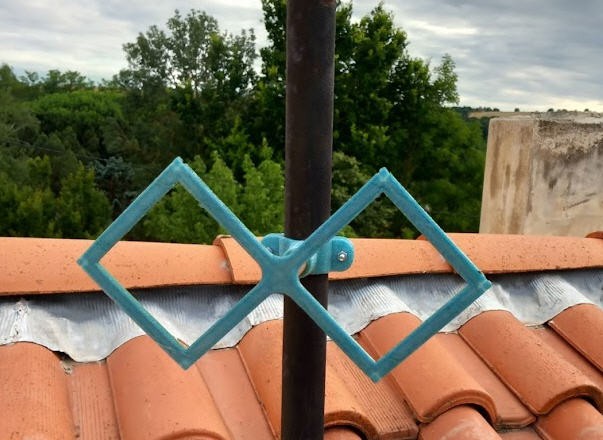
This being done we attached the antenna on the roof.
![]()
Results were impressively good. Eventhough I didn't make a metal reflector for this antenna, I got a lot more power from my "Wind Only" Weather Station located 2.5 km away from the roof.
The BiQuad antenna is a simple antenna design that offers many advantages. First is the simplicity of the design.
The radiating element are two square with the side length equal to 1/4 midband wavelength, 83.8 mm for
868 MHz in our case.
Polarization of the antenna is 90 degrees from the position of orientation of the biquad, i.e. horizontal biquad (as shown on the roof) has vertical polarization.
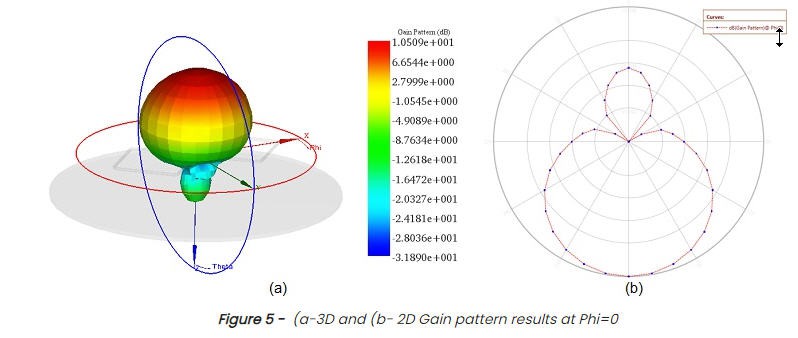
The metallic reflector reflects the electromagnetic waves back to the front of the antenna (-Z-axis), hence reducing the radiation to the back and improving the antenna gain and directivity in the forward direction. The obtained gain measures the ability of the antenna to concentrate radio frequency energy in a particular direction. It is typically measured in dB and found equal to 10.5 dB for the studied antenna design.
Note that the "z axis" is perpendicular to the biquad
![]()
Without the metal reflector my antenna behaves more or less like a dipole antenna but with better gain and directionnality.
Long Range Weather Station (65€)
A cheap but precise Weather Station (Lora transmission)
 JP Gleyzes