-
Putting PD150 to use - characterizing a bridge amplifier
09/02/2023 at 14:48 • 0 commentsI've been meaning to show a practical application for PD150 and an opportunity just arose! I'm experimenting with a miniature CRT screen. It uses two deflection coils to steer its electron beam. One coil deflects the beam horizontally and the other vertically. Unfortunately, the CRT's circuitry is pretty specialized for sweeping the beam in a raster pattern, and I want to generate vector graphics. For this I'll need custom drivers for the coils which can output on the order of 20V peak to peak at a frequency of at least 10kHz or so.
What's all this have to do with diff probes? Well, one nice way of generating a large voltage swing is using a bridge driver. And with a bridge driver, neither of the load's terminals are grounded. So you can't just stick a regular probe across the terminals. If doing so, you would need two regular probes, to apply a math function, and to contend with non-ideal imbalances that can get pretty nasty at higher frequencies. This is where the diff probe comes in use. You can just connect it right across the load's terminals without worry and get good test results.
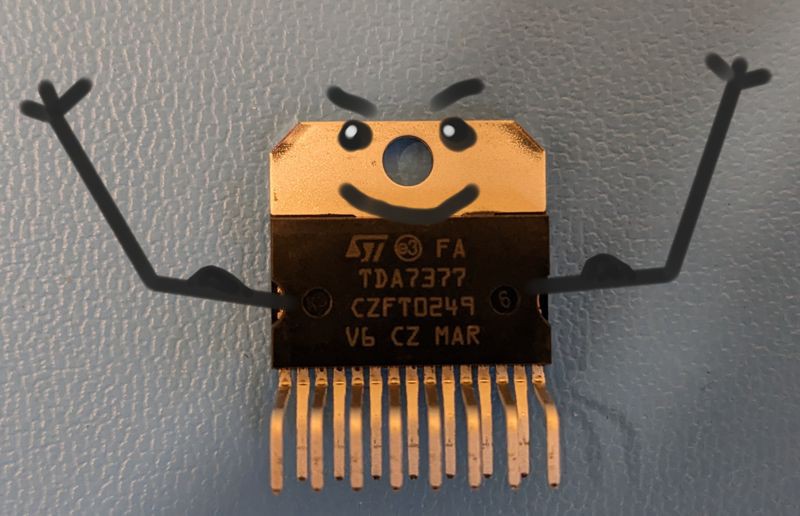
The bridge driver that I've been exploring is a TDA7377. It's an older chip intended for audio amplifier use. It has two 30W bridge outputs, which is perfect since I have two deflection coils to drive. I just bought this one, but it looks like it's been sitting on Mouser's shelves for a couple decades. It's happy to be free!
![]()
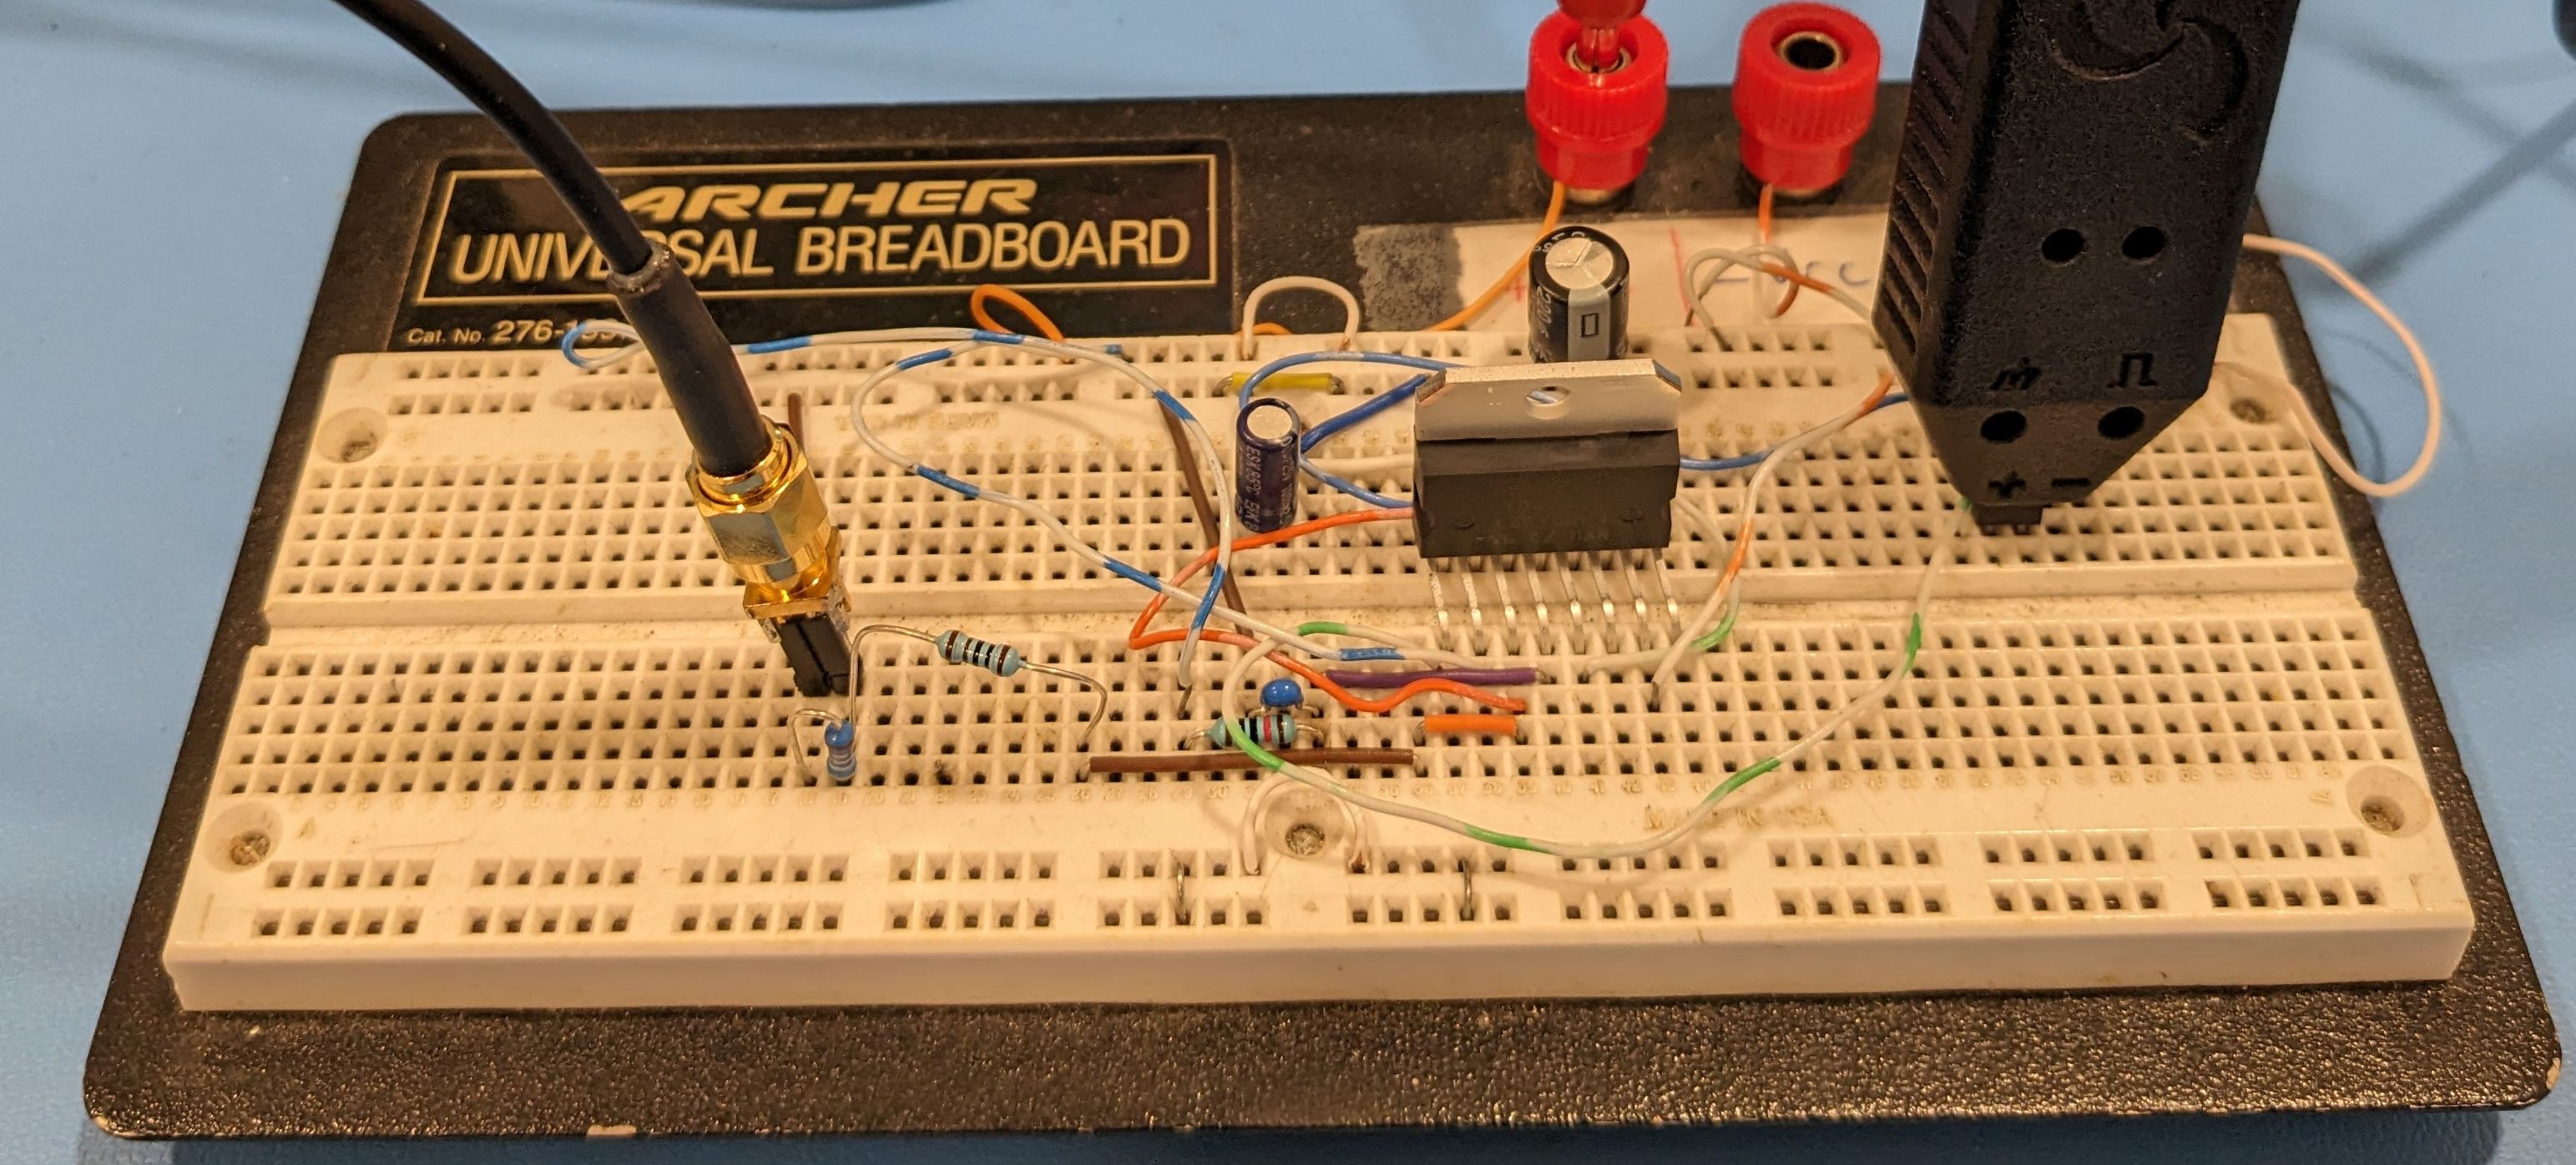
The TDA7377 is a through-hole part, albeit with a strange package that the manufacturer calls MULTIWATT. With a little wrangling, it fits into a solderless breadboard. I have it set up here with an input signal source and the PD150 probe at the output. The input comes through the coaxial cable at the left. The PD150 monitors the output of the bridge on the right side of the breadboard. It's pretty easy to use with a breadboard like this. Just use a two pin header. Place one end in the breadboard. The other end fits right into PD150's input sockets.
![]()
Unfortunately the TDA7377's datasheet is pretty sparse. It doesn't even provide a bandwidth. Presumably its response is pretty flat to 20 kHz, being an audio product, but best test it to be sure. Also, I'll eventually need to see how its output performs under the deflection coil inductive loads.
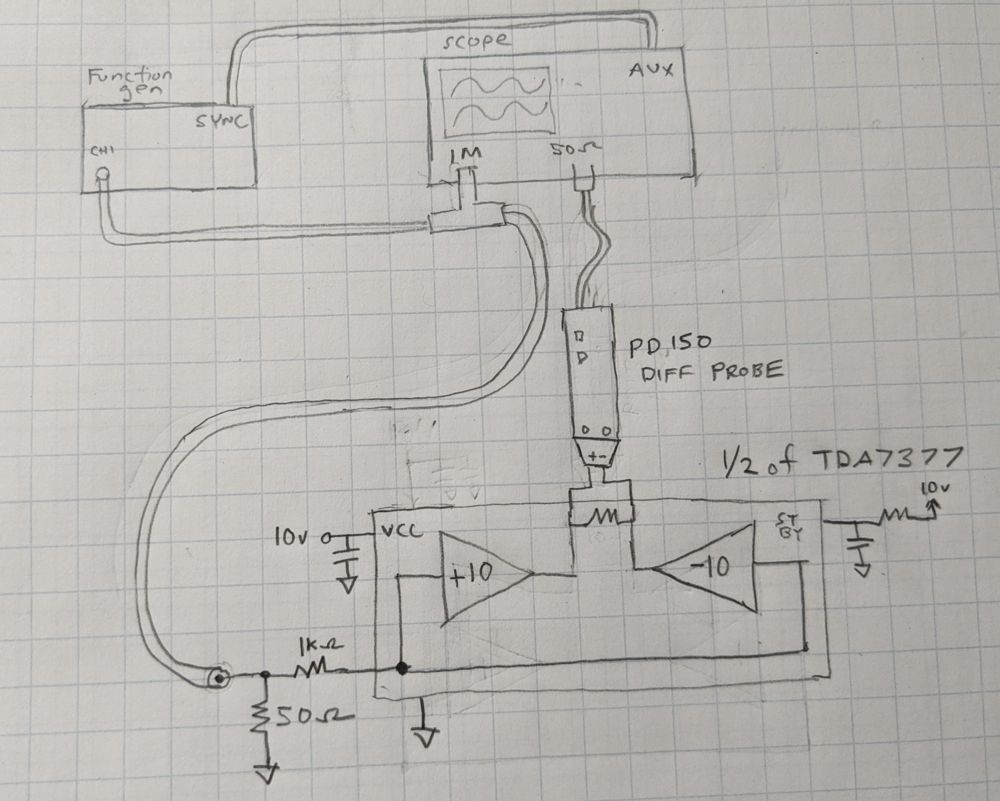
To get started I set up a simple test to measure frequency response with a 10 ohm resistive load. A function generator provides the input. The input path is kept at 50 ohms to ensure meaningful results at higher frequencies. I used the PD150 diff probe to monitor the bipolar voltage across the load. The scope captures the input and output voltages. Here's a diagram of the setup.
![]()
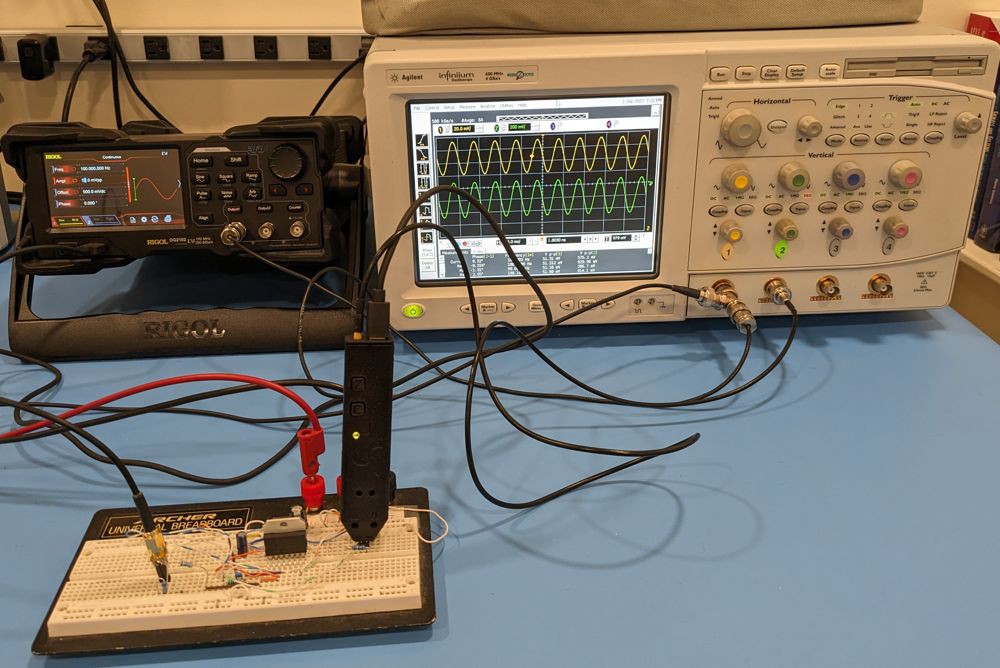
Here's the setup on the bench:
![]()
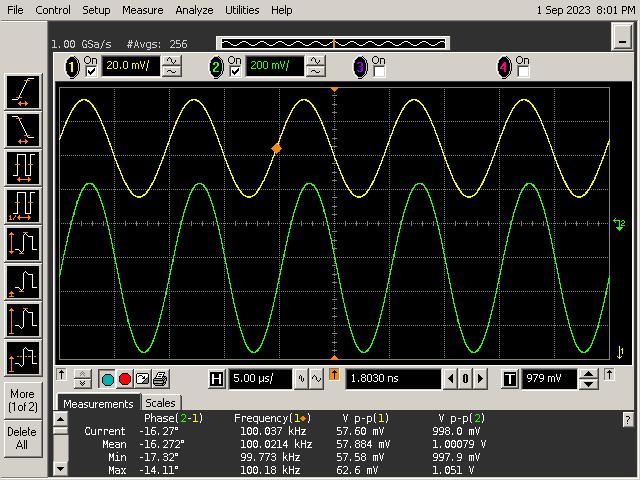
We'd expect the amplifier to behave pretty ideally at a comfortable 1 kHz, and it does. Here's the scope screen with channel 1 showing the input voltage, and channel two showing the bridge output voltage from the PD150. The gain is about 25 dB, which is the lower end of the spec shown in the data sheet.
![]()
The response is surprisingly flat to 100 kHz and beyond! Here's the scope output at 100 kHz:
![]()
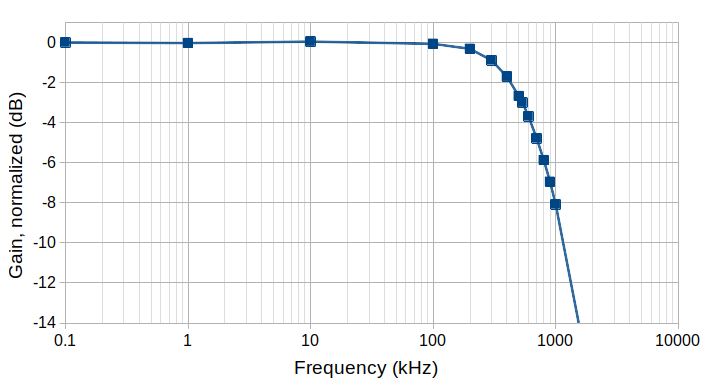
But eventually the amplifier's gain tails off. I found the 3 dB point to be about 535 kHz. Pretty good! I recorded data at a bunch of frequencies and used it to generate a frequency response curve:
![]()
Well that's it for now! It's a good start. With TDA7377's bandwidth being quite high, it was nice having a true diff probe. Had I instead used two regular probes and the scope's math function, I may have run into issues measuring into the 100s of kilohertz. Here both probes, amplifiers, and compensation would have had to be well matched to each other. I was also happy with how the PD150 can plug into a breadboard with a pin header. It was easier than using standard probes with a breadboard.
While this application was for a linear bridge driver, a diff probe is also a good tool for switch-based bridges. These are usually made from four power MOSFETs and used to drive motors, or bridge based power converters.
-
AC common mode rejection testing
08/04/2023 at 19:04 • 0 commentsIntro
This log describes common mode rejection tests that I performed on the probe. I introduce the test setup and a test fixture, describe the results, and future plans.
For reference, the probe's specs claim a common mode rejection ratio (CMRR) of at least 40 dB at 10 MHz, and at least 70 dB at 60Hz. We'll check these numbers against the test results.
Review of common mode signals and common mode rejection
Applying a common mode signal just means placing the same voltage on both of the diff probe's terminals. Since a diff probe responds to the difference in voltage across its inputs, its output should be zero volts. This is never quite true in the lab. Some common mode voltage leaks through due to imbalances in the probe's attenuator and amplifier.
Common mode rejection ratio (CMRR) describes how well the probe is doing in this regard. It's the ratio of the probe's differential mode gain to its common mode gain. Thus a larger value is better. It's often expressed in decibels when dealing with diff probe specs.
Test fixture
We'll first need a way to apply the same AC voltage across both probe inputs. This is the so called common mode voltage input. In addition It's good to connect the signal source's ground to the probe/scope ground. This ensures that the DC common mode voltage does not drift or have additional AC noise during the test.
I made a simple test fixture for this purpose. It's shown connected to the probe. The fixture is made from a BNC connector, a two pin header, and a jumper wire. The BNC connector's center pin is soldered to both of the header pins. I also soldered a small jumper wire to the ground ring on the BNC connector. This jumper provides the connection to the probe/scope ground. The jumper connects to the probe's ground input, and the non soldered ends of the header to the probe input sockets.
The fixture is shown connected into the middle of a BNC tee adapter. This provides an easy way to connect a signal generator to the fixture, and also to connect a scope for viewing the input voltage.
![]()
Connecting it all up
With the fixture ready, we can connect the signal source and a scope to view the results. In the photo below, the function generator connects to the bottom of the BNC tee. The top of the tee connects to scope channel 1. Finally, the probe's output connects to scope channel 2.
![]()
Measuring CMRR at 10MHz
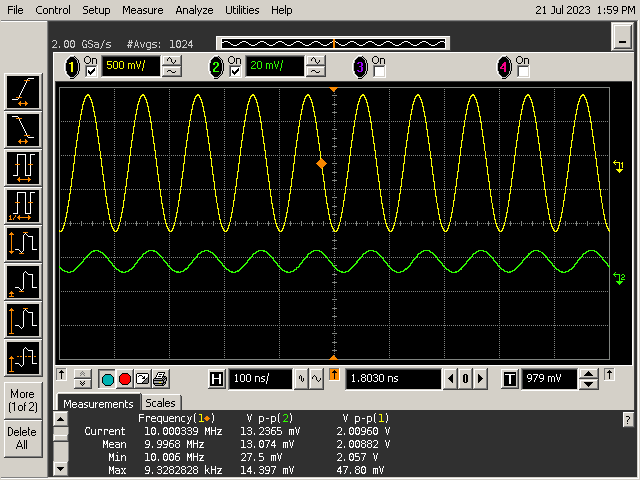
To test at 10MHz, I set both scope channels to 50 ohm input impedance. I also made sure to set channel 2's attenuation to 20X to account for the probe's attenuation in the measurements. I then set the function generator up to output a 10MHz 2 V peak-to-peak sine wave. To maximize effective vertical resolution and measurement accuracy, I set the scope to average 1024 measurements.
The resulting scope traces are shown below. You can see the 2 V peak-to-peak input in yellow, and the probe's much smaller output in green below it. From the peak-to-peak voltage measurements at the bottom of the screen capture, we can compute common mode gain. It is 2.0096 V / 13.2365 mV, or 1/151.8. Since differential mode gain is almost exactly 1.0 referenced to the probe input, we can calculate CMRR as 1/(1/151.8) = 151.8. In decibels, this works out to 43.6 dB, which is within the probe's spec of 40dB or greater.
![]()
Measuring CMRR at 60 Hz
I made a couple small changes to the setup for testing CMRR at 60 Hz. At this frequency, we expect a much greater CMRR (of at least 3100:1), causing a correspondingly small signal at the probe's output. In fact the probe pushes the limits of the scope's vertical resolution.
To mitigate this as much as possible, I set my signal generator's output to its maximum output voltage of 20 V peak-to-peak. I then set the scope's channel 1 input to high impedance, since the input is only rated to 5 Vrms when terminated in 50 ohms - anything greater could damage the scope's internal 50 ohm termination. But we don't need 50 ohm termination at such low frequencies anyhow, so high impedance it is.
Here's the resulting screen capture. As you can see, the probe's output is still very tiny even with the large input voltage. I can't zoom in further due to the minimum 20 mV per division vertical setting. So we'll have to rely on using a large number of averages. The resulting CMRR measurement is 6799:1, or 76.6 dB. This is well within the probe's spec of at least 70 dB at 60Hz.
![]()
Conclusion
Alright, the testing is complete! The CMRR results back up the probe spec. The only issue is that the probe's output in the 60Hz test is extremely small. It is hard to trust the measurement that well since the scope's minimum vertical amplitude is 20 mV per division. One way to get around this issue is to place a high gain amplifier between the probe's output and the scope's input. It's pretty easy to get lots of gain at 60 Hz using an op amp circuit. I may try that and follow up with the results and see how they compare.
-
Differential and common mode range at DC
07/21/2023 at 20:45 • 0 commentsThis log explores recent differential and common mode range testing. I put the probe to its limits and beyond, and captured a bunch of data in the process.
DC differential voltage range testing
What exactly is a differential voltage? I like to think of it as a bipolar voltage supply centered at the oscilloscope's ground. The positive output connects to the probe's "+" input, and the negative output to the "-" input. If you apply such a voltage, the probe should output the same voltage, only scaled by 1/20.
To apply a 1.0 V differential voltage to the probe, you can do the following: (1) Connect the voltage supply ground to the scope ground, (2) set the positive voltage to +0.5 V and apply it to the probe's "+" input, and (3) set the negative voltage to -0.5 V and apply it to the probe's "-" input. The differential voltage across the probe inputs is then +0.5 V minus -0.5 V, which is the 1.0 V that we intended.
This is essentially the test setup shown below. The bipolar is built with two voltage sources in series, with each providing half of the full differential voltage. They're both labelled 1/2 VinDM. The probe output is set up to connect to a multimeter for accurate DC measurement. I made sure to use a precision terminator built with a 0.1% tolerance resistor to get as accurate results as possible.
![]()
Okay, now to the testing! I've got a dual 30V power supply which lets me generate up to +/- 60 V differential. This is nice since I can see how the probe behaves well beyond its differential range spec of +/- 20 V. I set the supply over several voltage points through this range and measured the differential input voltage and probe output voltage at each setting.
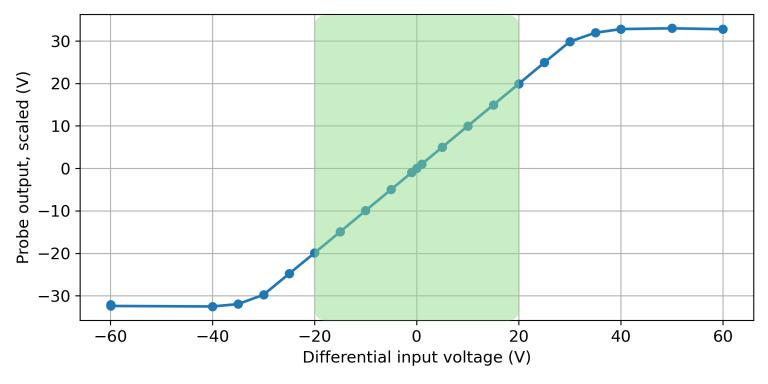
After much very tedious work, I filled up the test spreadsheet at last! Here's a plot showing the probe's output voltage as a function of the differential input voltage. The output voltage on the vertical axis is multiplied by 20 to account for the probe’s 20:1 attenuation.
![]()
The green section shows where the input voltage is within the probe's specified operating range. In that area you can see that there's a 1:1 relationship +10V in, +10V out, etc. So that looks pretty good. The voltage errors in that region were under 2%.
The performance remains fine up to +/-30V. In fact, you can often use the probe up to that extended range - at frequencies up to about 100 MHz. Beyond 100 MHz, the probe's output voltage becomes limited by slew rate, hence the +/- 20V spec.Adding some common mode voltage
The differential voltage response is all well and good, but what happens when you apply a common mode voltage too? Well, in a perfect world, nothing would happen! The probe would subtract the two inputs, eliminating any common mode voltage in the process.
Let's give it a try! The test setup needs one slight modification. An extra power supply will need to be connected between the bipolar supply's ground and the scope/probe ground. The new setup looks like this:
![]()
There's a massive combination of possible common mode and differential voltages I could test. To confine things, I focused on the extremes of the probe's common mode voltage spec: +30 V and -30 V. To this end I grabbed one more power supply and wired as in the diagram. I set its output to 30V and otherwise repeated the same exact testing, stepping the differential voltage from -60 V to +60 V. Finally, I repeated this again with the common mode power supply's terminals reversed for the -30 V common mode measurement.
After much more tedious work, I now had in my possession a spreadsheet with two more columns! One column has the data for the +30V common mode voltage, and the other with -30 V. Ideally the test data in these columns should be exactly the same as the previous testing, since the probe shouldn't respond to common mode voltages.
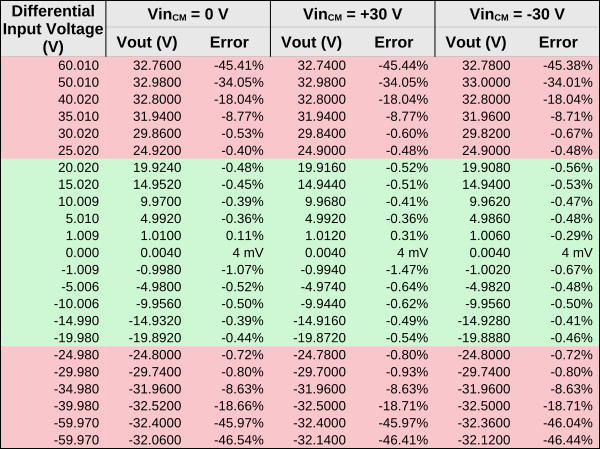
They were in fact very close! Close enough that they would overlap the line in the previous plot and not be visible. So instead, I just put a table of the data here with the data and errors. The green section of the table covers testing where the differential input voltage is within the probe's operating range. In the red sections, it's outside of the probe's operating range.
![]()
Conclusion
After all the testing it was a relief to see the probe performing well through its voltage limits. The probe maintained voltage errors of under 2% through its specified differential voltage range of -20 V to +20 V. The performance was nearly identical when applying common mode voltages of +30 V and -30 V.
-
Pulse response testing
07/20/2023 at 00:59 • 0 commentsIntro
I’ve been using pulse response testing in one form or another since the early probe prototypes – basically applying a pulse to the probe input and capturing the output on a scope. It’s a quick way to estimate the probe’s bandwidth with a minimal test setup. This log describes pulse response methods and recent testing with latest prototype.
The simplest form of pulse testing goes like this:
- Apply a pulse to the probe input and capture the result on a scope
- Measure probe output rise time, from 10% to 90% amplitude
- Divide the probe output’s rise time by 0.35 to derive its bandwidth in Hz.
This method ignores the scope's limited bandwidth and the source’s non-instant rise time. Because of this, it will underestimate the probe’s bandwidth somewhat. But there's an equation to compensate for this error, which I'll apply in the testing below.First steps - building and characterizing a pulser
The probe's rise time is pretty fast. Its design bandwidth of at least 150MHz implies a rise time of 2.33 ns or less. So we'll need a fast pulse generator. I didn't have one, but luckily high speed logic gates came to the rescue! I used that approach to build a minimal pulser shown below. It's 74LVC1G14 Schmitt trigger inverter set up as a relaxation oscillator. There's a resistor divider at the inverter's output to reduce loading and achieve an approximate 50 ohm source impedance. The output is through an SMA connector at the top of the photo. The connector sticking out the side is for the power supply.
![]()
The setup below is aptly a miminal setup for characterizing the minimal pulser. It's connected right to the scope's input, which is set to 50 ohm impedance.
![]()
As you can see the pulse response is pretty flat. The scope measured a rise time of about 804 ps. Not too bad! If we compensate for the scope's analog bandwidth, which is spec'd at 1GHz, the true rise time would a little better at 724 ps.
![]()
Applying the minimal pulser
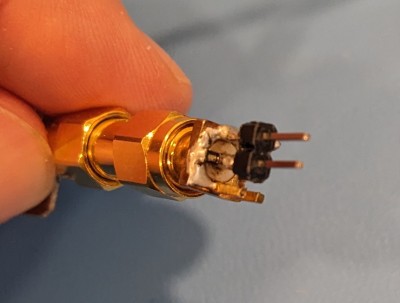
With the pulser characterized, the next step is hooking it up to the probe inputs. That took a little careful soldering to adapt the pulser's SMA output to the probe's pin socket inputs. To do so I soldered a pin header to an SMA connector. I also added in a 50 ohm termination by soldering an 0603 resistor between the SMA connector's center pin and shell.
![]()
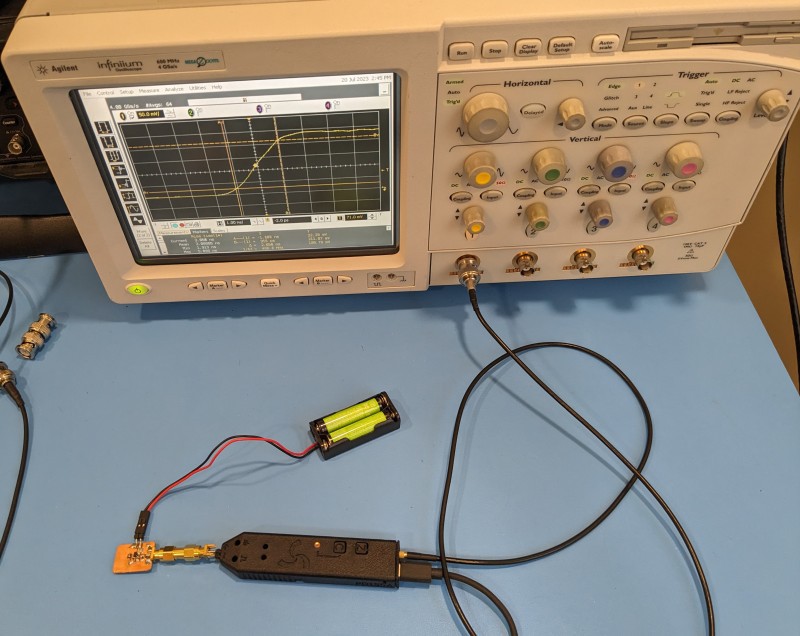
Now we're ready to test! Here's the full setup. There's not too much too - just the pulser, SMA adapter/termination, and probe with its output and power cables.
![]()
Here's a scope screenshot showing the probe output and its rise time from 10% to 90% amplitude.
![]()
The probe output's measured rise time is 2.12 ns. Using the formula from the Intro section, the probe bandwidth estimate is 0.35 / 2.12 ns, which works out to 165 Mhz. Great! It's within spec.
But remember that this method ignores the scope's limited bandwidth and the source’s non-instant rise time. We can compensate for those with the following formula and should find that the bandwidth is a bit higher than the 165 MHz estimate.
Applying the formula shows that the probe rise time is actually 1.965 ns, which translates to a bandwidth of 178 MHz.
