Peter Wasilewski
-
v1.1.0 update
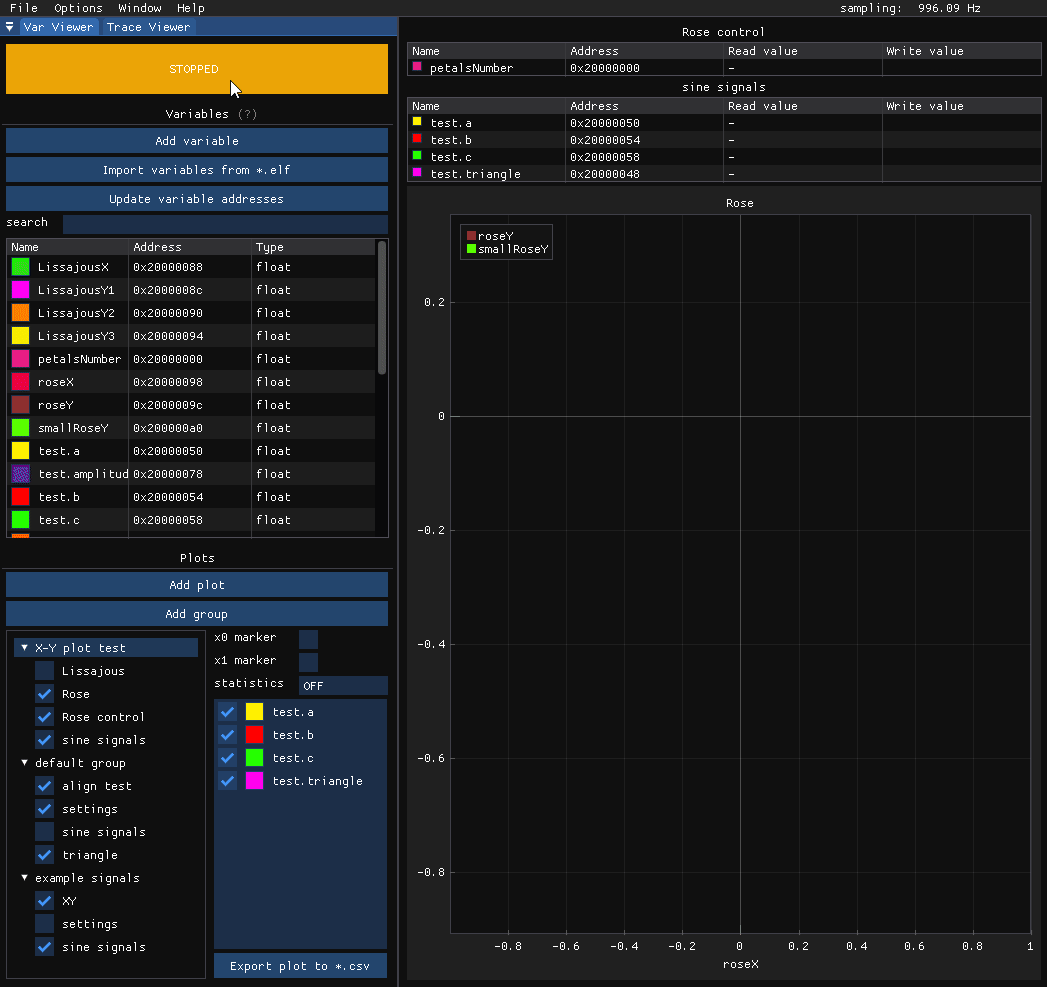
12/10/2024 at 21:17 • 0 commentsRecently a new MCUViewer version was released. The update introduced some long-anticipated features:
- XY plots - for visualizing variables related to other variable, not only time
- Plots grouping - allowing for quickly switching views
- Advanced variable config - post processing, fixed point support, ability to read any memory address
Make sure to give it a try! Here's a little teaser GIF:
![]()
-
Full JLink support - MCUViewer
09/21/2024 at 10:32 • 0 commentsUp until now, STMViewer was limited to supporting the STM32 microcontrollers. However, I wanted to make it more universal and extend its capabilities to other microcontroller families. In pursuit of this, I reached out to SEGGER company. After some discussions, I was fortunate to receive official support - they provided me with access to their SDK and two JLink probes to aid the development of MCUViewer.
With their backing, I began integrating JLink support into the software. The latest update focuses on the TraceViewer module, which now supports JLink probes for real-time trace visualization and debugging across a wider variety of microcontroller architectures.
![]()
This is a significant improvement, allowing to easily switch between different probe types (STLink or JLink) and microcontroller families without compromising functionality.
Since now we're not limited to STM32 family it was natural to rename the program to MCUViewer :)
If you'd like to try it out here's the Github page:
-
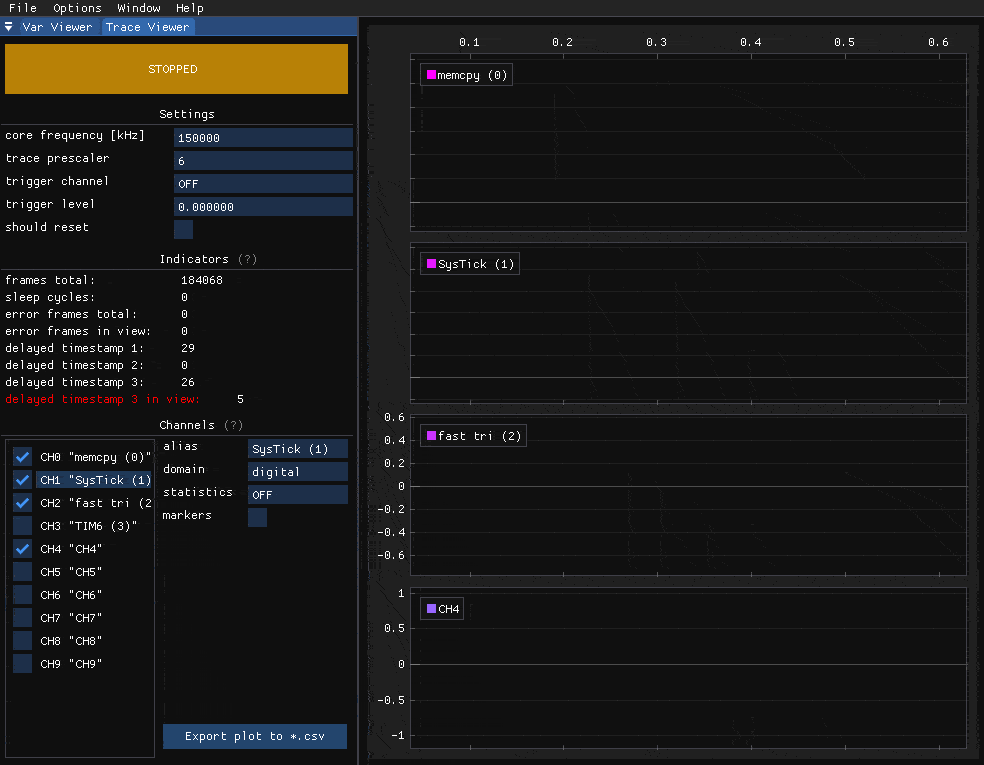
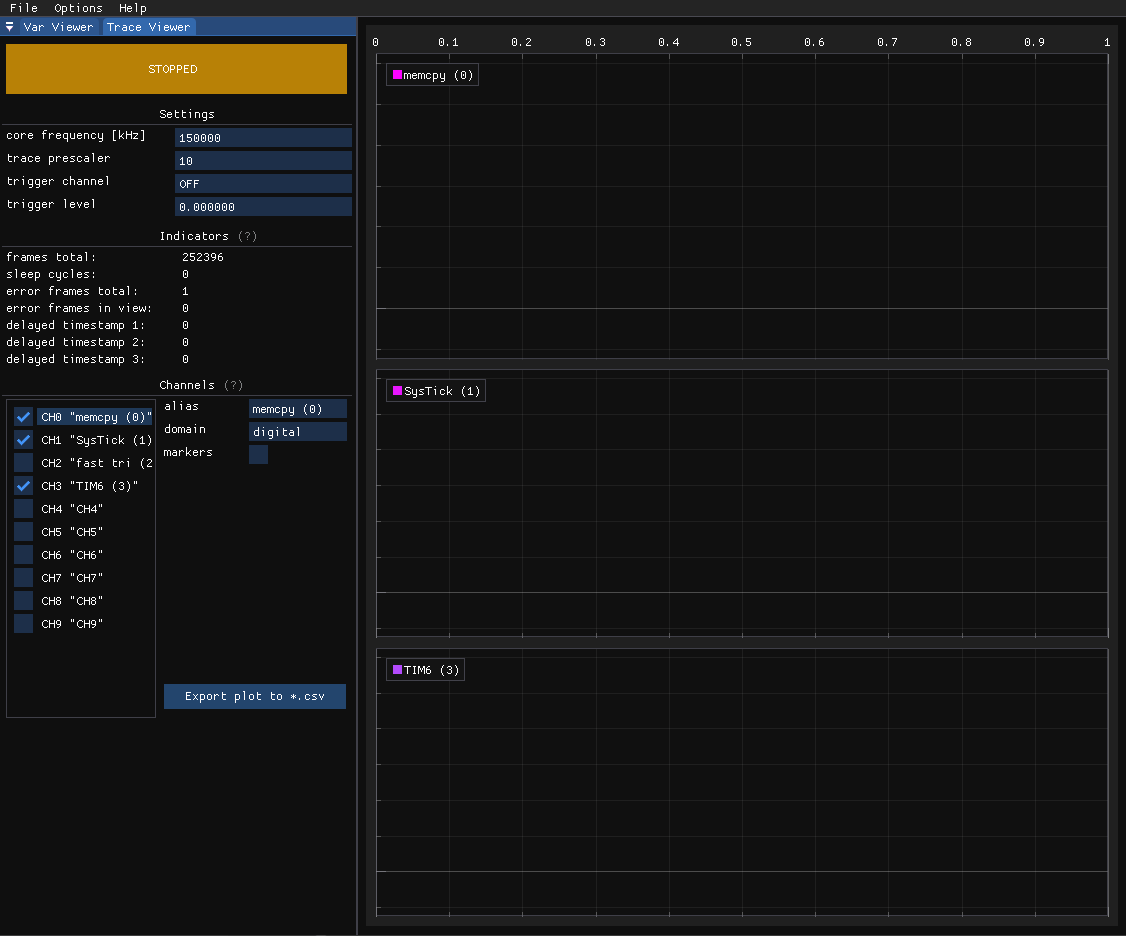
Trace Viewer Module
09/18/2023 at 17:09 • 0 commentsTrace Viewer is a new module that is implemented in the STMViewer software. It allows to visualize SWO pin trace data on digital or "analog" plots.
![]()
If you ever used GPIO pins to confirm a timer interrupt frequency, check how long a function takes to execute, or diagnose preempting interrupts you know how it's like to pull out an oscilloscope or logic analyzer and solder some wires to the prototype. It's quite annoying to set up, takes a lot of time, and you cannot easily connect mulitple channels. The Trace Viewer uses only and ST-Link programmer and it'a ability to read SWO output. Thanks to a trace peripheral in Cortex M3/M4/M7/M33 cores it is possible to measure sub-microsecond time periods (depending on your System Core Clock).
To create a datapoint on a plot you simply write a registers of the ITM peripheral like so:
ITM->PORT[x].u8 = 0xaa;
As you can see this method is almost non intrusive when we consider the time it takes for the micro controller to execute it. After that the trace peripheral takes all the work, creating relative timestamps and attaching them to bytes that are later sent through SWO pin.
If you're still interested check out the README.md for more info on how to get started!