Guillermo Perez Guillen
-
3. Building A Filter Spectrometer
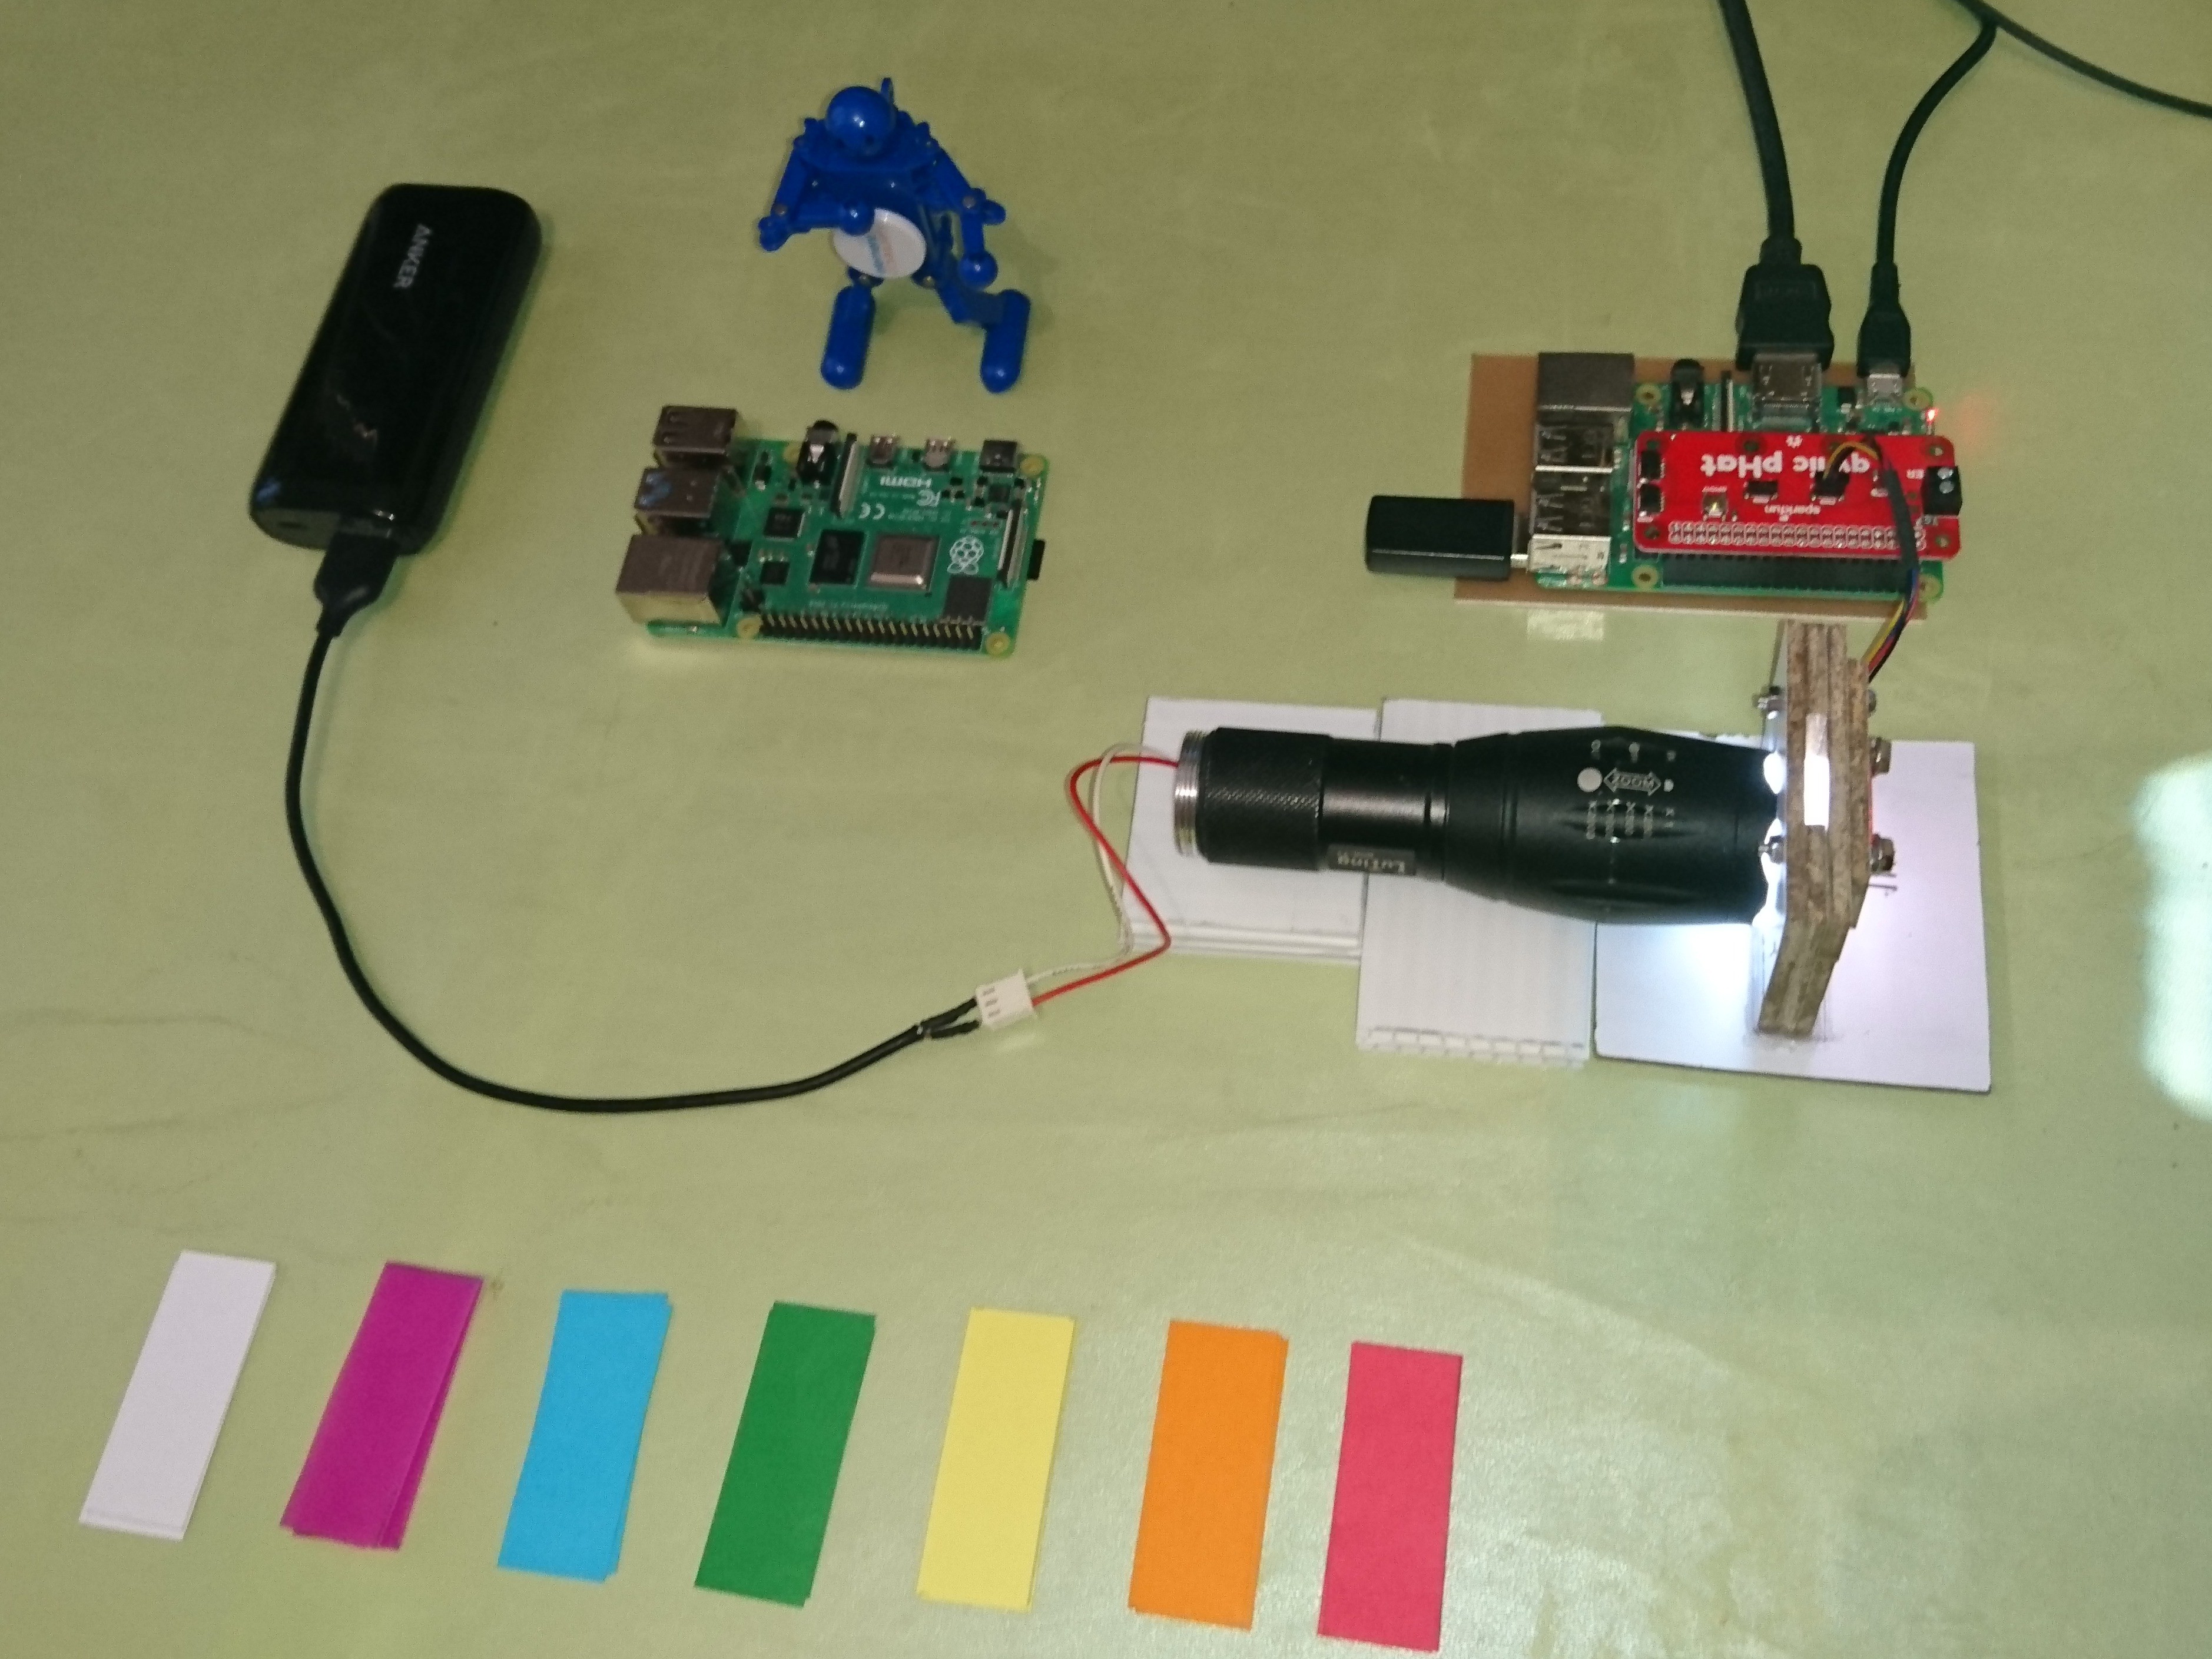
09/10/2023 at 03:24 • 0 commentsIn this chapter I will show you how to assemble a filter spectrometer, as well as the first tests with the six colors that the AS7262 sensor detects. Personally I can tell you that this project is exceeding my expectations since it works fine.
![]()
Device Assembly
I used 3mm MDF board to build the filter spectrometer, as it has good tamper resistance and because it would allow me to experiment until I got the right dimensions to mount the AS7262 sensor. Below I show you the cuts I made.
![]()
The dimensions of the large strips are 20(W) x 60(L)mm, and the short ones are 20(W) x 20(L)mm. I have then joined them with Kola Loka glue as shown below.
The "U" shaped figure is placed in the middle of the "O" shaped figures. I have also put a base of 75(W) x 75(L)mm as shown in the image below.
![]()
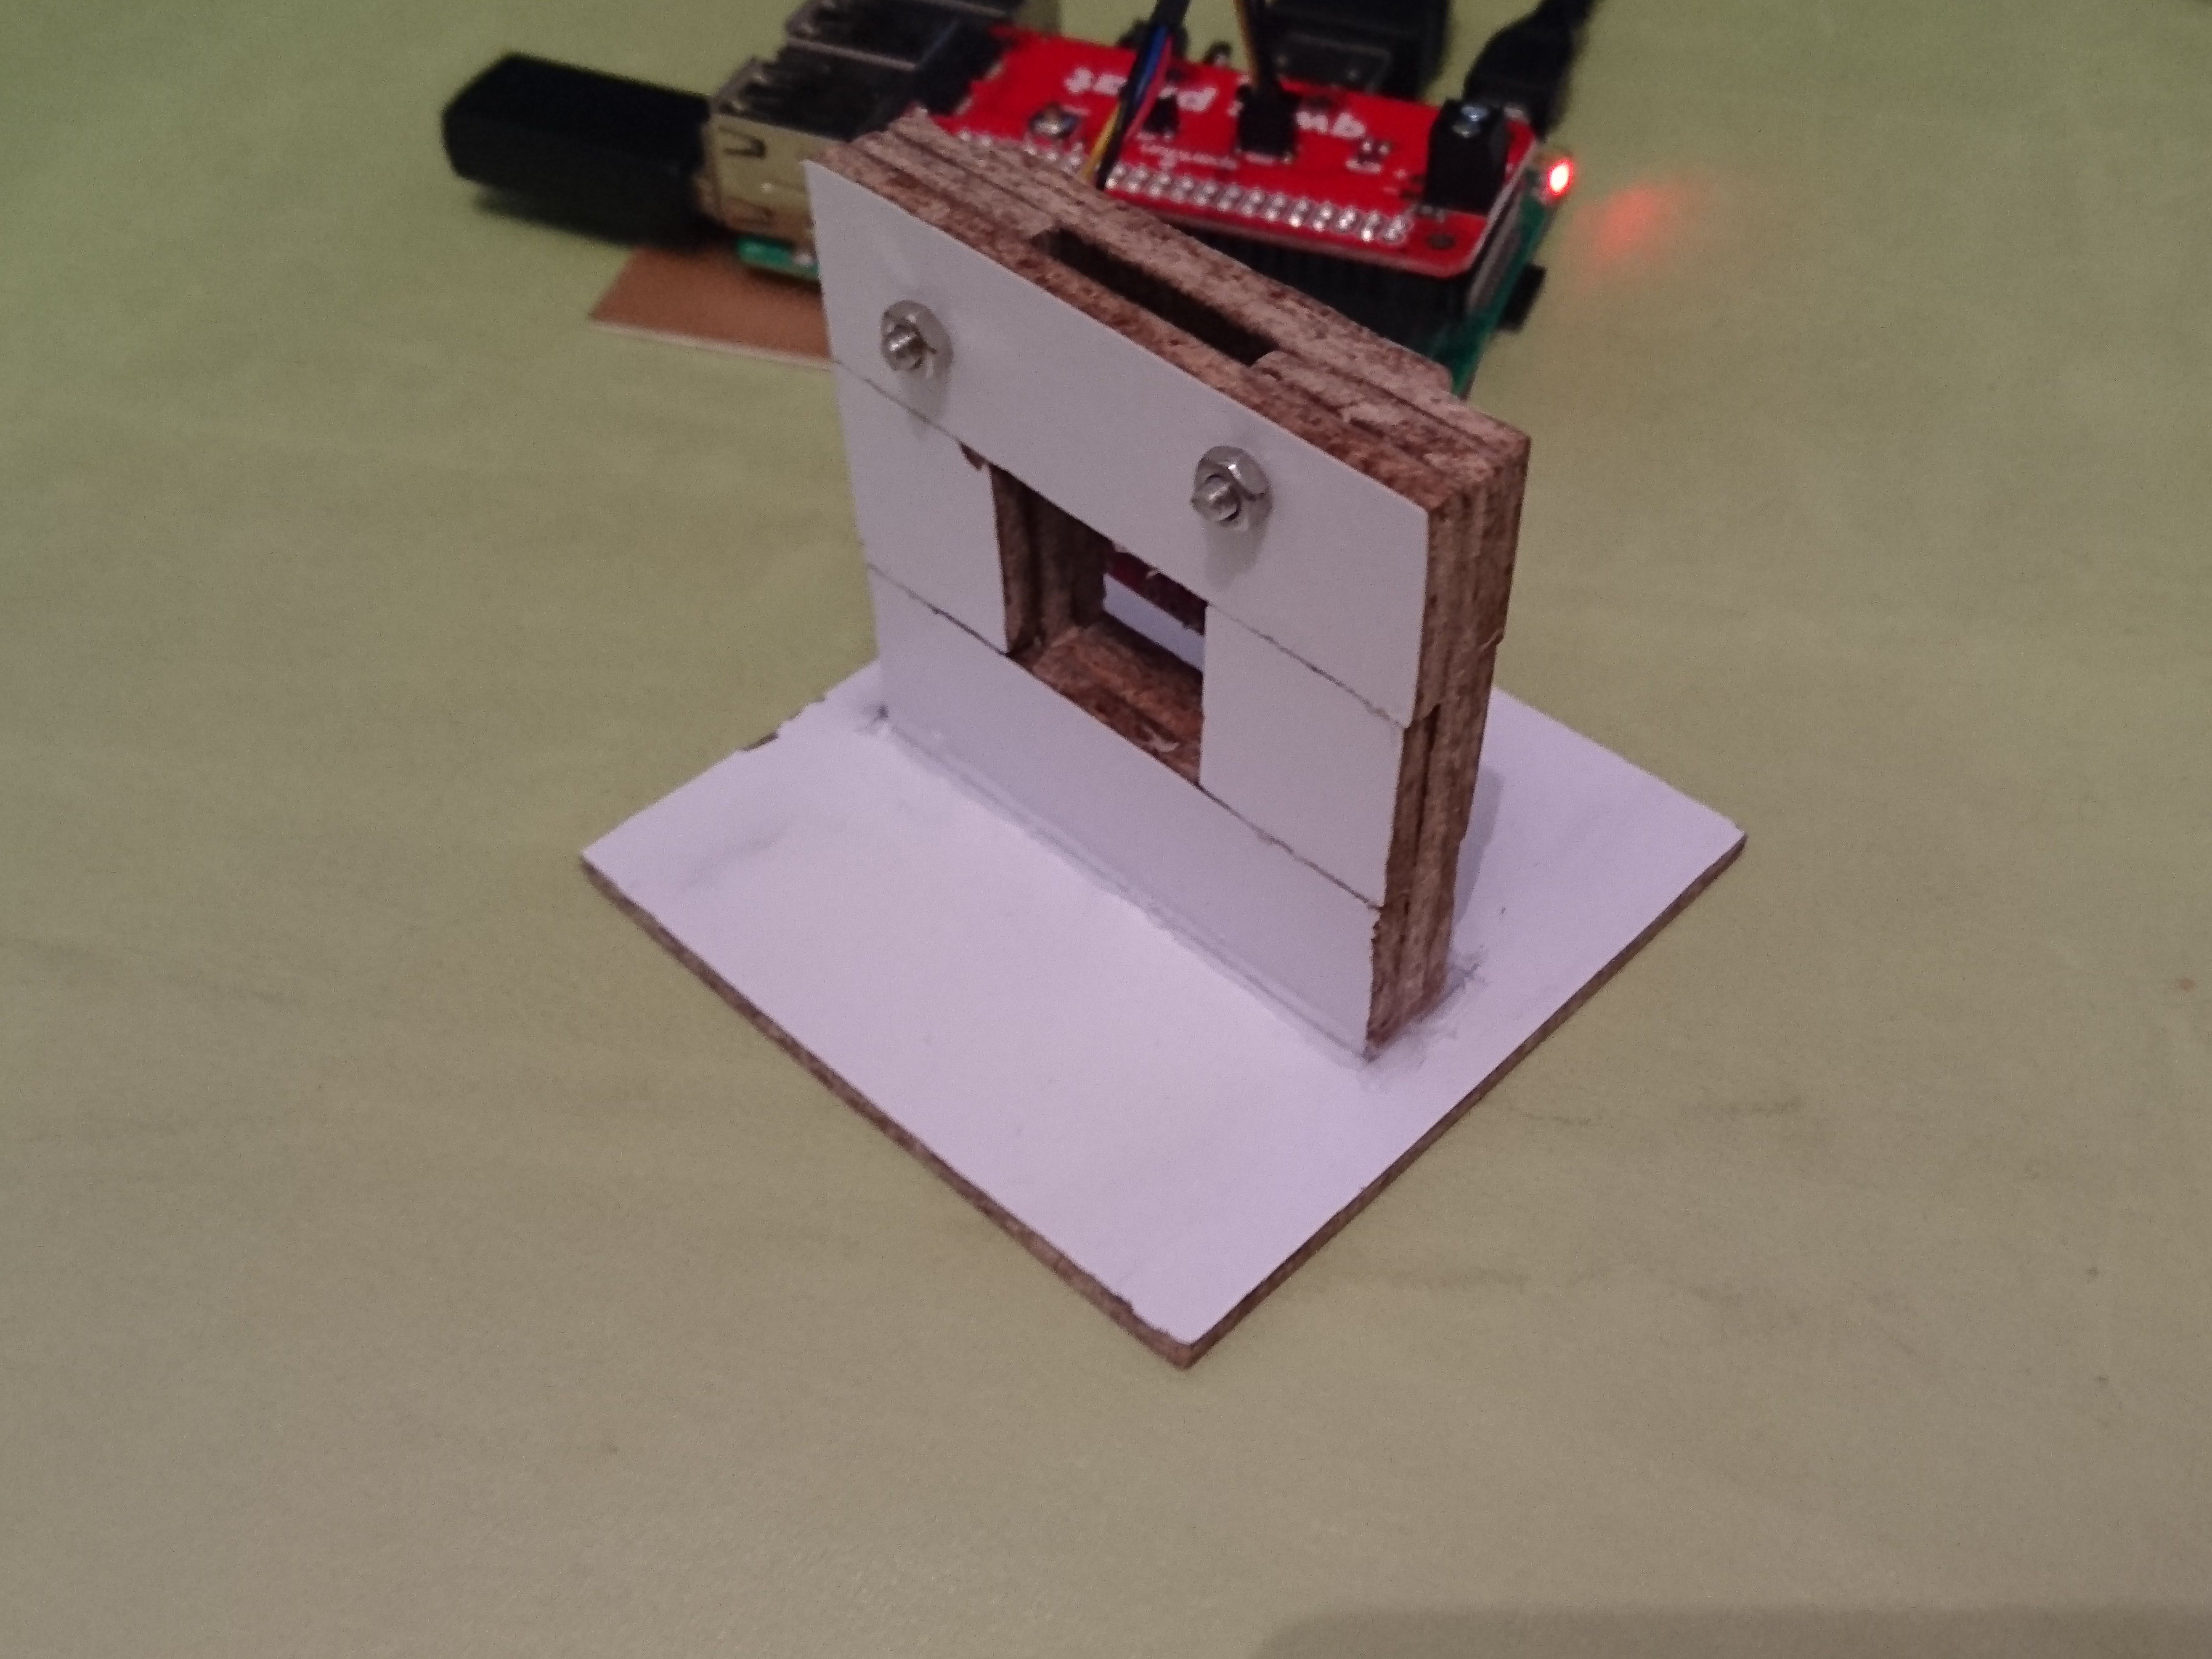
I have used wood sandpaper to reduce the protruding edges. In the end I have mounted the sensor by means of a 20(W) x 45(L)mm strip as shown in the following image.
![]()
You should also consider using a drill and silicone, as well as having four screws. Here, I think I spent more time trying to center the sensor.
![]()
Schematic
![]()
I have carried out three experiments, which I describe below. The first two I have repeated the examples of the installed library, and the third example is a modification that I have made to capture data in a text file for future analysis.
Library Installation
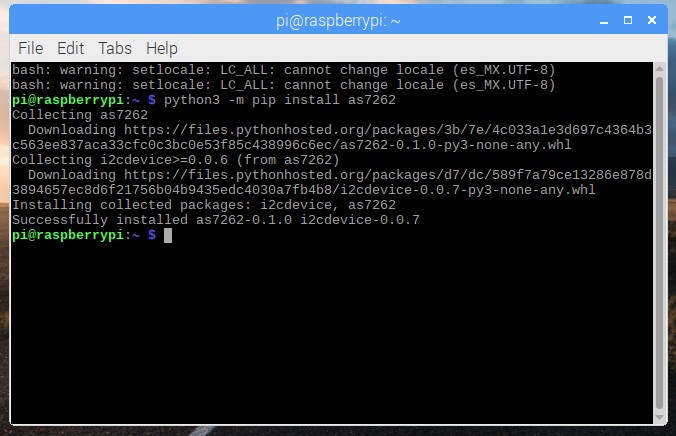
I have installed the library from the following github repository: https://github.com/pimoroni/as7262-python
It is a stable library and you just have to enter the following command:
python3 -m pip install as7262![]()
Additionally, I have installed the following library that is used for the AS7262 (visible light) and AS7263 (infrared light) sensors: https://github.com/HeyLlama/as726x-python
git clone https://github.com/pimoroni/as7262-python cd as7262-python sudo ./install.sh --unstable![]()
Spectrum
Below I show you the code of this example. Here we obtain the values of the spectrum of visible colors detected by the sensor (violet, blue, green, yellow, orange and red). Note that the AS7262 sensor has a 16-bit ADC, so it measures an integer part and a decimal part.
spectrum.py
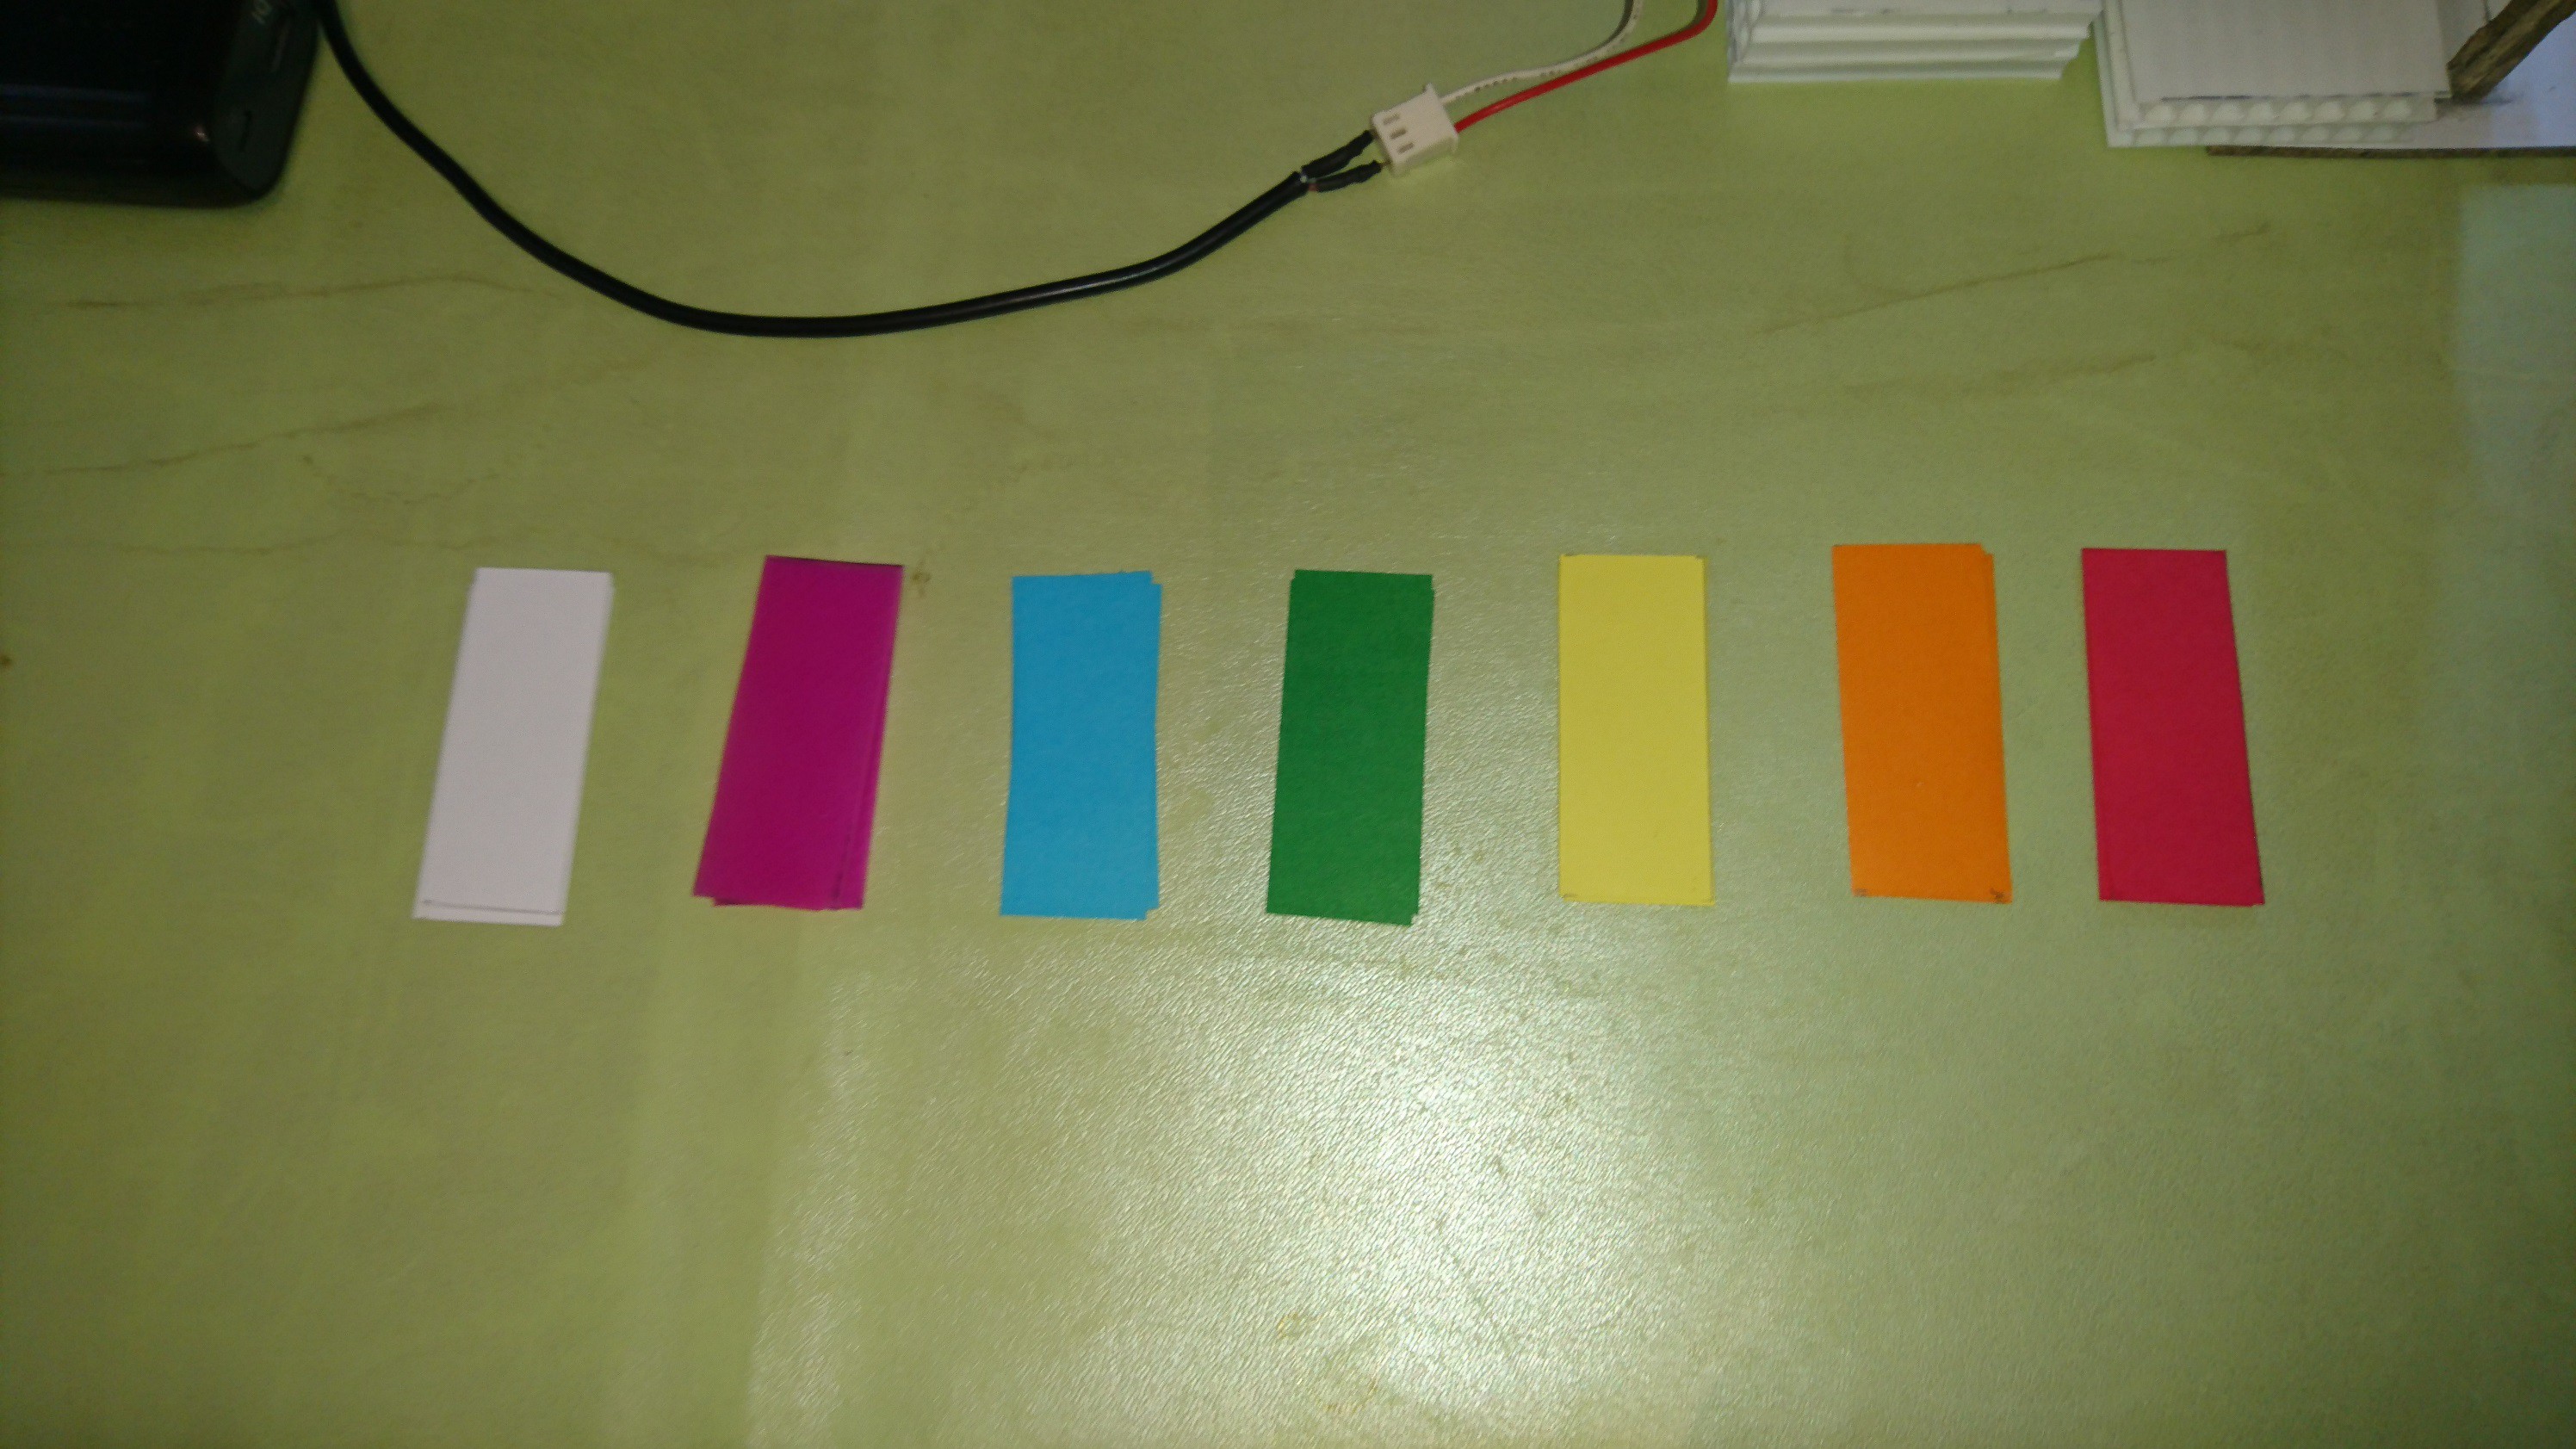
Before the test, I show you the colored filter strips that I used in my experiment. I have used strips of paper with color on both sides with the dimensions of 20(W) x 50(L)mm. Through experimentation, I discovered that sometimes inserting one color strip was enough, and in other cases two or three color strips were inserted to detect color satisfactorily.
![]()
Bar Graph
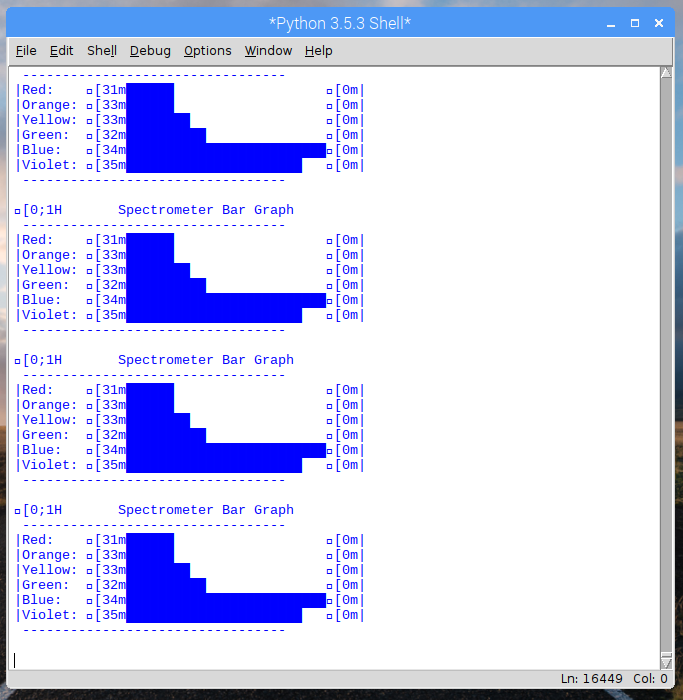
The following code shows us a bar graph of colors detected. Unlike the previous experiment, this one shows us the values qualitatively. In this way we can deduce that the filter absorbs one or more colors, and they are the same colors that the sensor detects.
bargraph.py
Below is an example of the graph obtained for the blue filter.
![]()
Data Captured
Here we use the AS7262 functions to operate the board. It begins with some initial setup, and then puts the board into measurement mode 2, which continuously takes measurements for all colours. This is returned as a list called "results", which is then printed in a mostly human-readable form. Additionally, a text file is created to save the sensor values each interaction, and the script is interrupted when we use Ctrl+C.
datacaptured.py
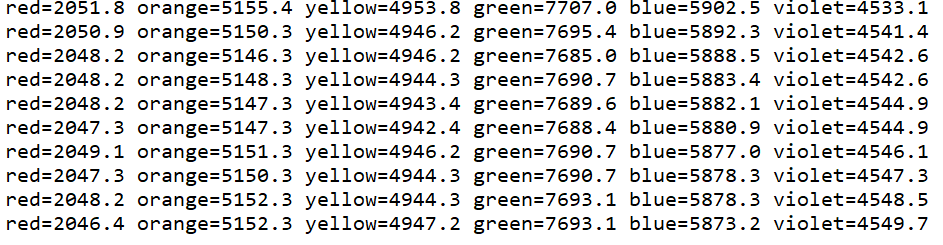
Below I show you an example of data captured for the green filter.
![]()
My idea is to use this data to make graphs in excel and analyze the information statistically.
Conclusion
According to what was seen in chapter one (introduction), a part of the light emitted by the lamp reaches the AS7262 light sensor due to diffraction. Next I show you the most important conclusions with the color filters.
- A blue filter weakens the yellow, orange and red signals very strongly.
![]()
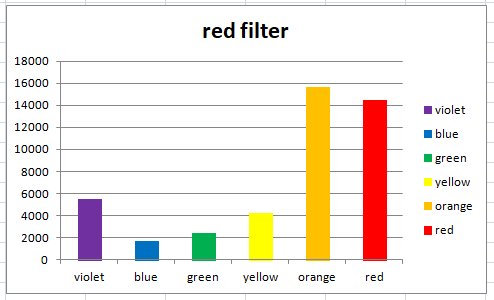
- In contrast, a red filter will block blue and green light strongly.
![]()
- A green filter will block red light.
![]()
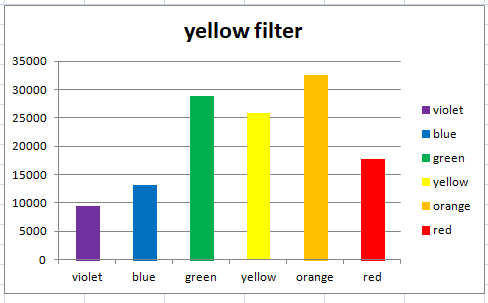
- A yellow filter will block blue and violet light slightly.
![]()
-
2. Getting Started
09/10/2023 at 02:43 • 0 commentsIn this chapter I will show you the main features of Raspberry Pi 3B+, Qwiic pHAT module and AS7262 sensor. Also we learn how to setup the Raspberry Pi and how to detect the peripheral of the sensor.
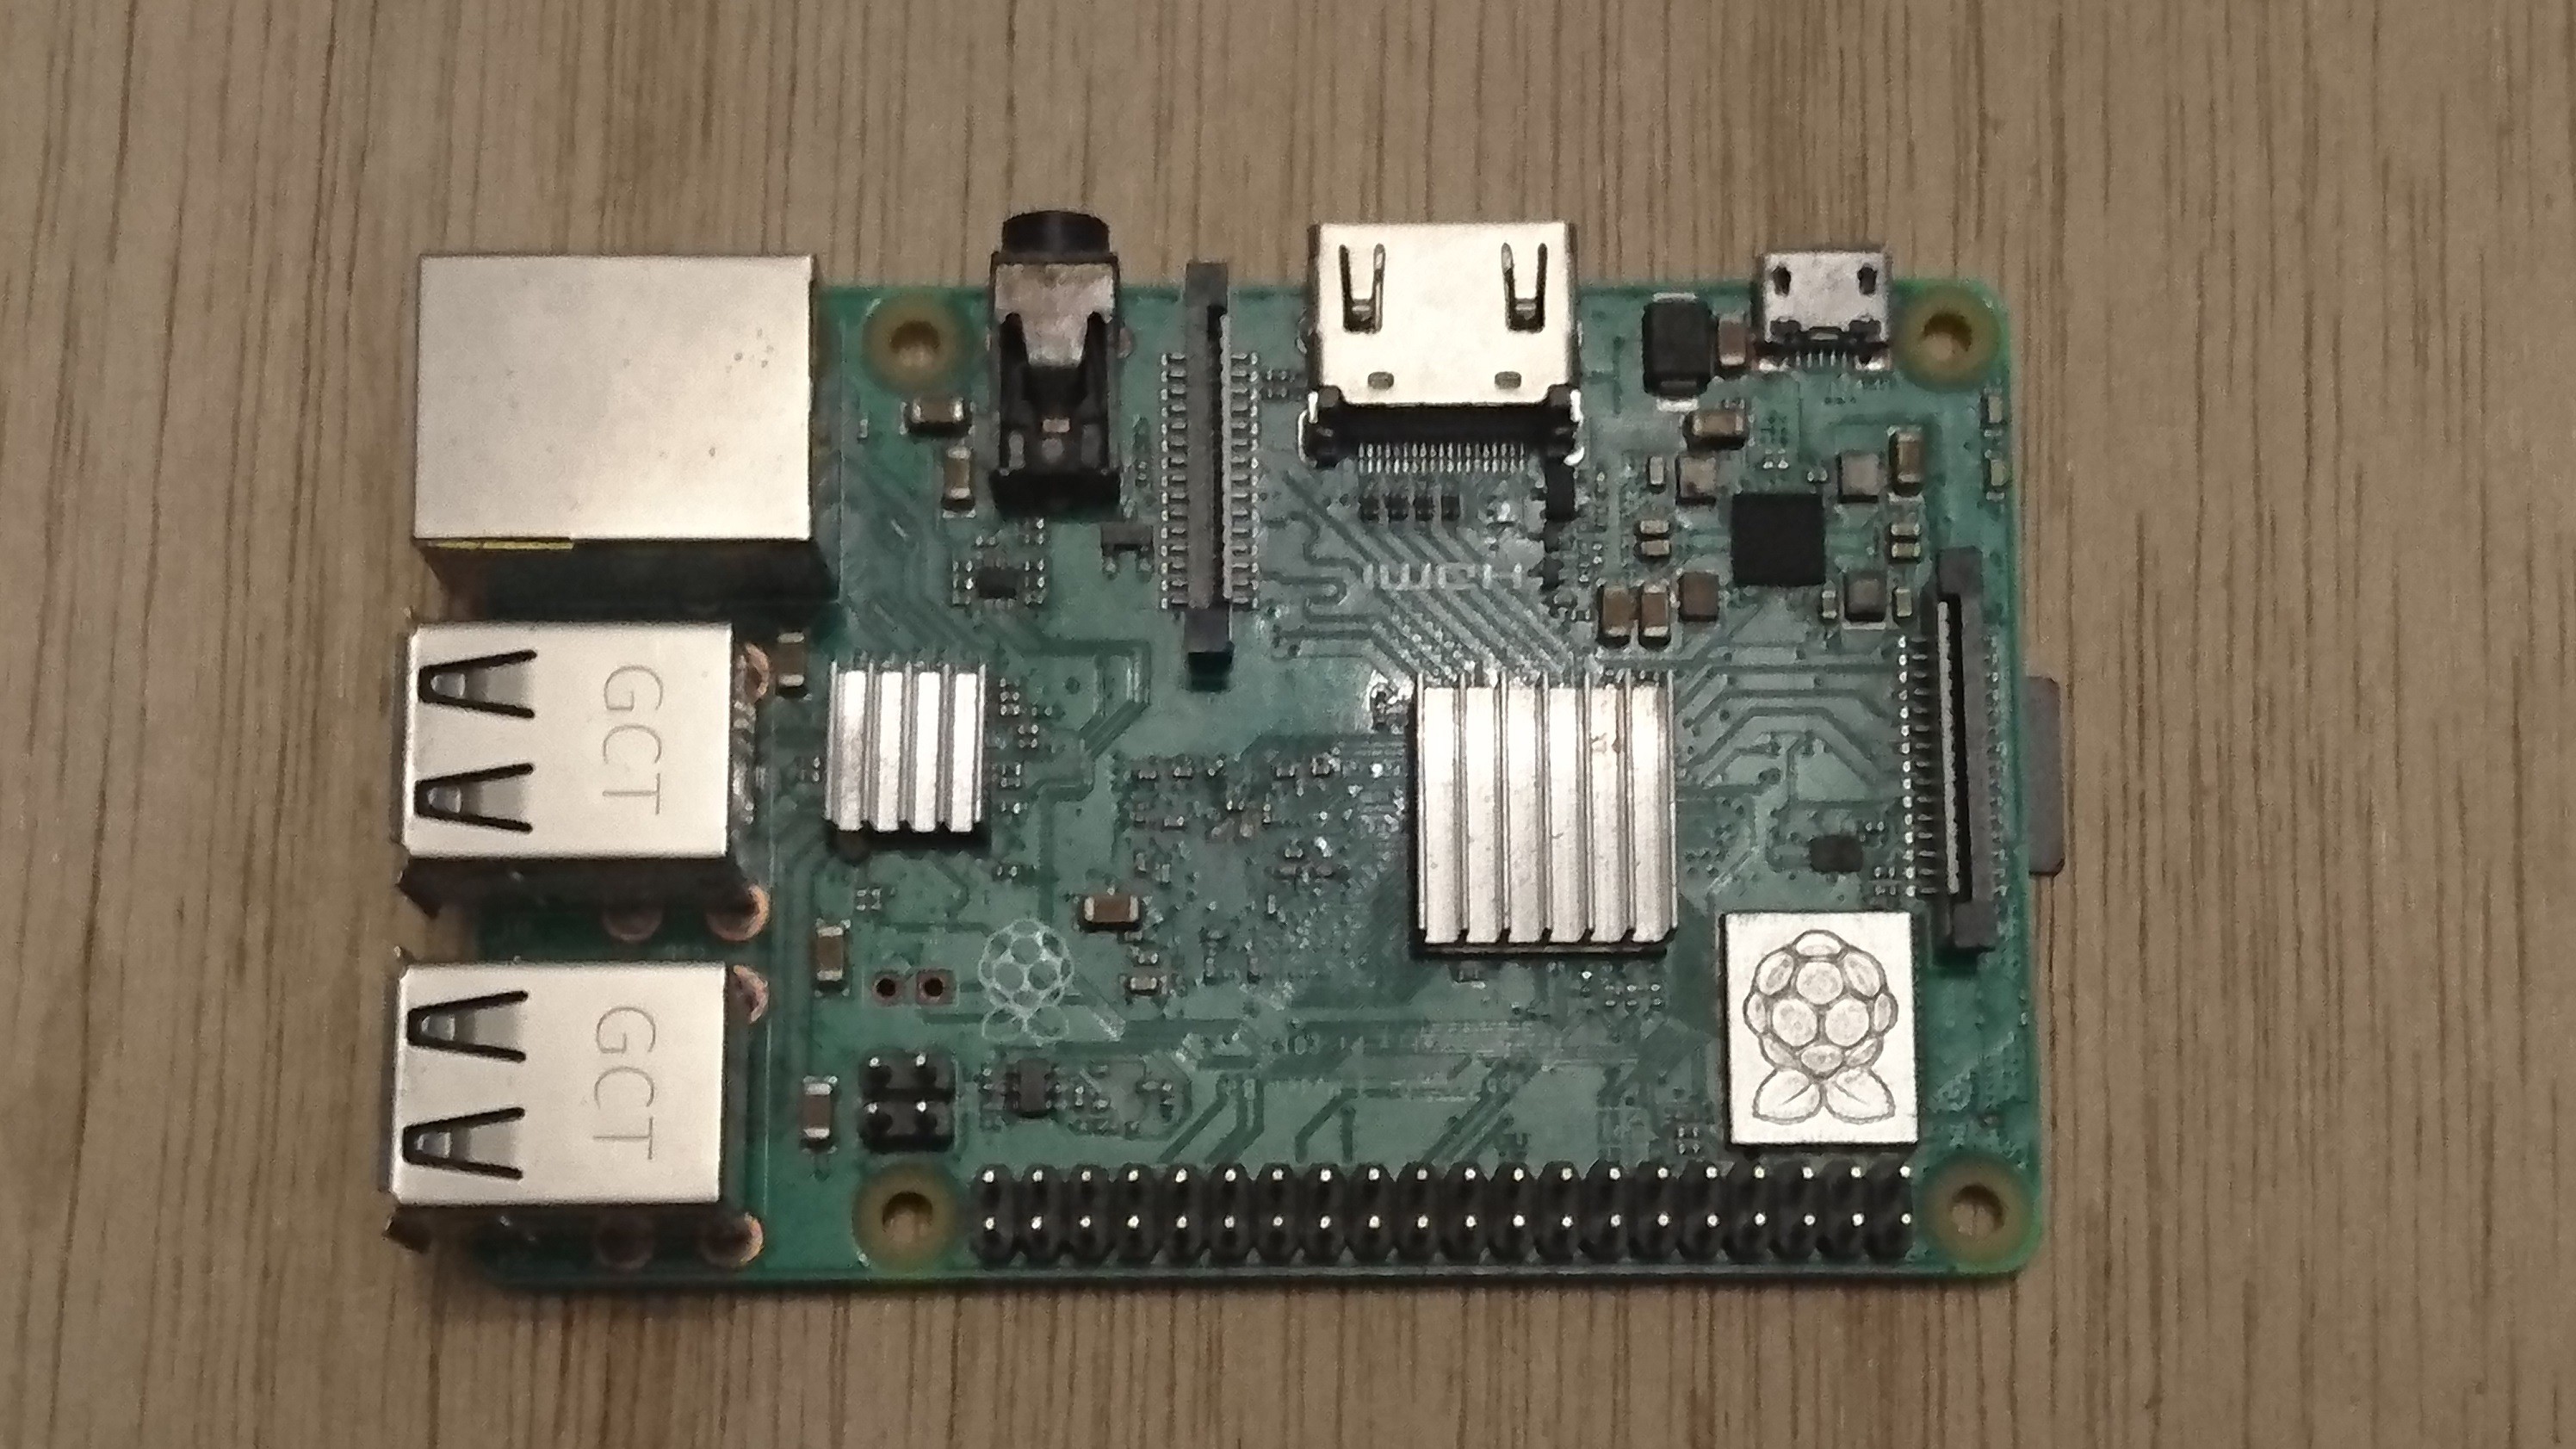
Raspberry Pi 3B+
The Raspberry Pi 3 B+ provides you with the same Pi as before, but now with gigabit and PoE capable Ethernet, as well as better overheating protection for the 64-bit processor. This computer small has a Broadcom BCM2837, an ARM Cortex-A53 64-bit Quad Core Processor System-on-Chip operating at 1.4GHz. The GPU provides OpenGL ES 2.0, hardware-accelerated OpenVG and 1080p30 H.264 high-profile decode. It is capable of 1Gpixel/s, 1.5Gtexel/s or 24 GFLOPs of general-purpose compute.
![]()
- Broadcom BCM2837B0, Cortex-A53 (ARMv8) 64-bit SoC @ 1.4GHz
- 1GB LPDDR2 SDRAM
- 2.4GHz and 5GHz IEEE 802.11.b/g/n/ac wireless LAN, Bluetooth 4.2, BLE
- Gigabit Ethernet over USB 2.0 (maximum throughput 300 Mbps)
- Extended 40-pin GPIO header
- Full-size HDMI
- 4 USB 2.0 ports
- CSI camera port for connecting a Raspberry Pi camera
- DSI display port for connecting a Raspberry Pi touchscreen display
- 4-pole stereo output and composite video port
- Micro SD port for loading your operating system and storing data
- 5V/2.5A DC power input
- Power-over-Ethernet (PoE) support (requires separate PoE HAT)
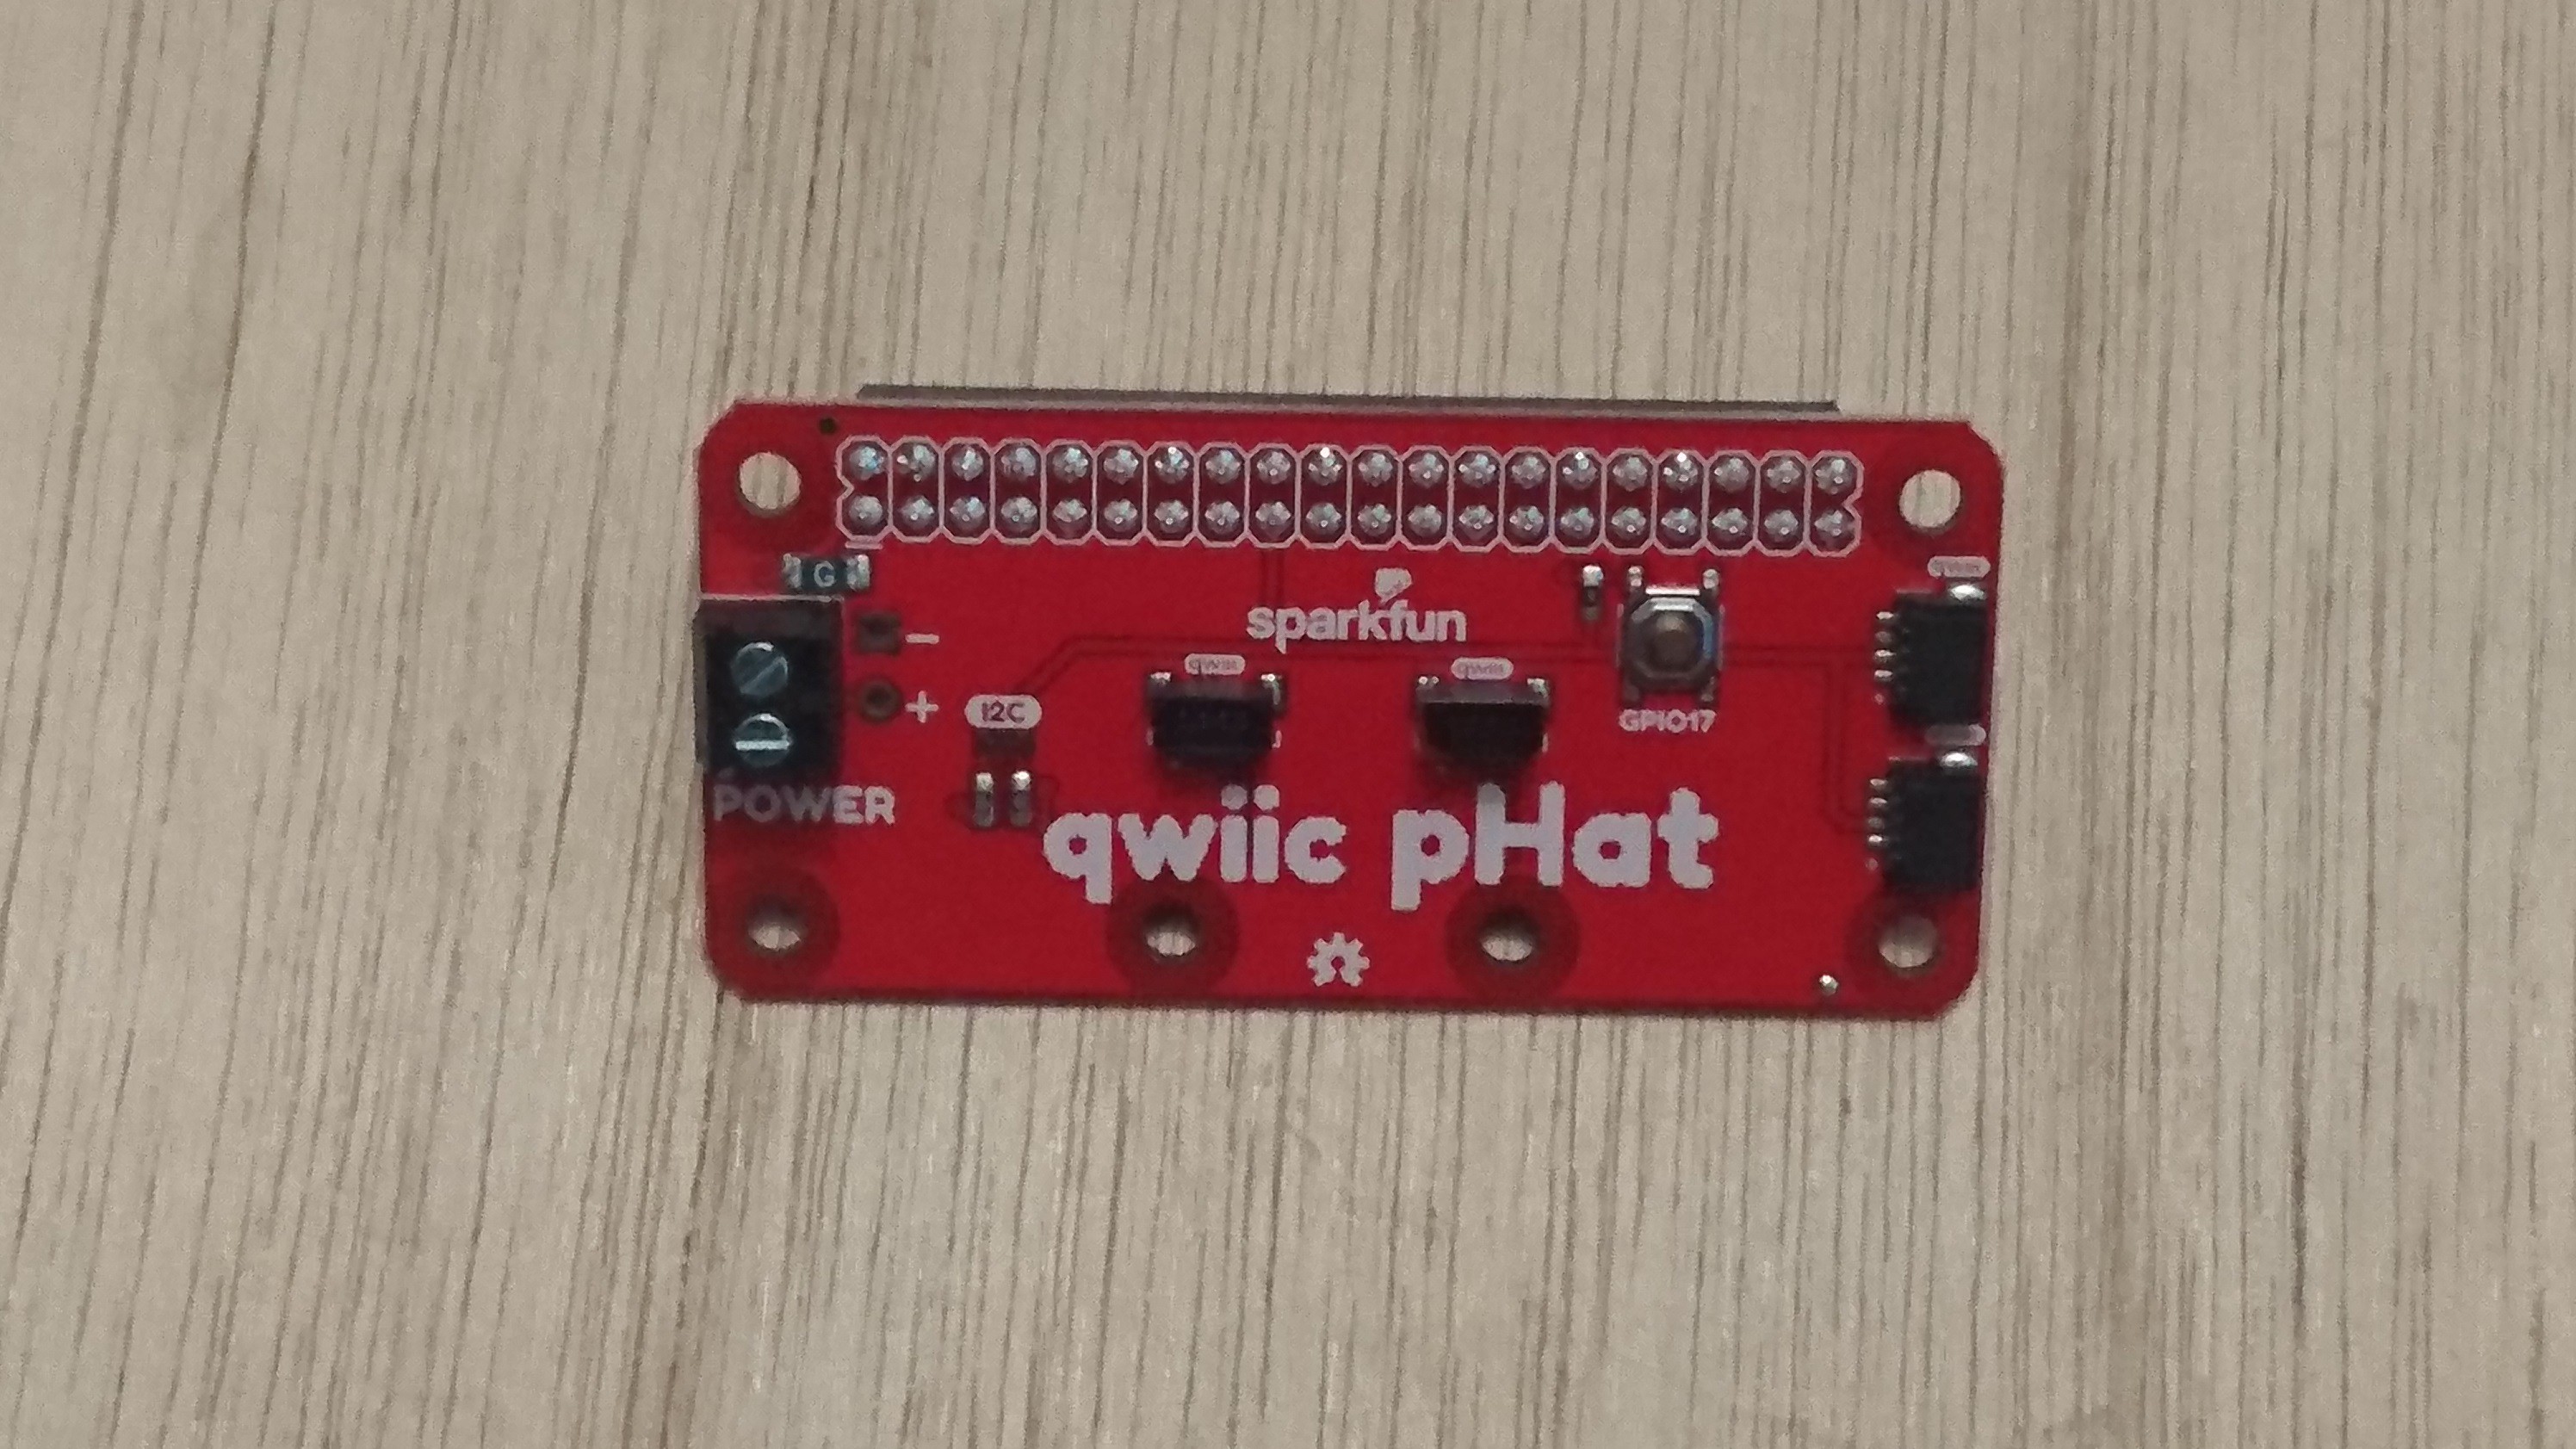
SparkFun Qwiic pHAT v2.0
The SparkFun Qwiic pHAT connects the I2C bus (GND, 3.3V, SDA, and SCL) on your Raspberry Pi to an array of Qwiic connectors on the HAT. Since the Qwiic system allows for daisy-chaining boards with different addresses, you can stack as many sensors as you’d like. The Qwiic pHAT V2.0 has four Qwiic connect ports (two on its side and two vertical), all on the same I2C bus. It also add a simple 5V screw terminal to power boards that may need more than 3.3V and a general-purpose button. This pHAT is compatible with any Raspberry Pi that utilizes the standard 2x20 GPIO header.
![]()
- 4x Qwiic Connection Ports
- 1x 5V Tolerant Screw Terminal
- 1x General Purpose Button
- HAT-compatible 40-pin Female Header
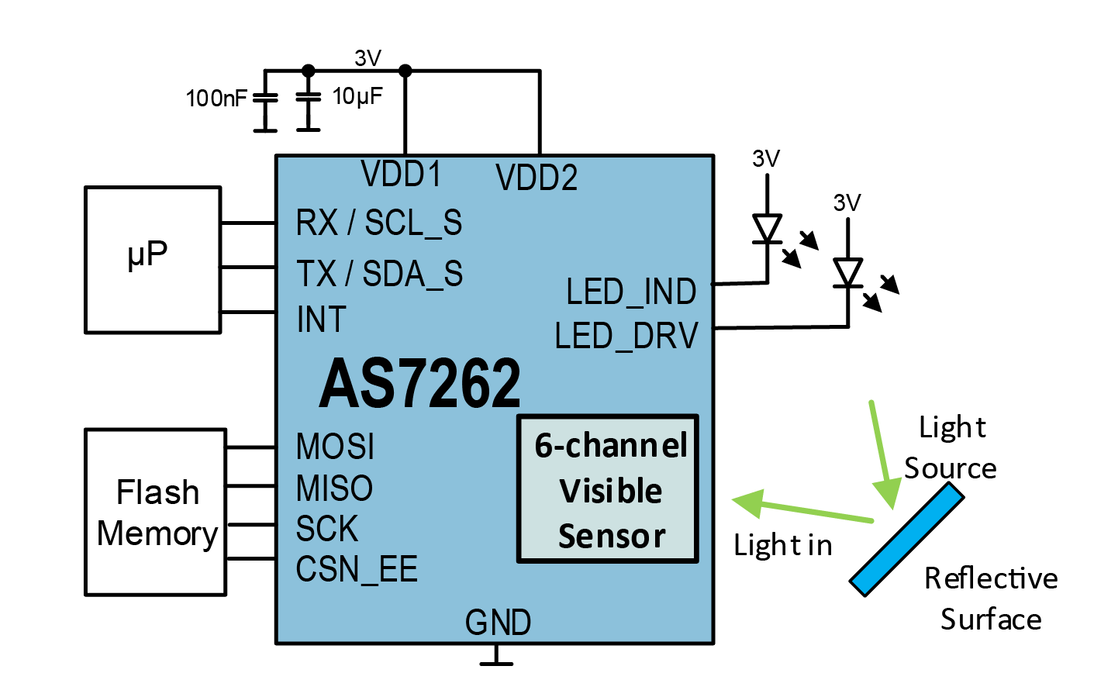
AS7262 6-channel Visible Light Sensor
The SparkFun AS7262 spectrometer detects wavelengths in the visible range at 450, 500, 550, 570, 600 and 650nm of light each with 40nm of full-width half-max detection. The board also has multiple ways for you to illuminate objects that you will try to measure for a more accurate spectroscopy reading. There is an onboard LED that has been picked out specifically for this task, as well as two pins to solder your own LED into. The AS7262 Breakout is unique in its ability to communicate by both an I2C interface and serial interface using AT commands.
![]()
- 6 visible channels: 450nm, 500nm, 550nm, 570nm, 600nm and 650nm, each with 40nm FWHM
- Visible filter set realized by silicon interference filters
- 16-bit ADC with digital access
- Programmable LED drivers
- 2.7V to 3.6V with I2C interface
- 2x Qwiic connectors
![]()
Applications:
- Visible spectrometry.
- Spectral Color Matching and monitoring
- Authentication and counterfeit detection
- Detection of color mixture effects (e.g. textiles, paints, etc.)
- Fluid monitoring and analysis (using reagents)
- ID marker detection
Below you can see the spectral responsivity of this sensor.
![]()
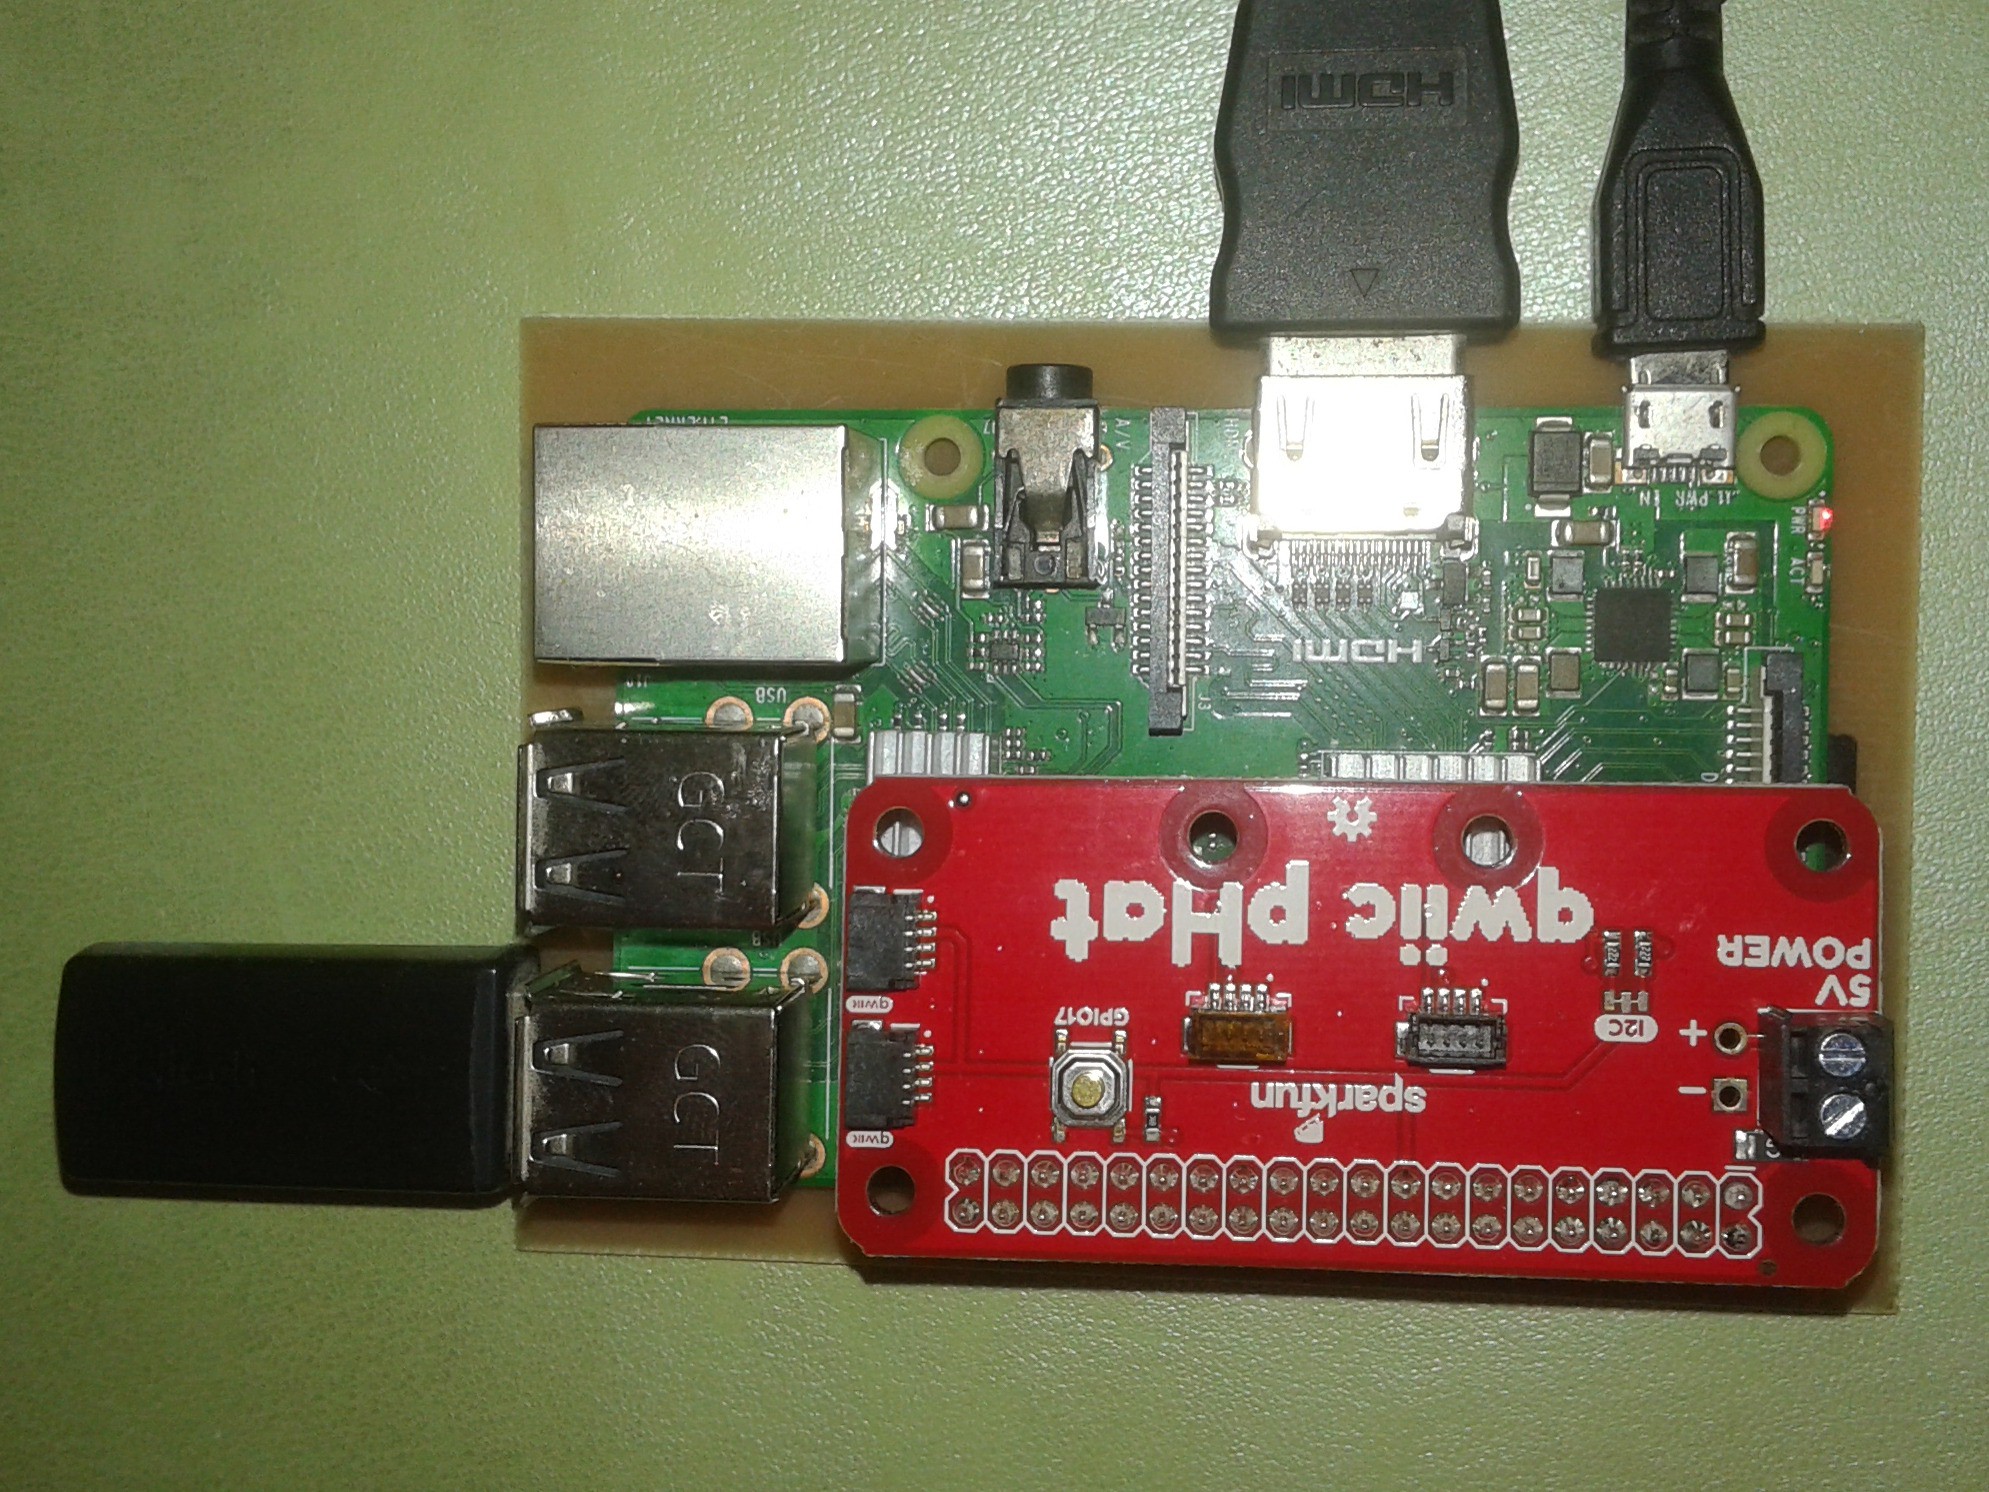
Configuring the Pi
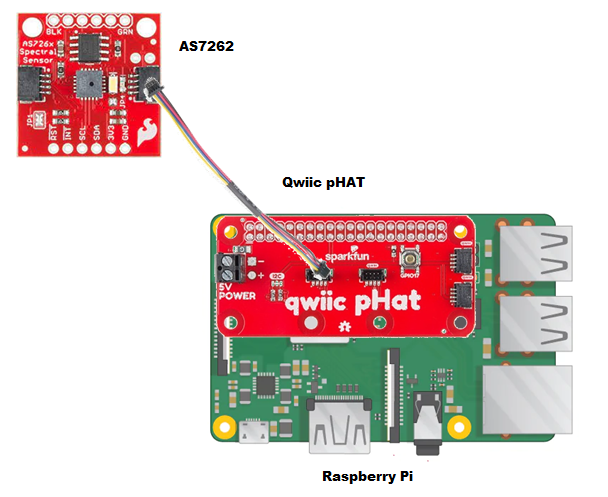
To get started with your Qwiic pHAT, simply plug it into the headers on the Raspberry Pi with the letters facing you. We'll use the Qwiic pHAT v2.0 in the following image to connect a Qwiic device.
![]()
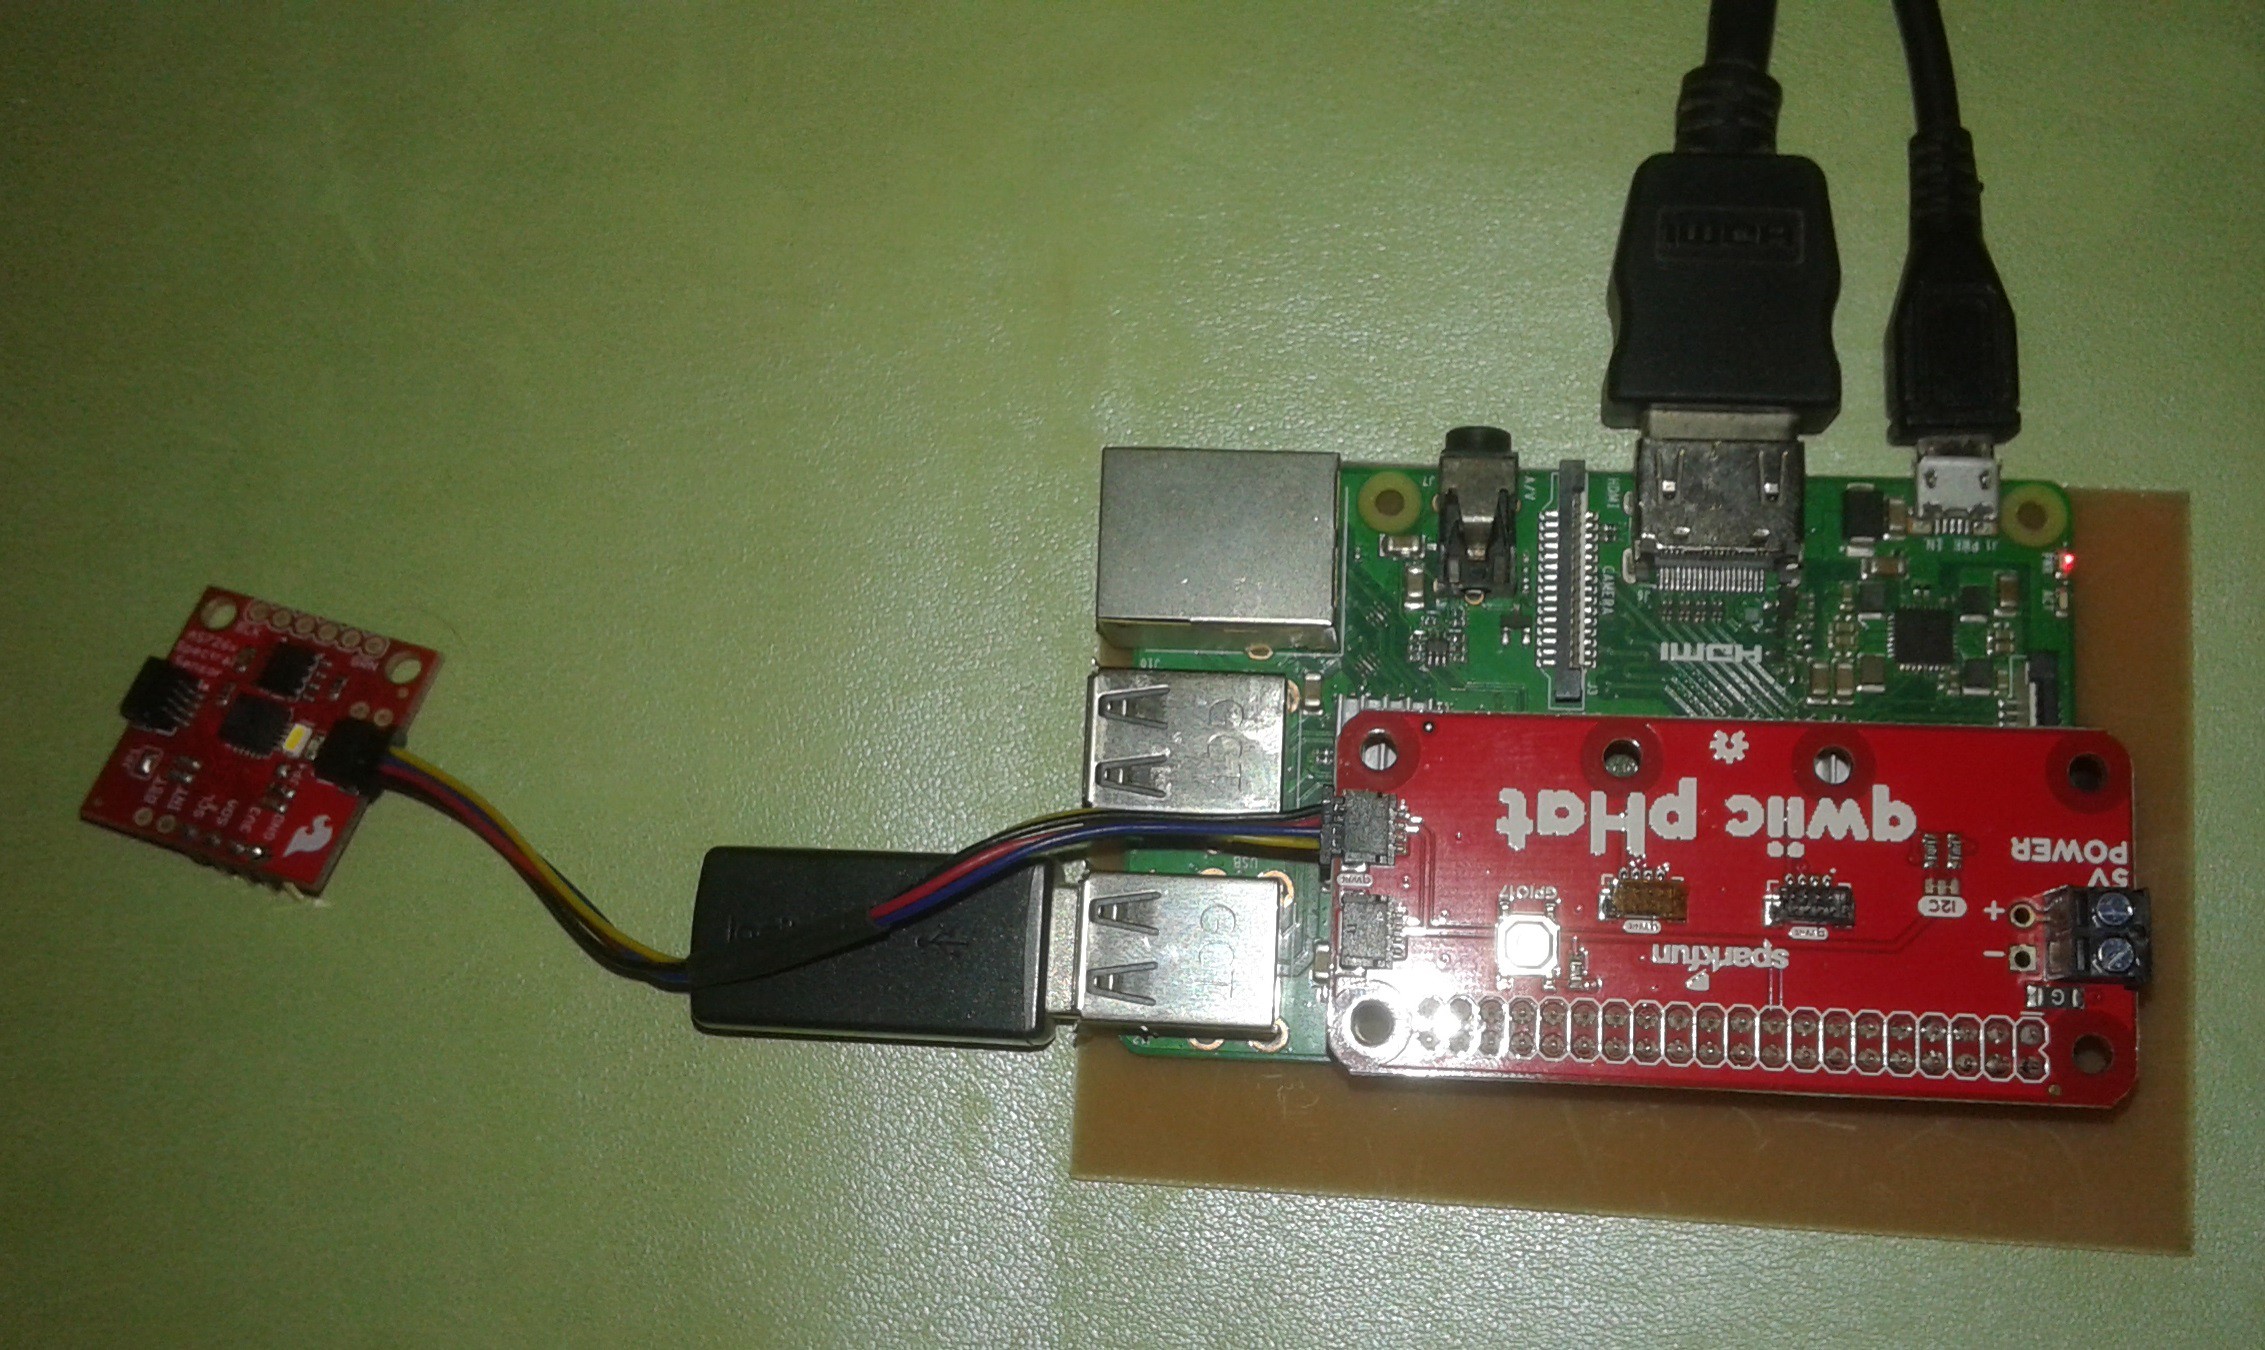
Once the pHAT is plugged in, you can start plugging in AS7262 6-channel Visible Light Sensor.
![]()
The Raspberry Pi Configuration via Desktop GUI
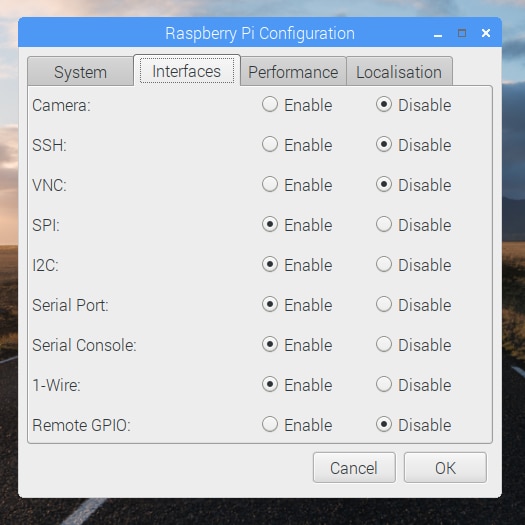
You can use the Desktop GUI by heading to the Pi Start Menu > Preferences > Raspberry Pi Configuration. A window will pop up with different tabs to adjust settings. What we are interested is the Interfaces tab. Click on the tab and select Enable for I2C. Click on the OK button.
![image]() It's recommend restarting your Pi to ensure that the changes to take effect. Click on the Pi Start Menu > Preferences > Shutdown. Since we just need to restart, click on the Restart button. The system will reboot. When it comes back up, log in and enter the following command
It's recommend restarting your Pi to ensure that the changes to take effect. Click on the Pi Start Menu > Preferences > Shutdown. Since we just need to restart, click on the Restart button. The system will reboot. When it comes back up, log in and enter the following commandls /dev/*i2c*![image]() The Pi should respond with
The Pi should respond with/dev/i2c-1
Which represents the user-mode I2C interface. There is a set of command-line utility programs that can help get an I2C interface working. You can get them with the apt package manager. Enter the following command.
sudo apt-get install -y i2c-tools![image]() In particular, the i2cdetect program will probe all the addresses on a bus, and report whether any devices are present. Enter the following command in the command line. The -y flag will disable interactive mode so that you do not have to wait for confirmation. The 1 indicates that we are scanning for I2C devices on I2C bus 1.
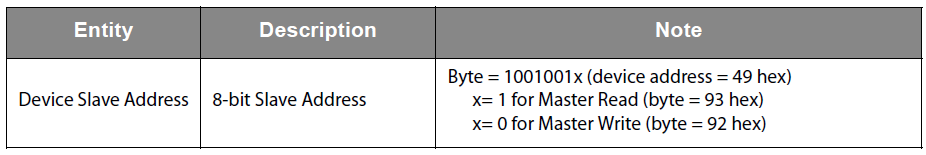
In particular, the i2cdetect program will probe all the addresses on a bus, and report whether any devices are present. Enter the following command in the command line. The -y flag will disable interactive mode so that you do not have to wait for confirmation. The 1 indicates that we are scanning for I2C devices on I2C bus 1.i2cdetect -y 1You will get an output from your Raspberry Pi similar to the output below.
![image]() This map indicates that there is a peripheral at address 0x49, and according to the AS7262 datasheet, device address is 49 hex.
This map indicates that there is a peripheral at address 0x49, and according to the AS7262 datasheet, device address is 49 hex.![image]()
Conclusion
- We have learned the features of the Raspberry Pi 3B+, and Sparkfun's PHAT device that is useful for interfacing sensors with Qwiik connectors easily like the AS7262 6-channel Visible Light Sensor.
- Finally we have configured the Raspberry Pi as well as the pHAT module and we have done a simple test to detect a peripheral.
- In the next chapter I will install the libraries of the AS7262 sensor, and I will assemble the first module or device to do tests with color filters.
-
1. Introduction
09/10/2023 at 02:33 • 0 commentsOptics
I assume you already have basic knowledge of optics. Optics is the study of light. Optics describes how light is created and how it travels. An important part of optics is the study of what happens when light hits different surfaces. When light hits a surface, it may be reflected, refracted, or absorbed.
- Reflection occurs when light hits a surface and bounces back. Reflected light makes images appear in mirrors and in other smooth, shiny surfaces.
- Refraction happens when light changes direction, or bends, when it moves from one material to another. For example, light traveling through the air refracts when it hits water. This can make a straw in a glass of water look bent at the surface of the water.
- Some surfaces absorb, or take in, light. This causes the surface to heat up. For example, a sidewalk heats up on a hot, sunny day because it is absorbing light.
![]()
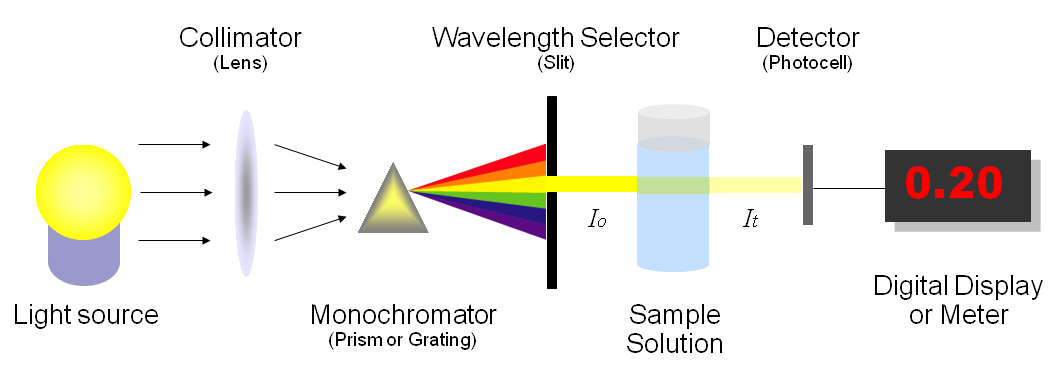
Spectrophotometry
Spectrophotometry is the quantitative measurement of the interaction of ultraviolet (UV), visible, and infrared (IR) radiation with a material and has an impact on a wide field of science and technology. Spectrophotometry uses photometers, known as spectrometers, that can measure the intensity of a light beam at different wavelengths.
![]()
Types of spectrometers:
- Infrared spectrum: study and identification of chemical substances
- Ultraviolet spectrum: identification of molecules, black light.
- NMR spectrometer: atomic/nuclear absorption.
- Reflectance spectrometer: this is the spectrum used in paint and body shops to measure color (konica minolta, etc.)
- Double beam spectrometer.
- Single beam spectrometer. A double-beam spectrometer compares the light intensity between two light paths, one path containing a reference sample and the other the test sample. A single-beam spectrometer measures the relative light intensity of the beam before and after a test sample is inserted. Although comparison measurements from double-beam instruments are easier and more stable, single-beam instruments can have a larger dynamic range and are optically simpler and more compact. Additionally, some specialized instruments, such as spectrometers built onto microscopes or telescopes, are single-beam instruments due to practicality.
Homemade Spectrometer
Open source experiment kit made with the AS7262 (six colors) and AS7263 (near infrared) spectral sensors and the Raspberry Pi


 It's recommend restarting your Pi to ensure that the changes to take effect. Click on the Pi Start Menu > Preferences > Shutdown. Since we just need to restart, click on the Restart button. The system will reboot. When it comes back up, log in and enter the following command
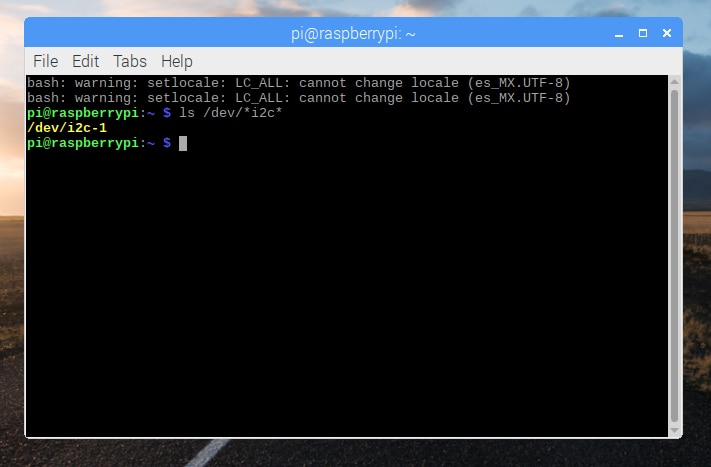 The Pi should respond with
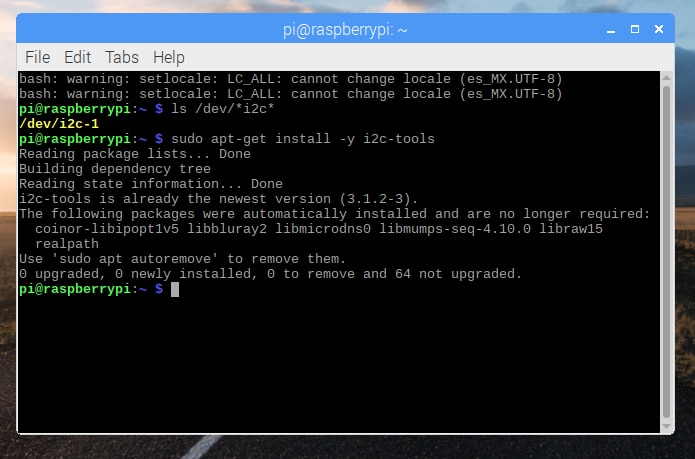 In particular, the i2cdetect program will probe all the addresses on a bus, and report whether any devices are present. Enter the following command in the command line. The -y flag will disable interactive mode so that you do not have to wait for confirmation. The 1 indicates that we are scanning for I2C devices on I2C bus 1.
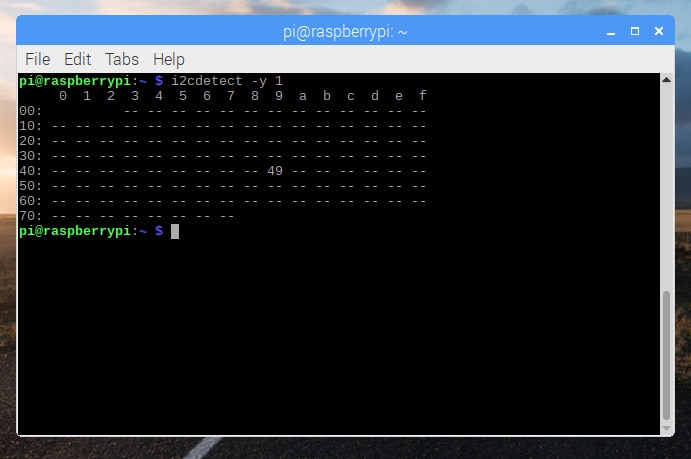 This map indicates that there is a peripheral at address 0x49, and according to the AS7262 datasheet, device address is 49 hex.