MetaShunt was designed for high dynamic range current measurement of embedded systems, particularly ultra-low power and IoT systems. These measurements help verify the functionality of a project or product. They tie in nicely with the power budgeting tools I've also developed, hosted on Hackaday.io here. However, I previously hadn't connected the two. This log demonstrates the new comparison tools I've added to the MetaShunt Interface Github repo, how they work, and provides some examples of their use.
First, lets look at the basic use of these tools - where they are located and what the interface looks like. The comparison tools are included in a folder on the MetaShunt interface. The key Python file to look for is metashunt_profile_processing.py. This can be used to set up the comparison plots between the outputs of MetaShunt V1, MetaShunt V2, Otii Arc, and my modeling tools. Each has its own enumeration to tell the parser what type of file it is, and the files can be temporally aligned manually, with no alignment, or by attempting cross-correlation (which may or may not work depending on what your signal looks like).
Next, let's look at an example. In this example, my Nanosleeper development board is operating between run mode, run mode with LEDs on, and deep sleep mode. The script to view this example is in the Examples/Nanosleeper folder for the Comparison Tools on the metashunt_interface repo. The code is very simple.
import sys

sys.path.append('../../')

import metashunt_profile_processing as mpp

if __name__ == "__main__":
    metashunt_profile_1 = mpp.PROFILE(filename="metashunt_v1_nanosleeper.csv", filetype=mpp.FILETYPE.METASHUNT_LOG,
                                      alignment_type=mpp.ALIGNMENTTYPE.TIMESHIFT, label="MetaShunt V1", t_shift=-6.1659)

    metashunt_profile_2 = mpp.PROFILE(filename="metashunt_v2_nanosleeper.csv", filetype=mpp.FILETYPE.METASHUNT_LOG,
                                      alignment_type=mpp.ALIGNMENTTYPE.TIMESHIFT, label="MetaShunt V2", t_shift=3.26803)

    arc_profile_1 = mpp.PROFILE(filename="otii_arc_nanosleeper.csv", filetype=mpp.FILETYPE.OTII_LOG,
                                      alignment_type=mpp.ALIGNMENTTYPE.TIMESHIFT, label="Otii Log", t_shift=0.0)
    model_profile_1 = mpp.PROFILE(filename="Nanosleeper_sim.csv", filetype=mpp.FILETYPE.EMBEDDED_POWER_MODEL,
                                      alignment_type=mpp.ALIGNMENTTYPE.TIMESHIFT, label="Model", t_shift=1.8979)


    profiles = [metashunt_profile_1, metashunt_profile_2, arc_profile_1, model_profile_1]

    mpp.plot_profiles(profiles)
The four files are processed, manually timeshifted, and then plots are generated. This automatically generates plots of current, power, and accumulated energy use. Note that the power and energy calculations use a system voltage parameter that is part of the Profile class and defaults to 3.3V.
The current plot, when zoomed to the first wakeup cycle, looks like the plot below. Note that the logs have different lengths and start at different points, so they don't fully overlap.
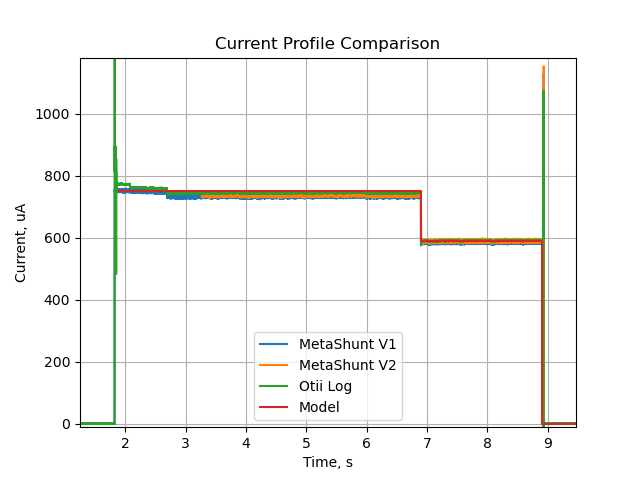
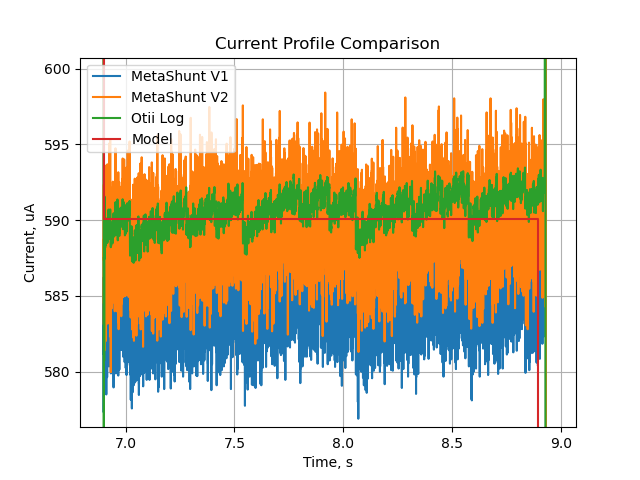
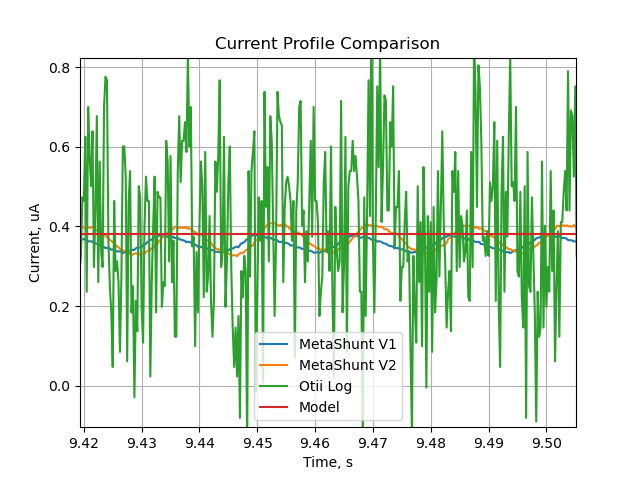
This comparison tool is helpful for evaluating between firmware updates or for comparing to a predictive model of how much power your product or project should consume. For example, you can zoom into different sections and compare data from MetaShunt to data from the model (and in this case from an Otii Arc). Note that at higher current, the Otii Arc appears to have lower noise than MetaShunt V1 and V2, but appears to be much noisier at low current below 500nA.
Discussions
Become a Hackaday.io Member
Create an account to leave a comment. Already have an account? Log In.