Today I am proud to announce the launch of the first MetaShunt GUI, available now on the MetaShunt Interface Github repo!

Previously, the only interface to use MetaShunt V1 or V2 was a set of Python scripts which would allow for continuous (for a set amount of time) or burst measurements. At the end of the measurements, a set of plots would pop up. The user could alternatively tell the system to write the measurement data to a log instead of displaying it on a plot. A separate set of Python scripts enabled comparing two or more logs with each other, in order to analyze relative power consumption.
While functional, these were not user friendly. All that has now changed with this GUI!
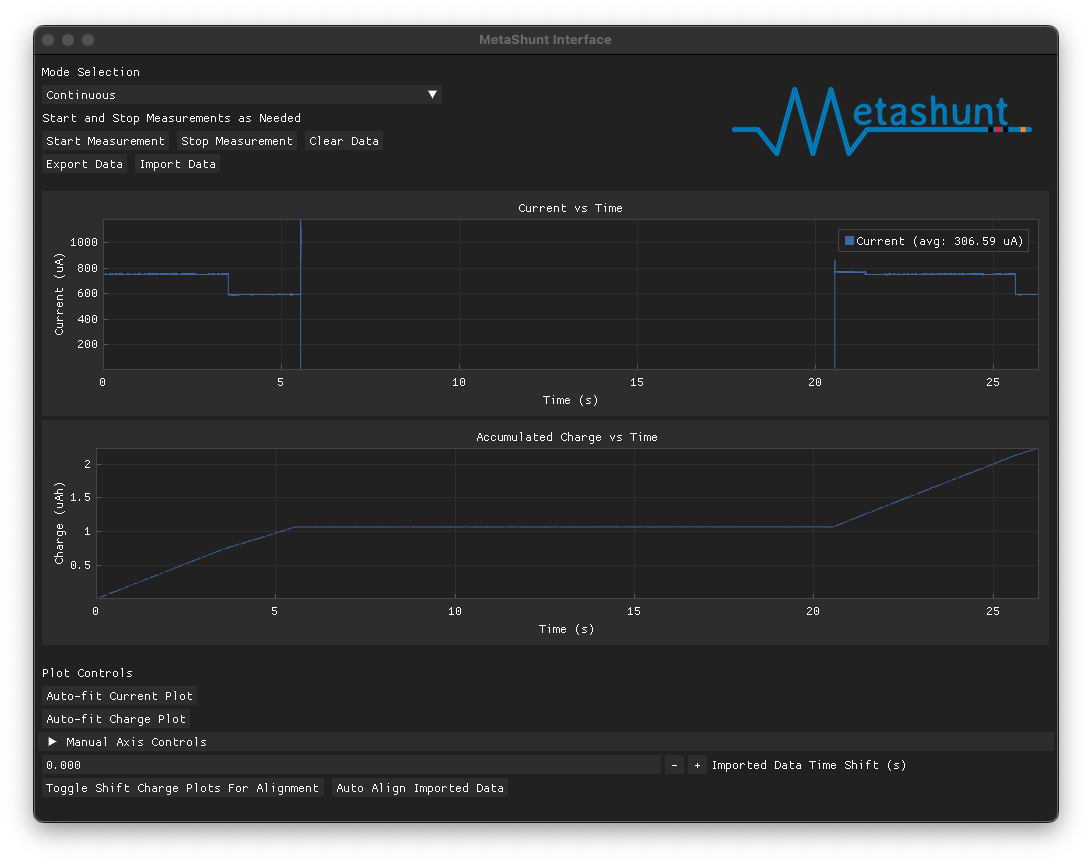
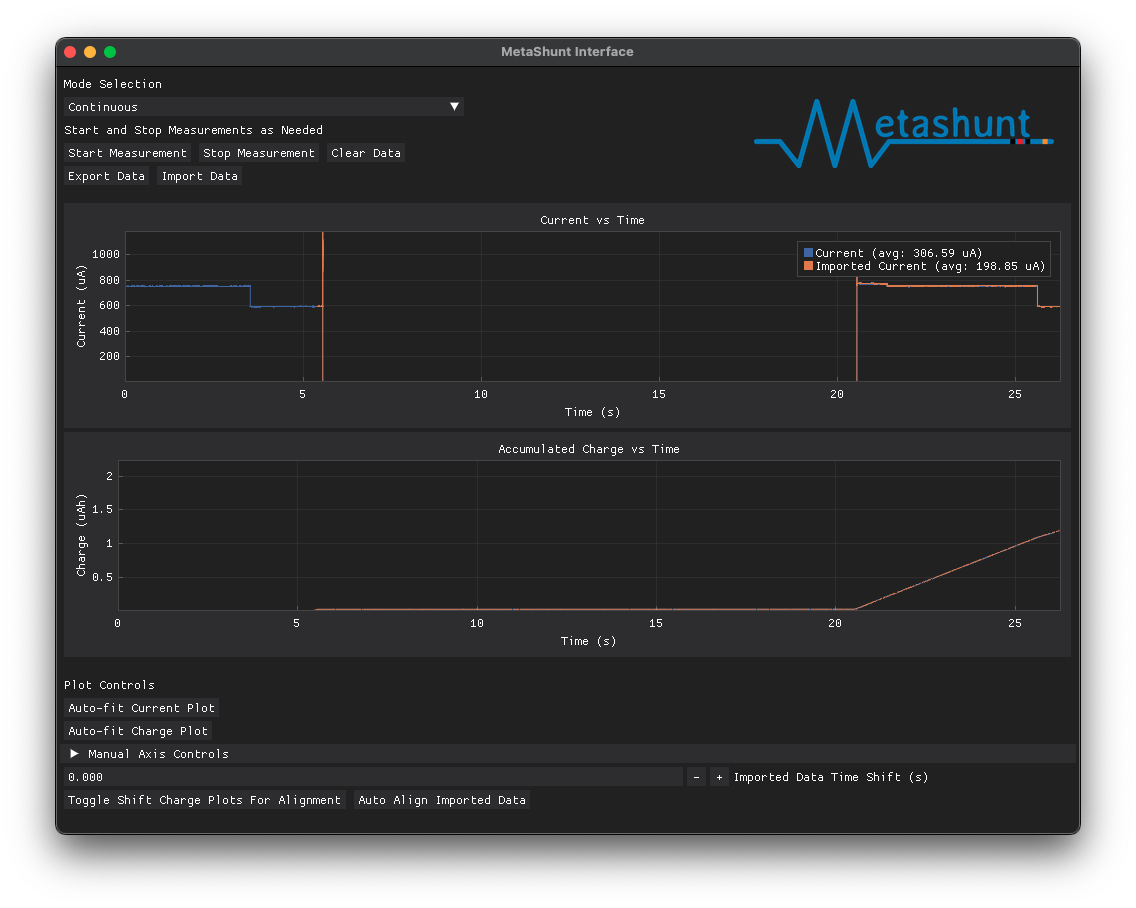
Users can now request continuous or burst measurements. While continuously recording, the plots auto-update, showing what is currently happening with the system. Burst measurements stop updating after the set of 37,500 datapoints in the burst have been received. Data can be exported and imported as desired, allowing measurements to be easily compared!

The imported data can then be shifted in time manually using the buttons near the bottom of the screen. Or, if the signal has recognizable features, the "Auto Align Imported Data" button can automatically align the data based on the current measurements. In addition, the charge over time plots can be aligned with the "Toggle Shift Charge Plots For Alignment" button. This button is key to compare wakeup events between firmware changes to compare energy savings easily.
Check it out for yourself now and please let me know if you run into bugs or have feature ideas! Happy hacking!
Discussions
Become a Hackaday.io Member
Create an account to leave a comment. Already have an account? Log In.