I've always been interested in finding intuitive ways of looking at data, like the excellent projects by Jan and Charles
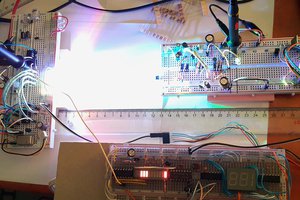
I'm building a tool to map out a section of the electromagnetic spectrum that we cannot see, gamma rays between ~10 keV and ~3 MeV, to visible light such that we can get a more intuitive feel for the gamma radiation.

The core concept of this project is to measure gamma rays and assign a visible color to the energy of each photon that is measured. There is a fundamental problem with this approach because of the different way gamma rays interact with matter. A gamma photon can scatter and deposit only part of its energy into the detector, so we'll not see "pure" colors
This tool clearly shows the difference between a gamma source with a low energy spectrum, like Am-241, and one with higher energies, like Th-232. If these two sources give the same counts per minute reading in a Geiger counter, the higher energy source is significantly more dangerous.
Hardware-wise it uses the Pomelo gamma spectroscopy module, an Arduino compatible board, and an addressable LED strip for displaying the output.

Pomelo measures photon energies and hands them over to the Arduino which assigns a color for each measurement.
The gamma detector is much more efficient for low energies than for higher ones, so to compensate somewhat for that colors decay faster towards red and slower towards violet. Here are two demos of the entire system in action with two radioactive sources having different color fingerprints:
 mihai.cuciuc


 MDreamer
 Jovan
Jovan
 Ahmed Elsaggan
 Arkadi
great project! Now you have to make it directional! Notice that a PIN diode detector is much thinner than it is wide…