 Luicer's Lab
Introduction.
An ultrasonic echosounder is a device capable of detecting objects based on echoes produced by an ultrasonic pressure wave generator.
There are many commercial echosounders available on the market, used for applications like analyzing the ocean floor, fishfinders, and localization systems for ROVs. Here, we present a first version of an echosounder system as a proof of concept, which can serve as a foundation for developing a specific product in the future.
The system consists of the following parts:
- The piezoelectric transducer, which is the component that converts an electrical signal into a pressure wave and vice versa.
- The ultrasonic signal generator, which produces the signal needed by the transducer to generate the appropriate pressure waves.
- The signal receiver, which detects signals produced by the echoes.
- Interpretation software, which allows us to interpret the received signals

Design of the Piezoelectric Transducer for the Sonar.
The transducer is the main component of the echosounder system. In our case, a piezoelectric crystal is used, which both generates ultrasonic pressure waves and converts the echoes into an electrical signal.
The transducer being designed consists of a 3D-printed housing made of PETG filament, coated with epoxy resin. Inside are the elements that make up the transducer:
- The Piezoelectric Crystal: In this design, the material chosen is PZT5, in a disc format with a thickness of 4mm and a diameter of 20mm.
- The Matching Layer: This is the layer between the piezoelectric crystal and the water. It must have an acoustic impedance that is intermediate between the material of the piezoelectric crystal and the water; PETG has this characteristic. The thickness of this layer has been defined as 1/4 of the pressure wavelength.
- The Backing Layer: This layer surrounds the crystal and must have a high degree of acoustic wave absorption to prevent ringing. In our case, cork has been selected.
The low-cost piezoelectric disc chosen has a thickness of 4mm, which gives it a resonance frequency in axial mode of 500 kHz. The specific disc used is as follows:

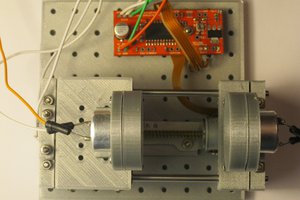
The design was created using FreeCAD, and in this first version, it was chosen to make it detachable with a threaded connection that allows the two parts to be separated for internal analysis. An O-ring seal was used to ensure watertightness. The design is as follows:

To improve watertightness and strength of the element, it has been post-processed by coating it with epoxy resin. The final result is as follows:

In the final design, the interior will be completely encapsulated with epoxy resin to ensure complete watertightness.
Controller Design.
The designed controller has the following block diagram:

The controller is based on a “black pill” board with the STM32F401 microcontroller and consists of three parts:
- The Ultrasonic Generator: It uses the microcontroller’s PWM module to generate pulses of 500 kHz. This signal, through power MOSFETs and a transformer to boost the signal, is injected into the piezoelectric transducer to generate the pressure wave. To achieve maximum precision, a 5-pulse train at a frequency of 500 kHz has been implemented as the generating signal.
- The Ultrasonic Power Meter: A peak detector and an amplifier based on OPAMPS are used to transfer the signal received by the transducer to the microcontroller’s ADC.
- The Communication Interface: The commercial HC-06 module is used to send the information received via Bluetooth, allowing it to be transmitted to a computer or a smartphone.
A PCB has been designed with KICAD, and the final result looks as follows:

The firmware has been developed using the Arduino framework but utilizing the HAL libraries from ST-Microelectronics to leverage DMA and advanced timer functions for PWM and ADC.
For the initial tests, the transducer was used in a closed container, maintaining a distance of 10 cm from the bottom in order to...
Read more »


 Andrew Ferguson
 Jianjia Ma
 Brett Walker
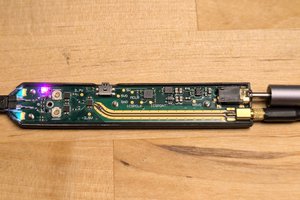
 ISAI B