 lucy moglia
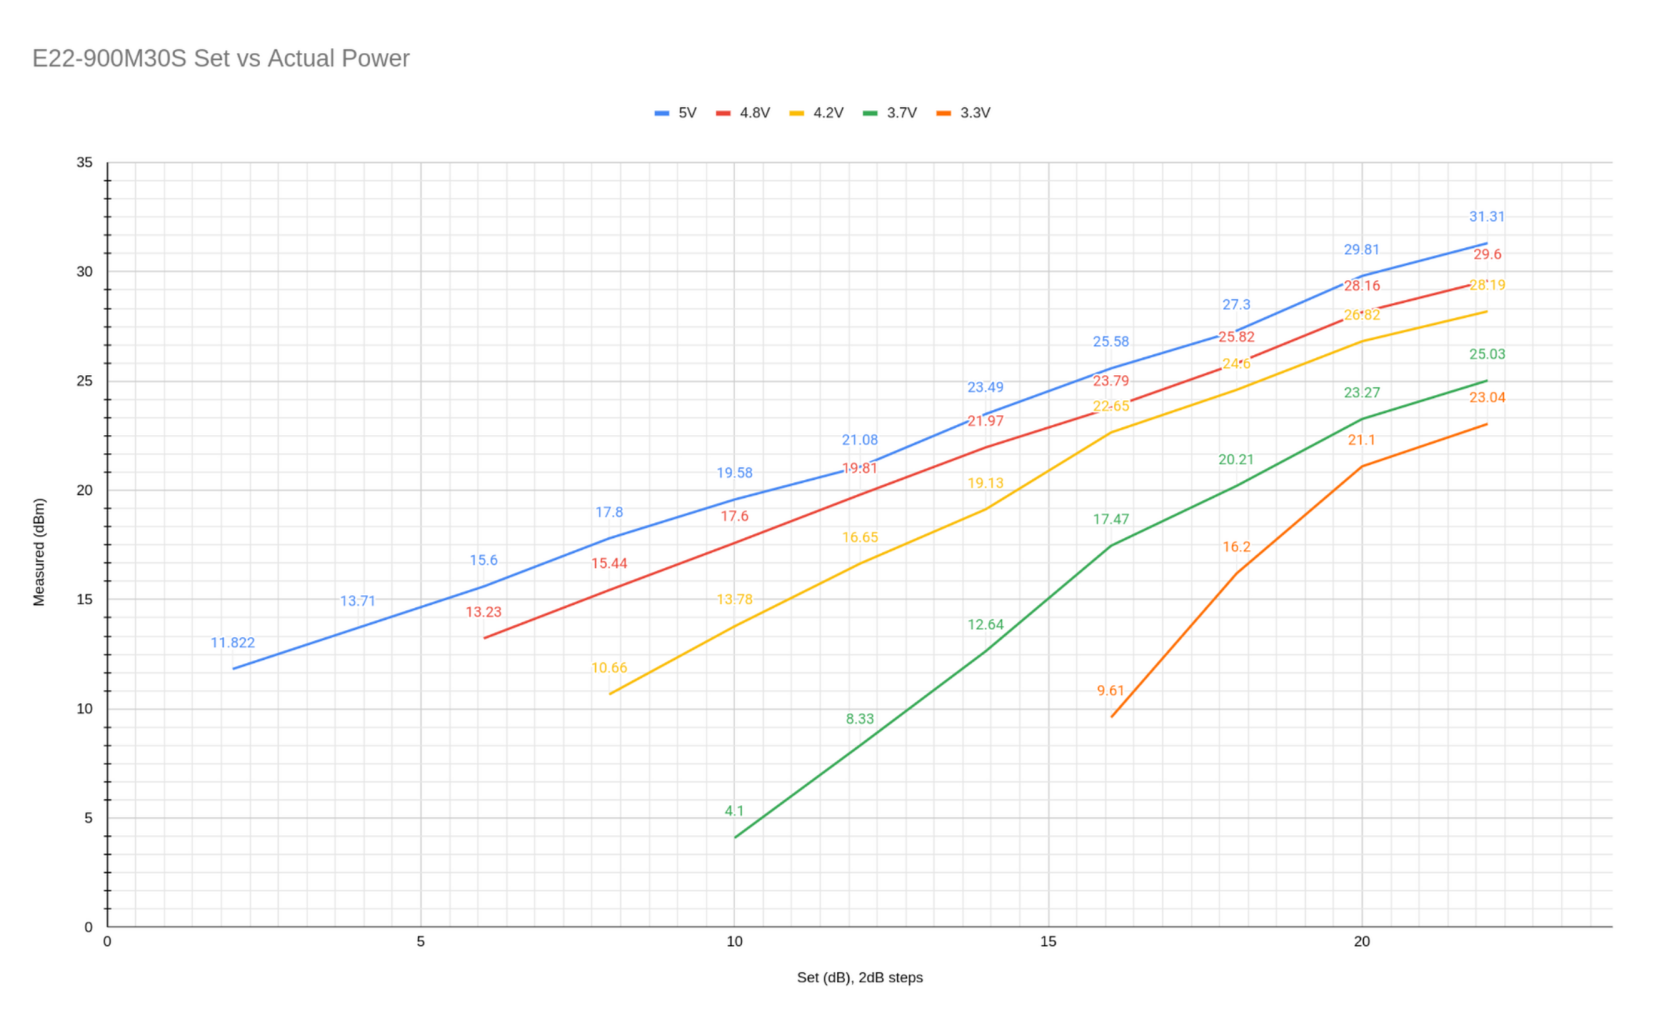
The actual power output is highly dependent on the input voltage to the module, and diverges significantly from the levels listed in the module's datasheet. To help EU users comply with the 27dBm/500mW TX power limit, I tested the set vs actual TX power of the module given a variety of input voltages.
Results:
You can find a PDF with the full table of measurements in the project files.
This chart shows the change in actual TX power VS set power at a range of input voltages:
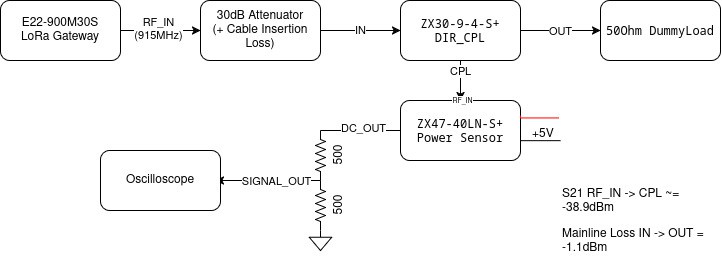
You can see all the equipment I used in the components section of this project.
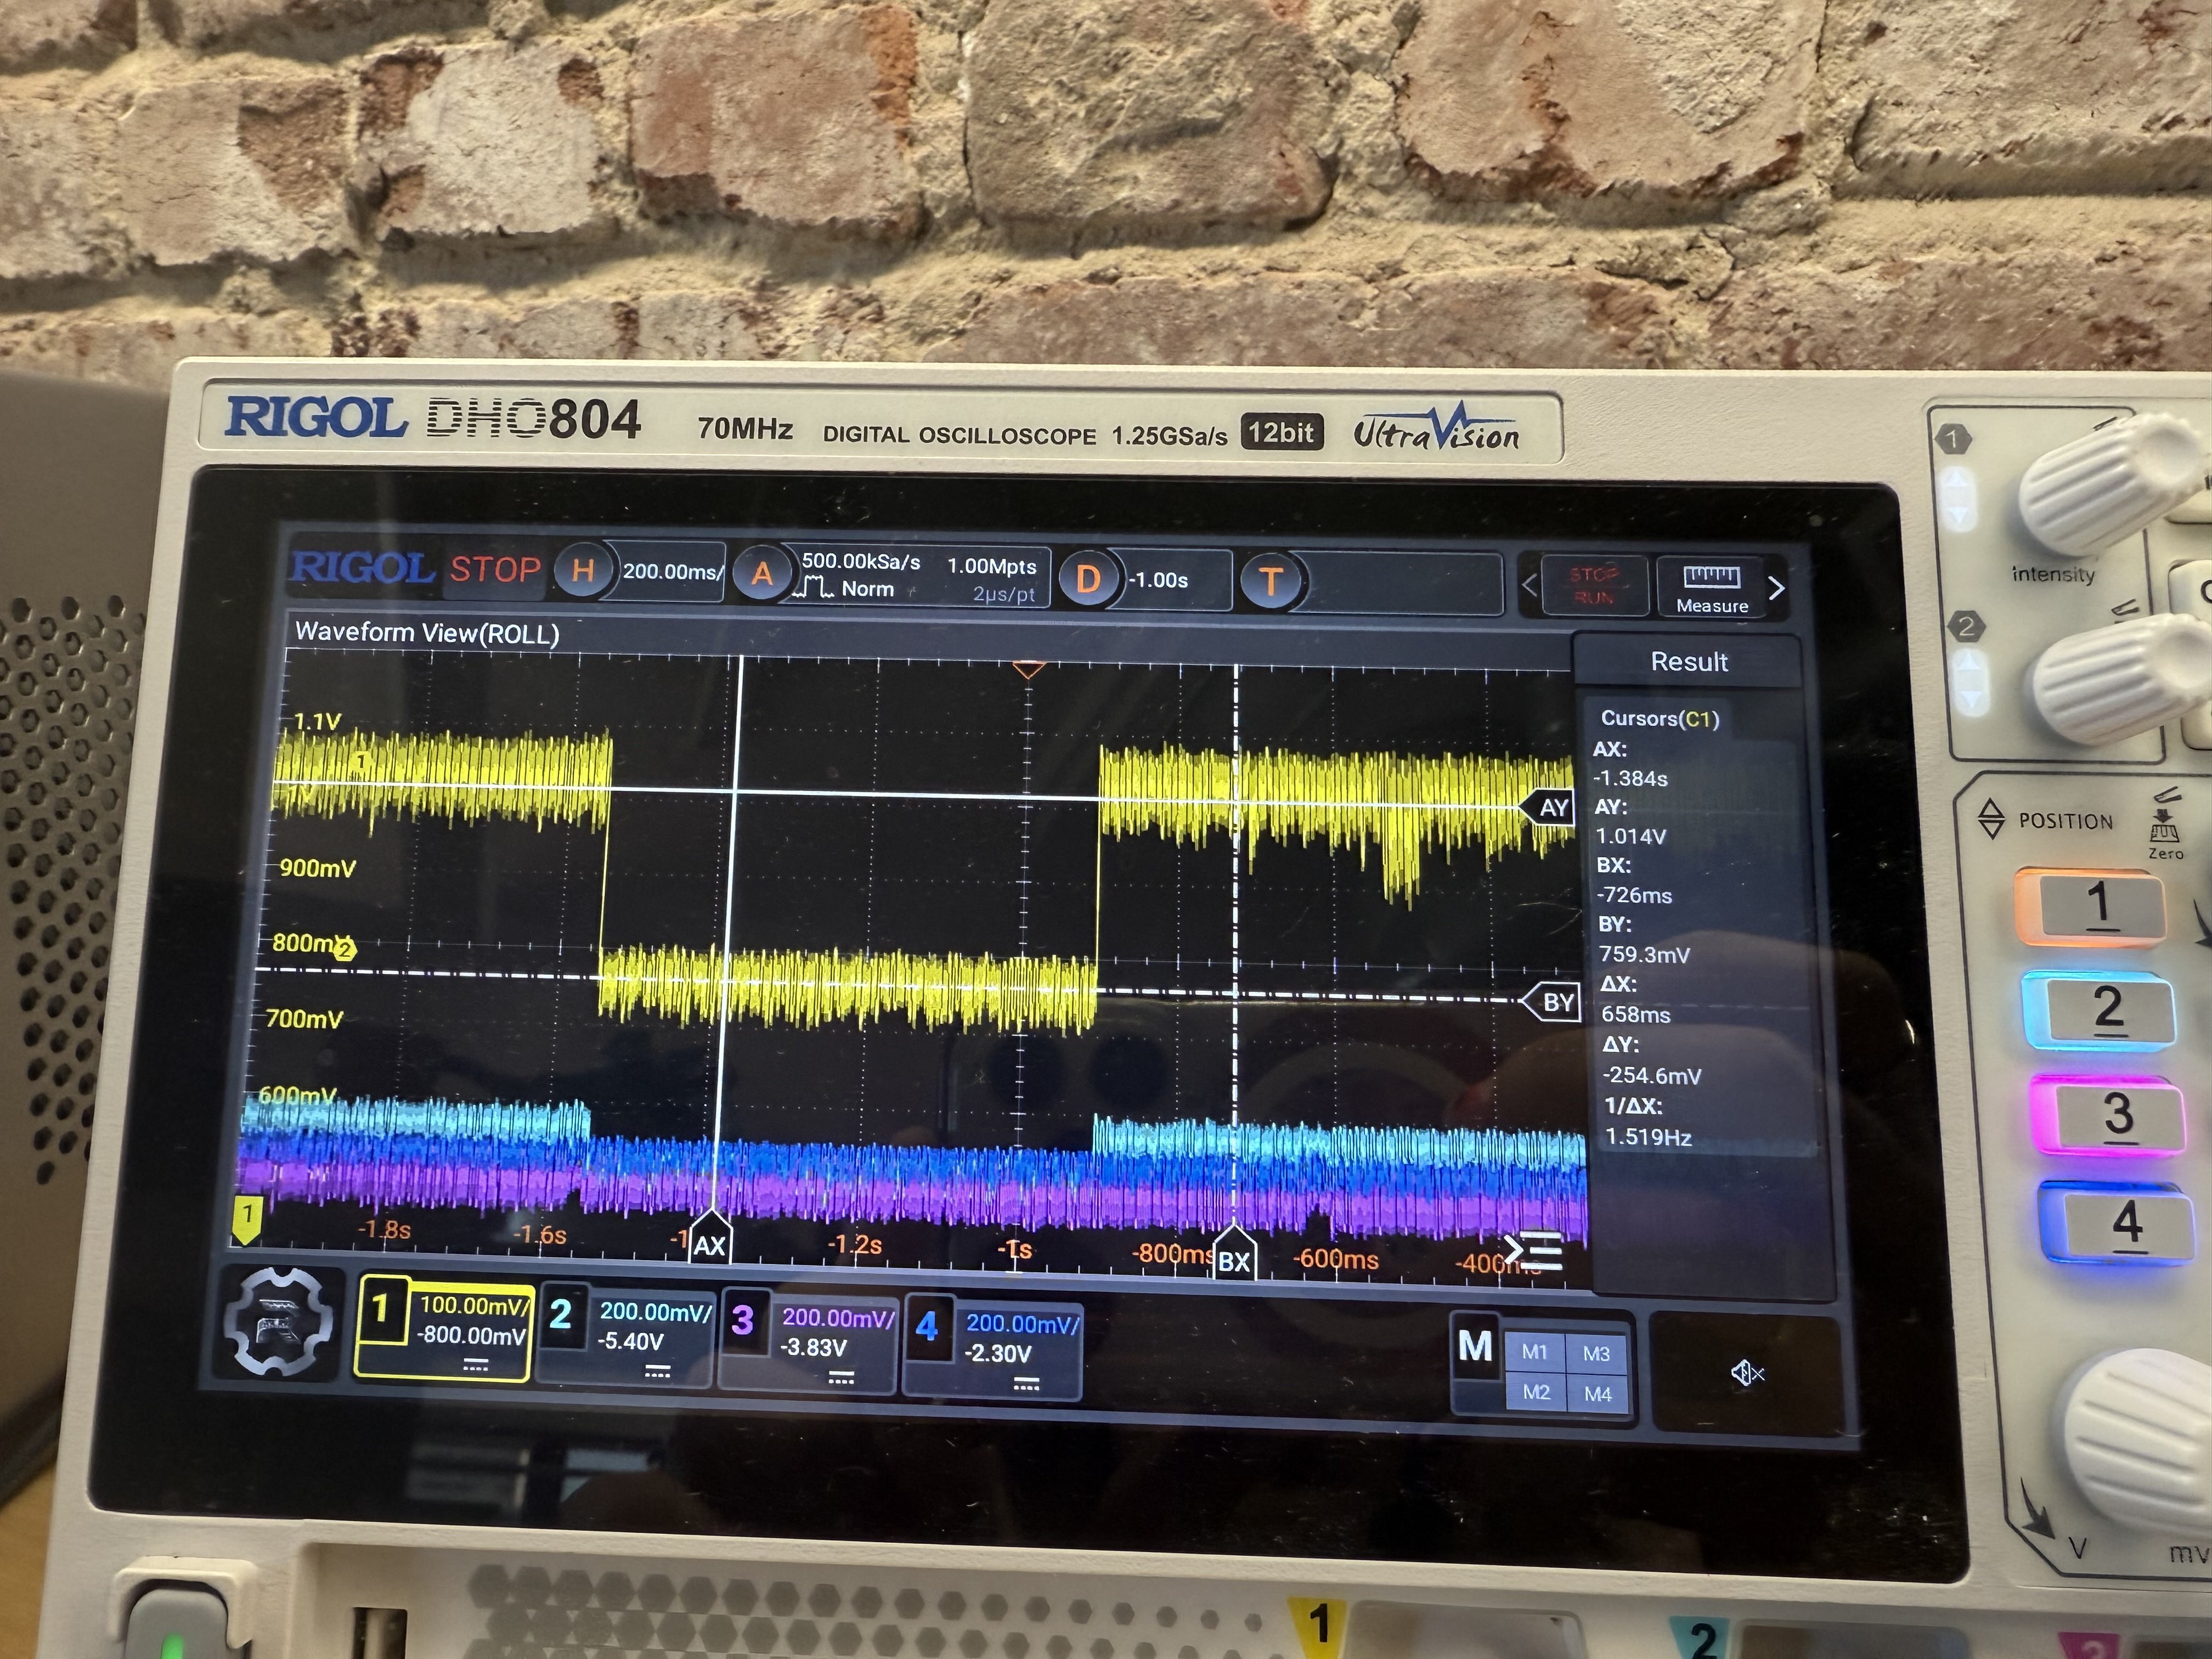
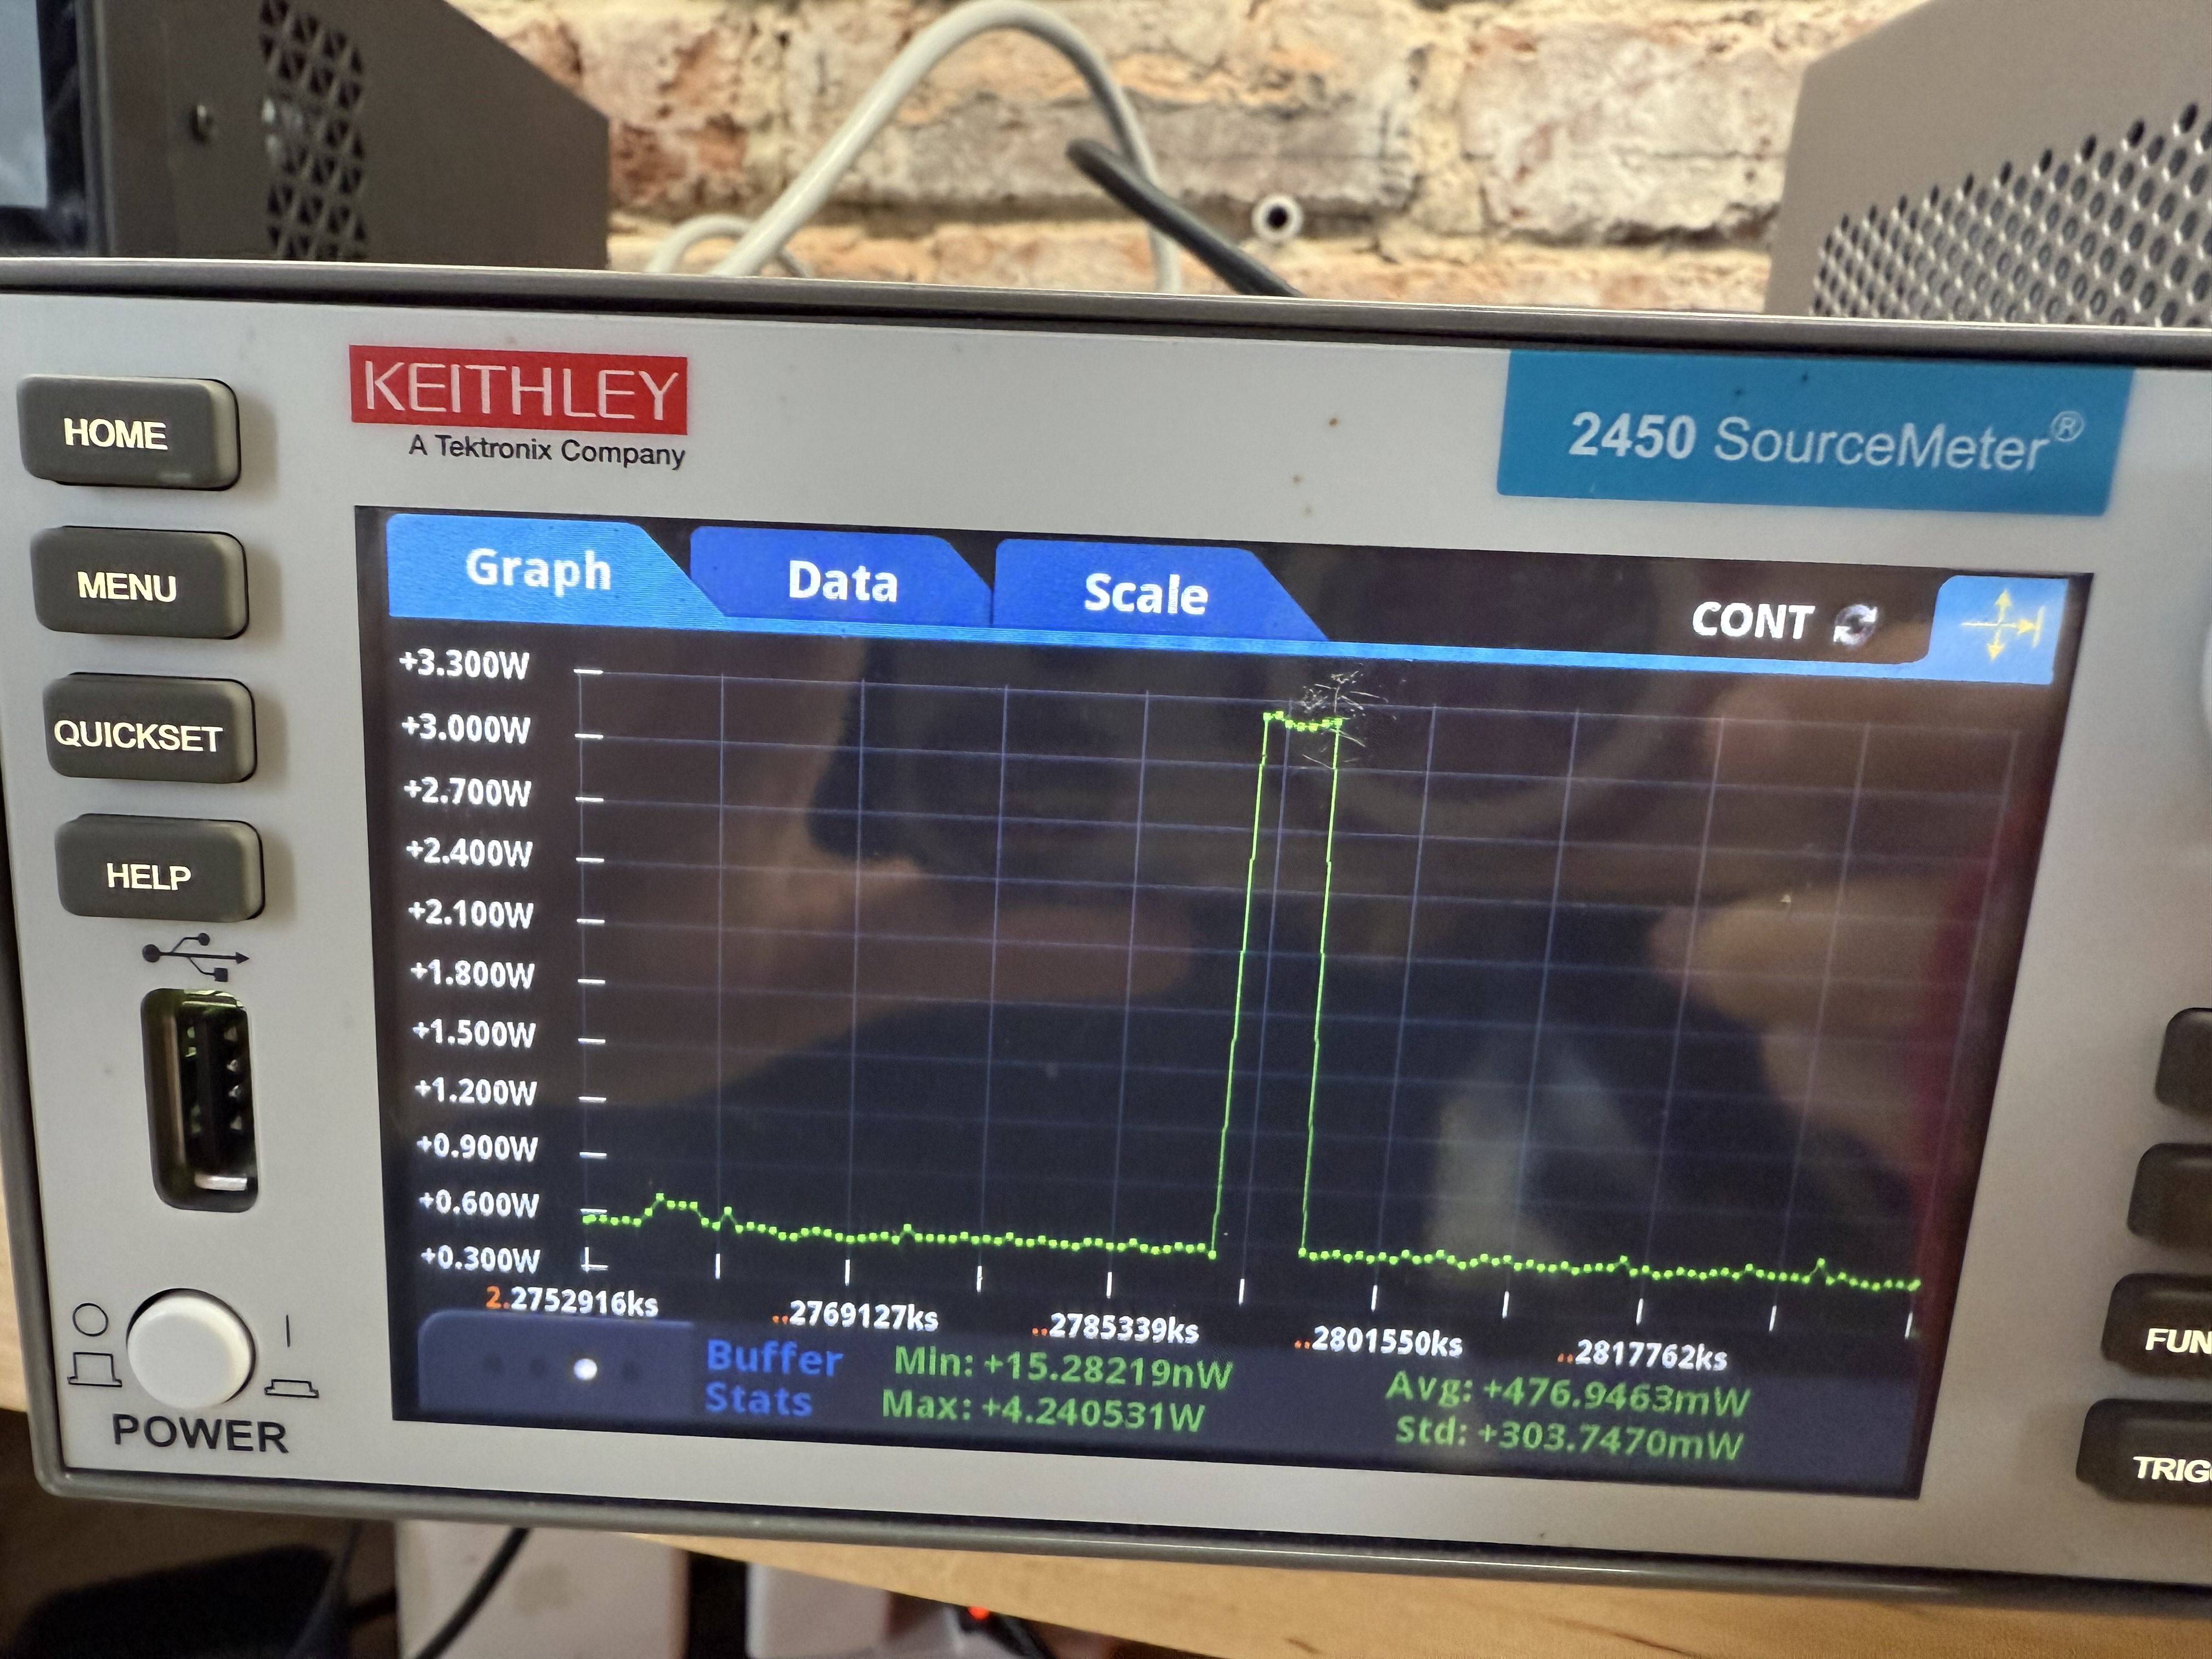
I also took note of the average power consumption at 5V and 3V3 via the SMU, as well as snapshots of the power usage during LoRa packet transmission. You can see the raw CSV of that in the results folder of my test scripting discord. The LoRa transmissions look like this:
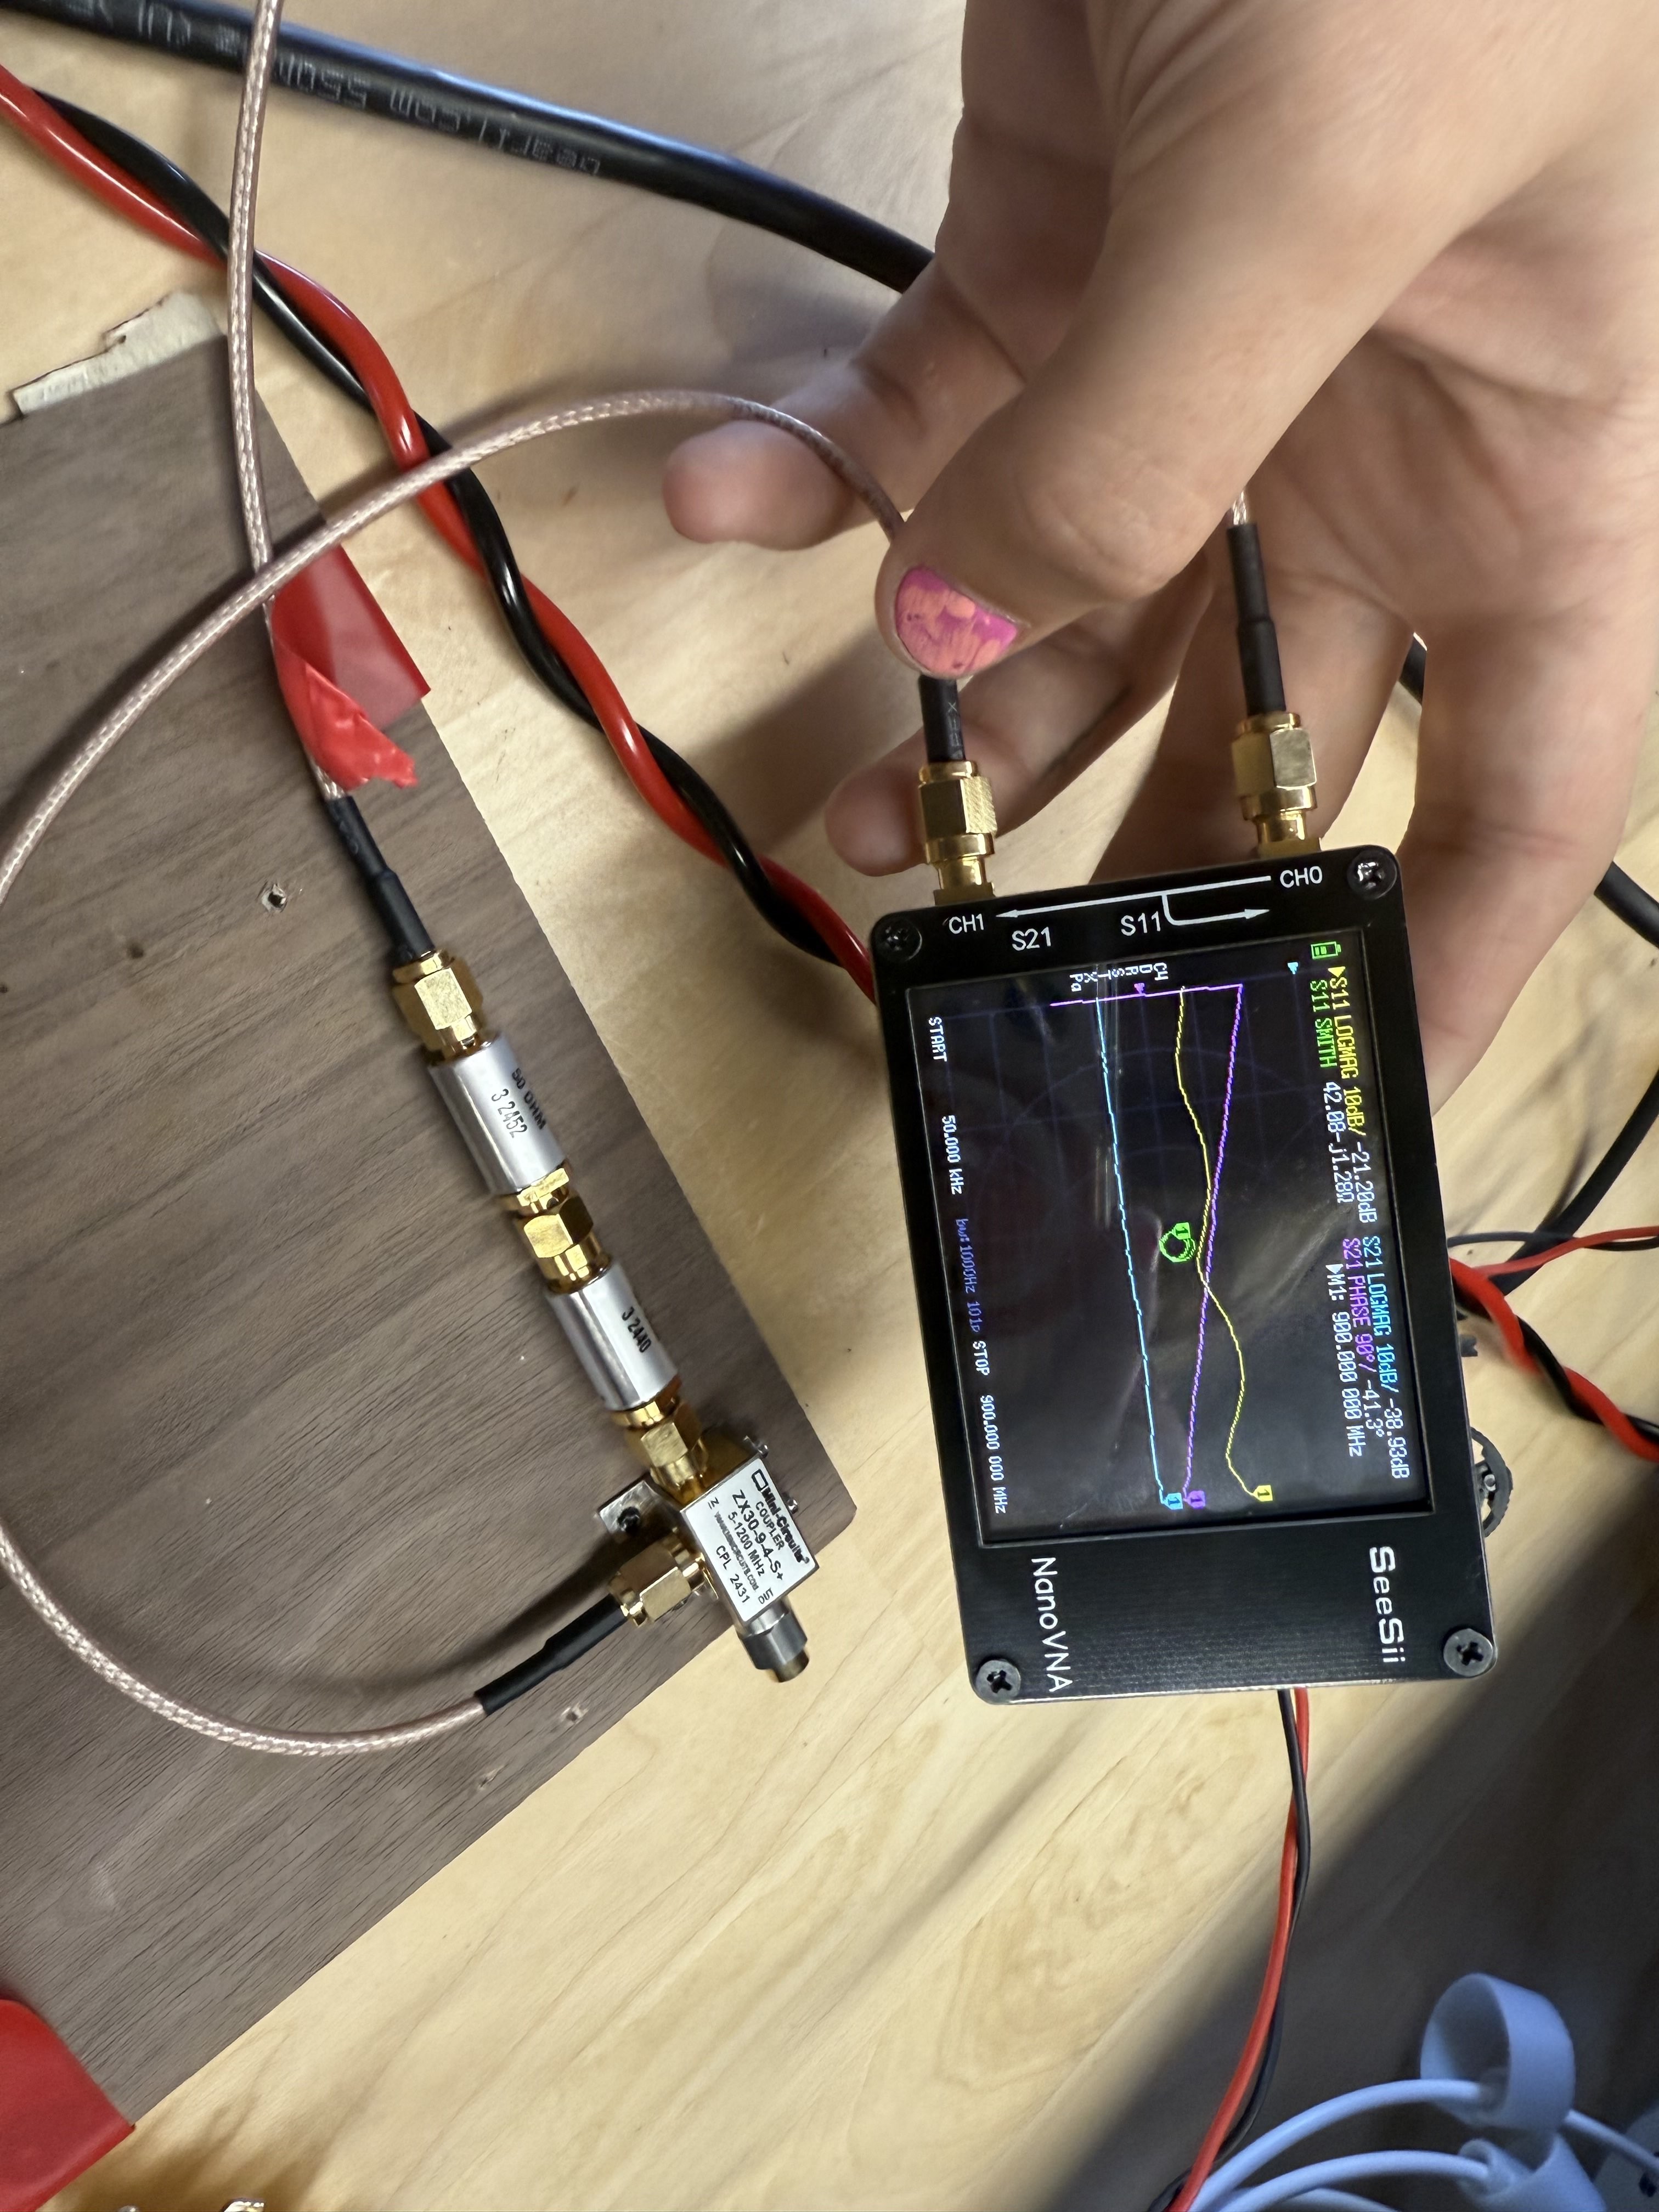
Apologies for the phone camera pictures. I originally planned to automate the sweep through the input power and TX setting combinations as well as automatically capture and save waveforms on the SMU and OScope with Pyvisa, but I ended up having a very difficult time getting the femtofox to execute python commands quickly/predictably enough to make this work well. This is something I should revisit with the module and a differently platform with more consistently timed execution (likely an RP2040). All this is to say, I performed this first series of test very manually
 Sudarshan patil
 csdesign
 MAAL's LAB
 MS-BOSS