Test :
We tried the code and put the data on excel in order to see our hearth rate with graphics.
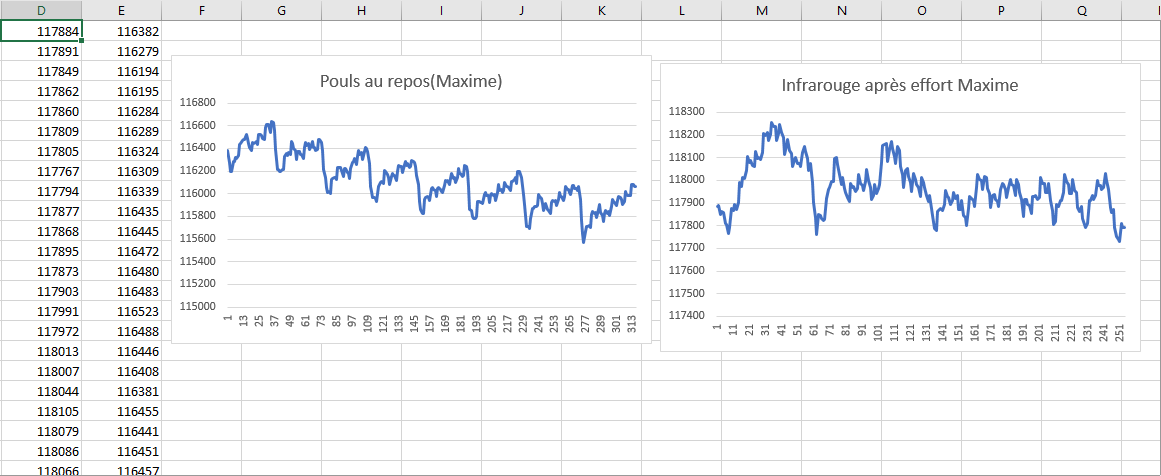
Here are the results of 2 tests on sportive man hearth rate before and after an effort.
We have InfraRed value in y-axis and the number of value sampled in x-axis.
Observation : we can see the variation of blood volume stable before the effort, whereas after the effort, variations are quite instable.
Discussions
Become a Hackaday.io Member
Create an account to leave a comment. Already have an account? Log In.