Ergun PAYAL
-
FFT analysis
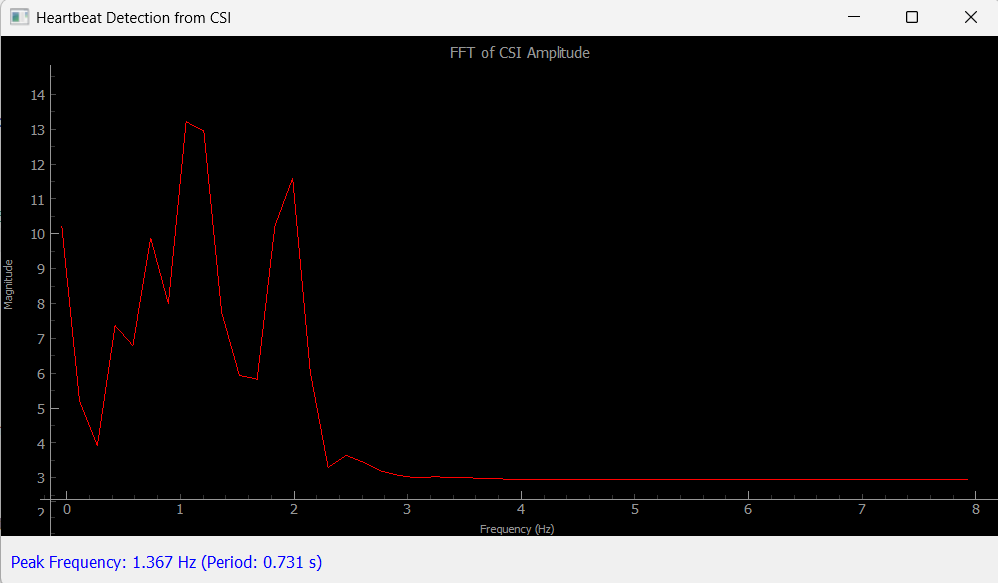
07/11/2025 at 13:06 • 0 commentsFigure 1 shows the FFT graph when there is no periodic motion in the environment. Peaks can be seen around 0, 1, and 2 Hz, with a magnitude of approximately ~12.
![]()
Figure 2 shows the FFT graph generated by rhythmically moving my hand between two ESP32 devices. The magnitude level reaches approximately ~500.
![]()
In the video, you can see a live analysis. The rhythmic movement doesn't have to occur directly between the ESP32 devices, but background activity can make it harder to detect.
Hopefully Hertz
This project detects periodic motion by analyzing how Wi-Fi signals are disturbed by the environment—hoping to extract 1-second timing.