 John Anderson
With race series such as 24 hrs of Lemons, Champcar, and World Racing League, there are lots of opportunities to participate in the sport of endurance car racing at an "entry level" cost. However, this so called crap-can racing can be quite the resource management problem with lots of data to be parsed in real time for the driver and the team.
I built and raced an in-expensive endurance race car 15 years ago. I loved being in the car and dicing with other drivers. But, I also enjoyed the challenge of running a race team all weekend. This included the task of monitoring the race car in real time so we could anticipate problems and address them before they ended our race weekend.
In endurance racing, the task of monitoring the race car is complicated by the fact that the driver has other important things to do. Also, there is more than one driver in a race weekend. So, the perception of the data presented can change. I learned this at about 9 pm one long race weekend. I had just stepped out of the car, put a new driver in, and sent him out. Per our process at the time, someone in the paddock had a stop watch and a radio with direct communication with the driver. Our process was for the "crew chief" to clock lap times and report them to the driver. The driver would respond with the values they read from the gauges (oil pressure, oil temp, water temp, fuel pressure, and voltage). In our first car, we had cheap analog gauges. So, when the driver reported the water temp on his first lap, we got a reading of 225-230 degrees. This was a little concerning because I had been reporting 210 degrees for the previous 90 minutes. We instructed the driver to continue but watch the water temp. This continued for several more laps and we decided to bring the car in to check if there was debris stuck in the radiator. Upon inspecting the cat, there was nothing out of the usual. So, I poked my head in the car to check the temp gauge and to my surprise it was reporting exactly the same temp I had seen for the previous stint. It turned out that the new driver was shorter and often reading the value while in the first turn. From his angle the gauge read 225 degrees.
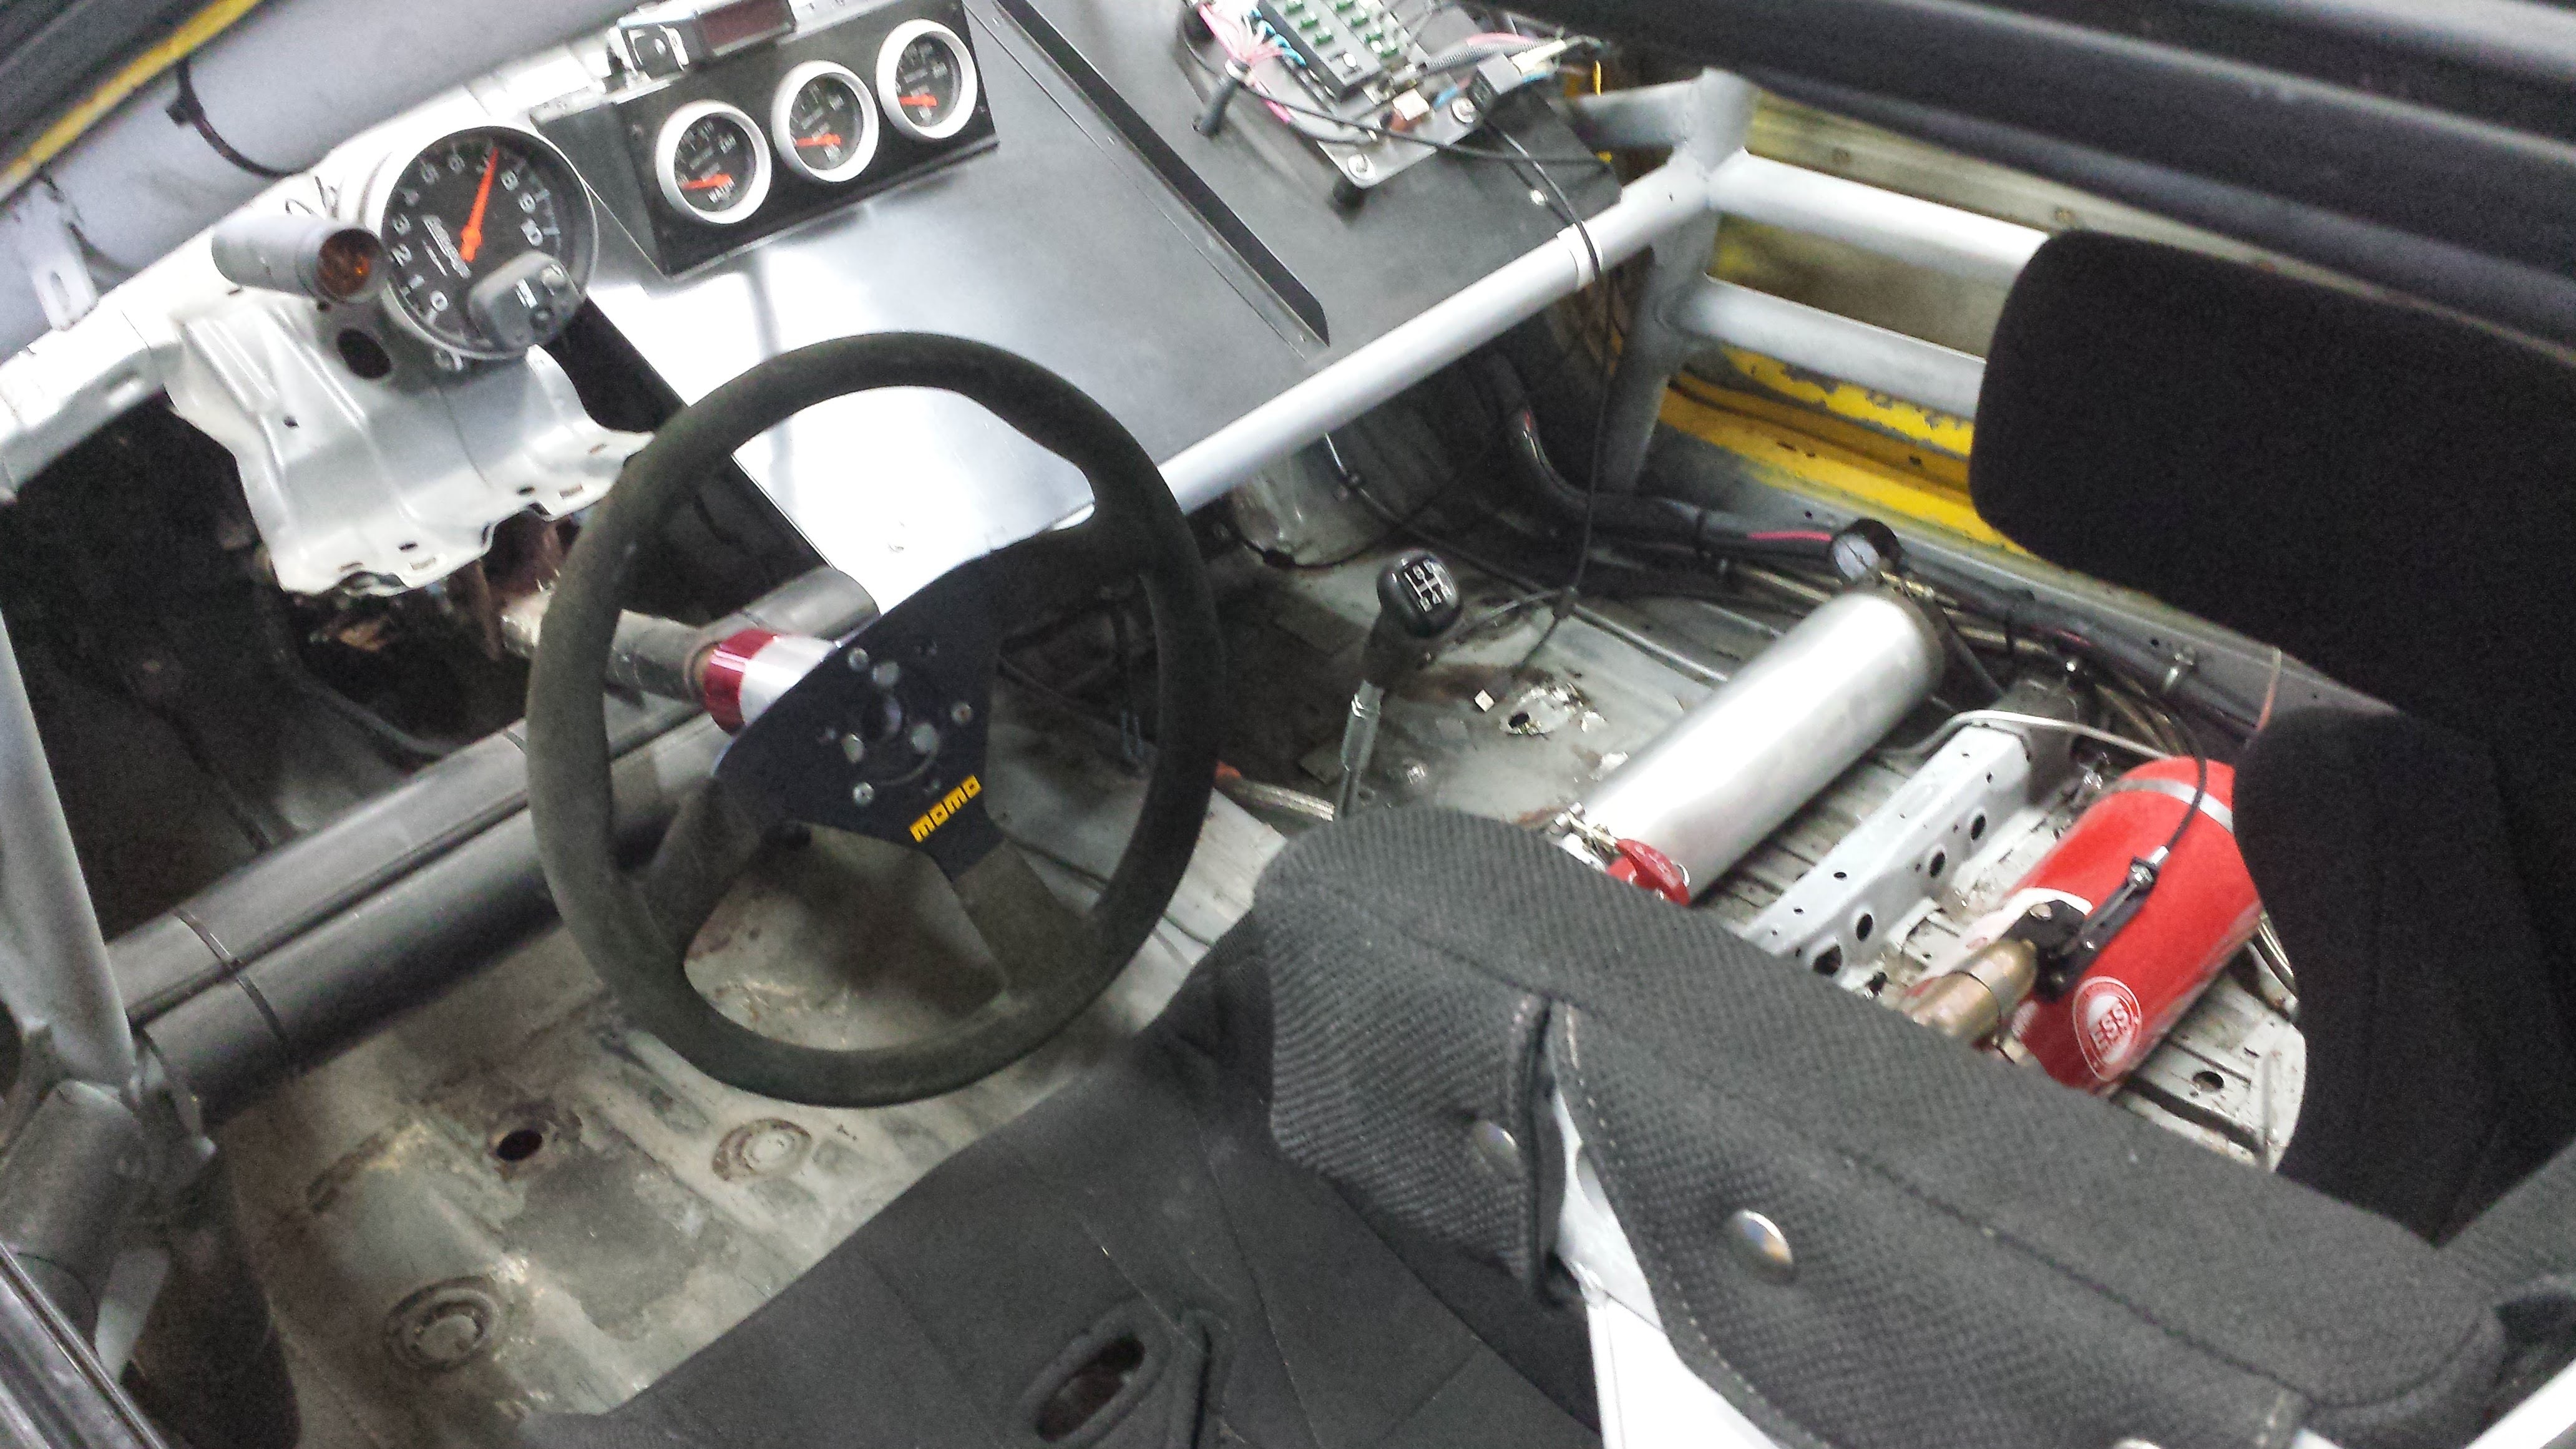
This is a picture of a later race car I built, Note, the gauges are rotated and appear to be askew. This was intentional. It's an old trick to simplify reading the gauges. If everything is operating in a reasonable range, all the needles should be pointing straight up. In fact, my drivers got in the habit of reporting "needles up". This meant that everything was operating in expected ranges. It wasn't terribly precise, but it worked. Keep in mind that in the time I owned and raced that car, I had at least dozen different people drive that car. Most of them had no idea what the appropriate range was for all the parameters. And, they didn't have extra brain cells to commit to the problem while they were dicing with other cars on the track.
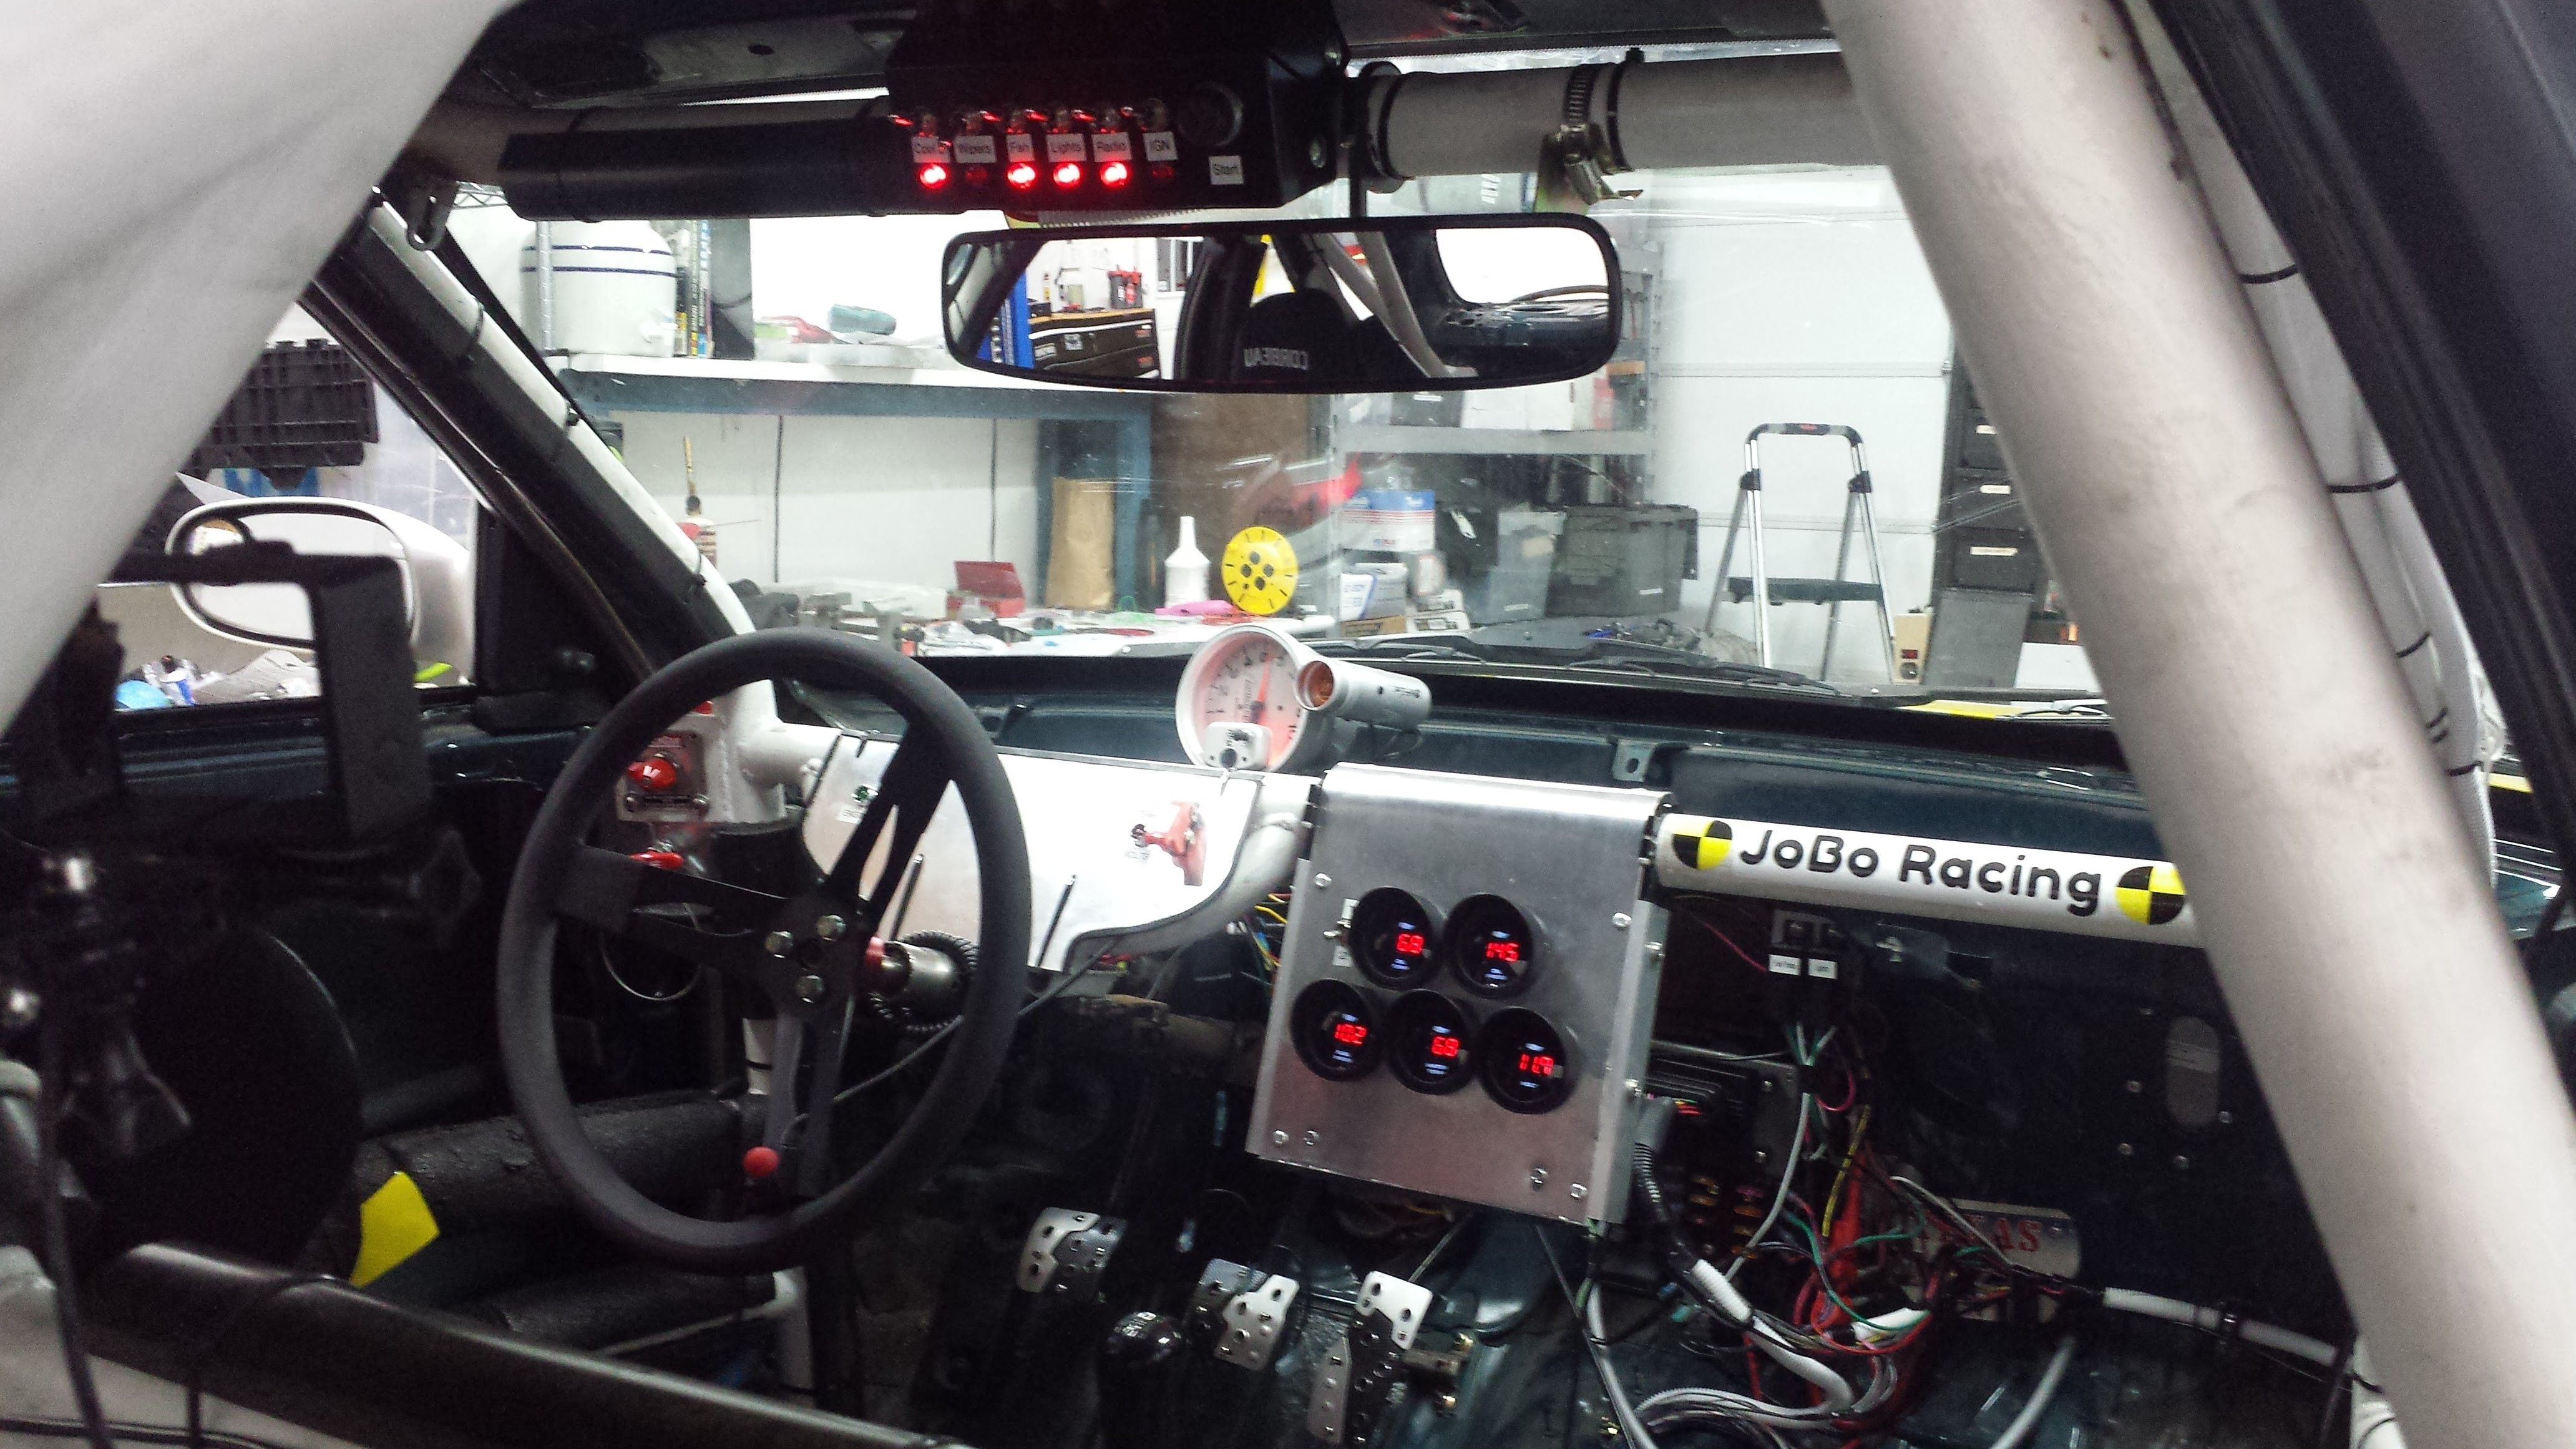
I eventually installed digital gauges to minimize the perception problem. But, they seemed to confuse my drivers even more in the long run. So we just simplified and asked the drivers to read off the oil pressure and temperature only. This worked for the most part. But, it would have been nice to have more data.
That's where this project comes in. It's goal is to simplify the task of monitoring the operating parameters for the driver, significantly increase the resolution of the monitoring, add additional parameters to be monitored, add data logging, nullify the need for a vigilant crew chief manning a stop watch, reduce the chance of human error, and keep me busy evenings and weekends for the next 6-12 months.
Concept
As previously mentioned, I have a background in embedded systems and process control systems. Looking back at how my team managed the problem of driver feedback and system operation parameters, it highlights many problems process control systems deal with. These systems that control large chemical and petrochemical plants...
Read more »
 Wenting Zhang
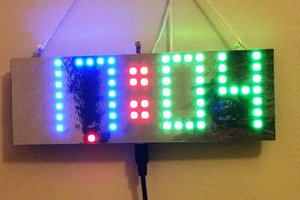
 David Hopkins
 Timo Birnschein
 GOAT INDUSTRIES