 Ettore
LambdaPlotter

Features
- Lightweight and Fast: Built with modern C++ for high performance and low resource usage.
- Cross-Platform: Runs natively on Linux, macOS, and Windows.
- Advanced Serial Configuration: Configure low-level serial port settings, like parity, stop bits, and more.
- Custom Data Formatting: A powerful formatting tool lets you parse virtually any data stream by defining frame endings and value separators.
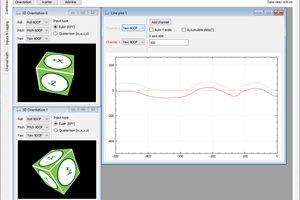
- Channel-Based Plotting: Plot multiple variables simultaneously. Each channel can be customized with its own name, color, scale, and offset.
- Interactive Plots: Powered by ImPlot, plots can be panned, zoomed, and inspected in real-time.
- Data Export: Save the captured plot data to a .csv file for analysis in other tools.
Getting Started
The easiest way to use LambdaPlotter is to download the latest pre-built release for your operating system:
Basic Usage
- Connect your device (e.g., Arduino, ESP32) that is sending serial data.
- Launch LambdaPlotter.
- Configure the Serial Port: Select the correct Serial Port and set the Baud Rate to match your device.
- Define the Data Format: This is the most important step. You must tell LambdaPlotter how your data is structured.
- Frame End: The character(s) that mark the end of a complete data packet (e.g., `\n` for a newline).
- Channel Separator: The character that separates different channels (e.g., `,` or ` `).
- Named Channels: Check this if your data includes names for each value.
- Name Separator: The character(s) that separates names from values (e.g., `:`)
- Click the 'Play' button to begin plotting!
For more detailed explanations and instructions on how to compile from source, go to the Github Page of the project!
 Vedran
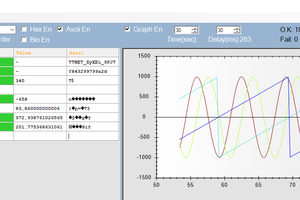
 hasan kara
 Adrelien