 Ken Yap
I wired up a batch of NPN and PNP transistors as shown and measured the B-E junction reverse breakdown voltage.
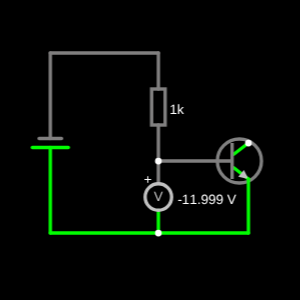

The NPNs broke down at around 9.5 V. It was closely grouped for the batch which were all from the same grab bag of seconds. Similarly the PNPs broke down at about 6.5 V for the group. The voltage is determined by the manufacturing process so it's not surprising that they clustered.
I really should devise a curve tracer to plot the V-I curves. However I have no need for zeners in this range in the foreseeable future, since manual selection is required to get a particular voltage, so I discontinued the experiment at this point. I know this leaves a lot of questions unanswered, such as: how sharp is the knee, how does the "zener" voltage depend on temperature, how stable is the voltage over time, and so forth, but being a practical sort of person, I don't foresee any use for this phenomenon, and would rather spend the time elsewhere. Maybe if I have some idle time or I make a general curve tracer. Enterprising people, feel free to use this zener phenomenon for MacGyverisms. 😉
By the way you should not do this to transistors you hope to use normally later, as I recall reading that this causes irreversible changes to the B-E junction. The transistors I experimented on were low gain, open collector, or otherwise unsuitable for normal use so I didn't care.
 Sander van de Bor
 DeepSOIC
 Dr.Stone