Arnov Sharma

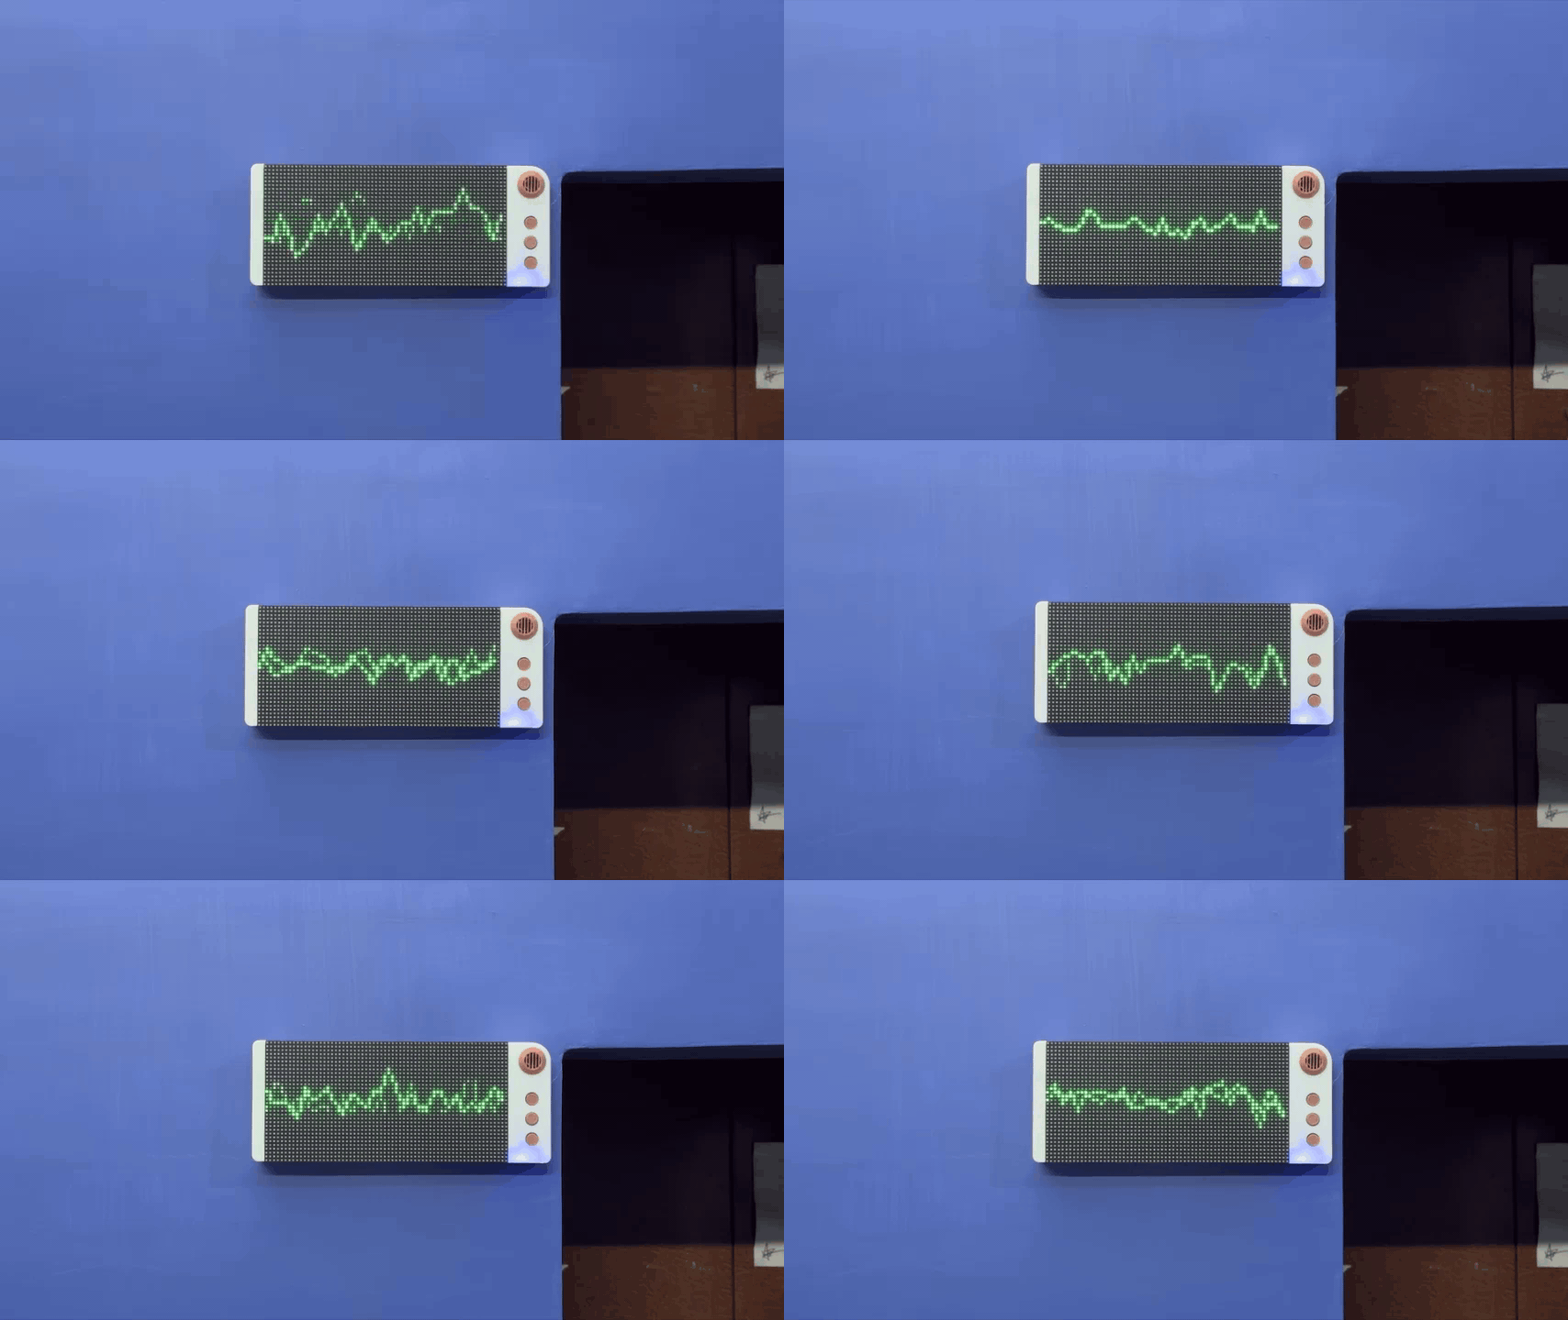
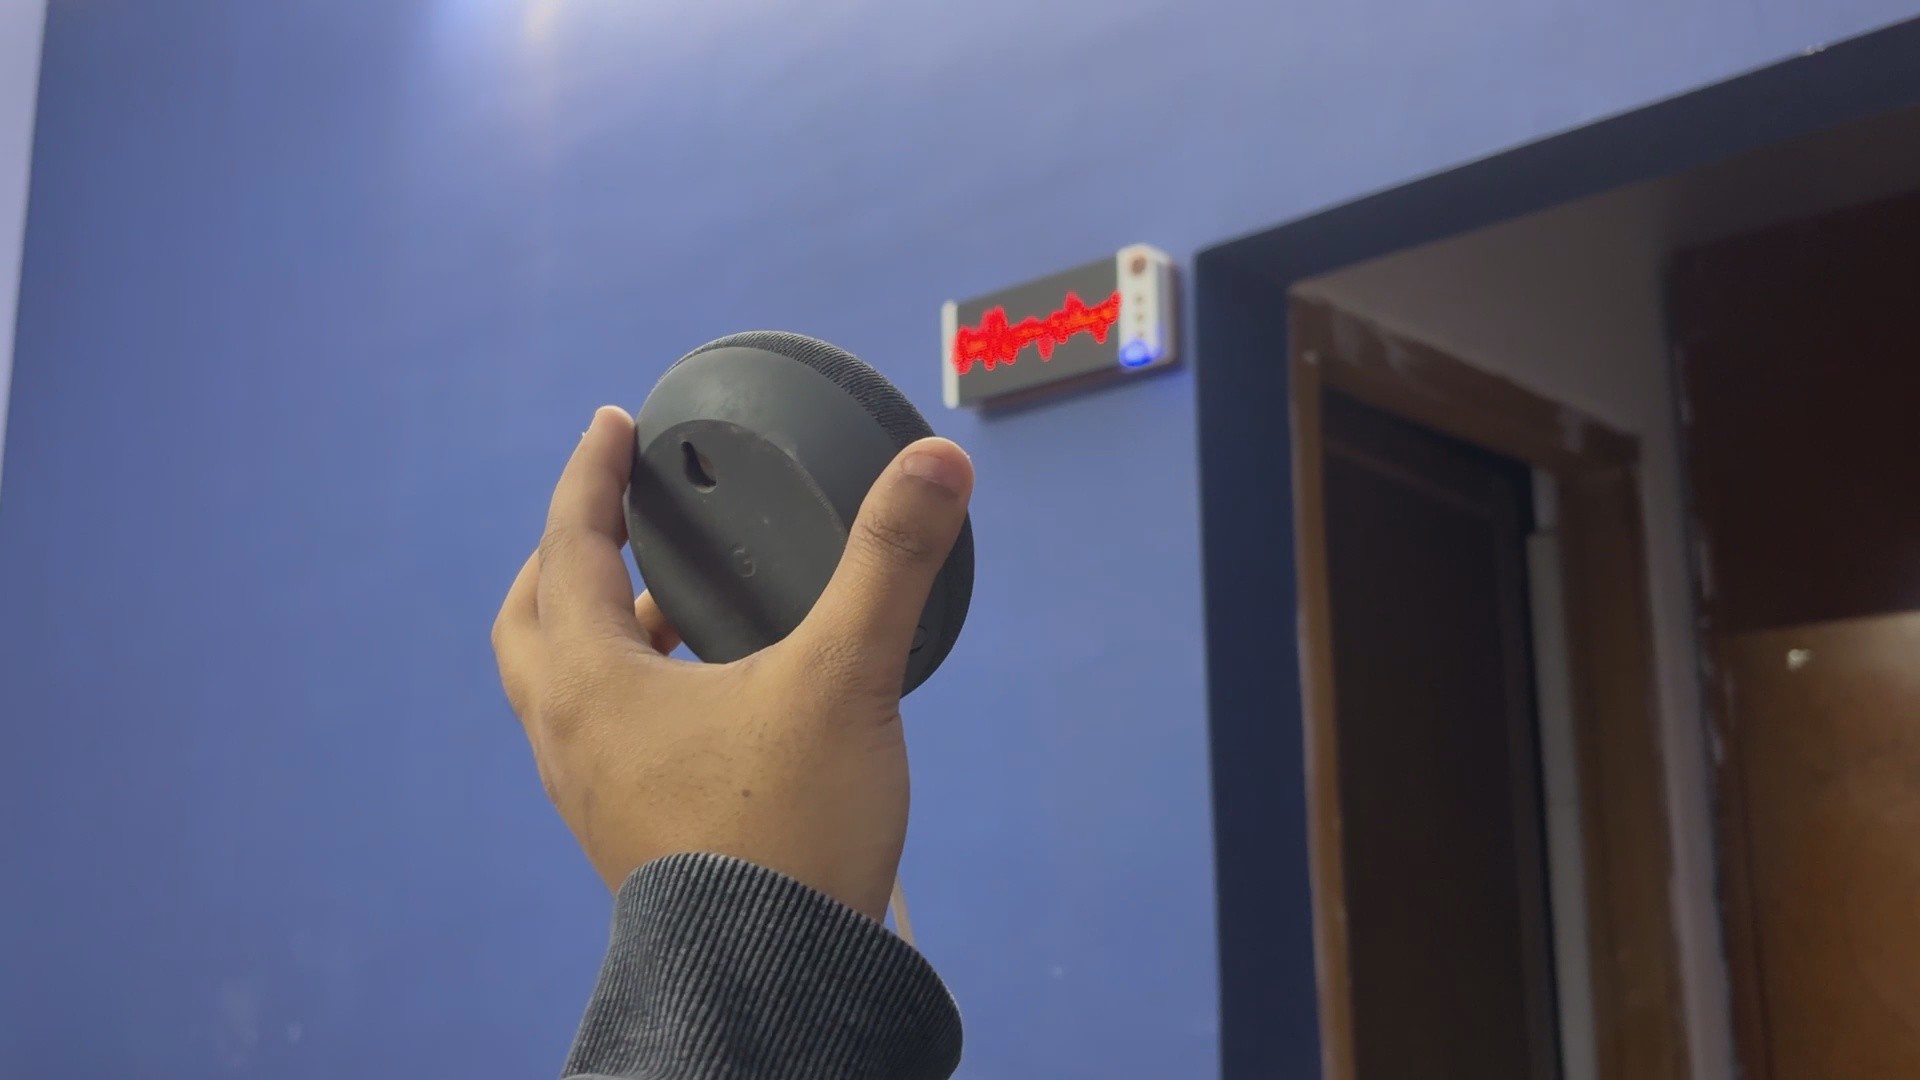
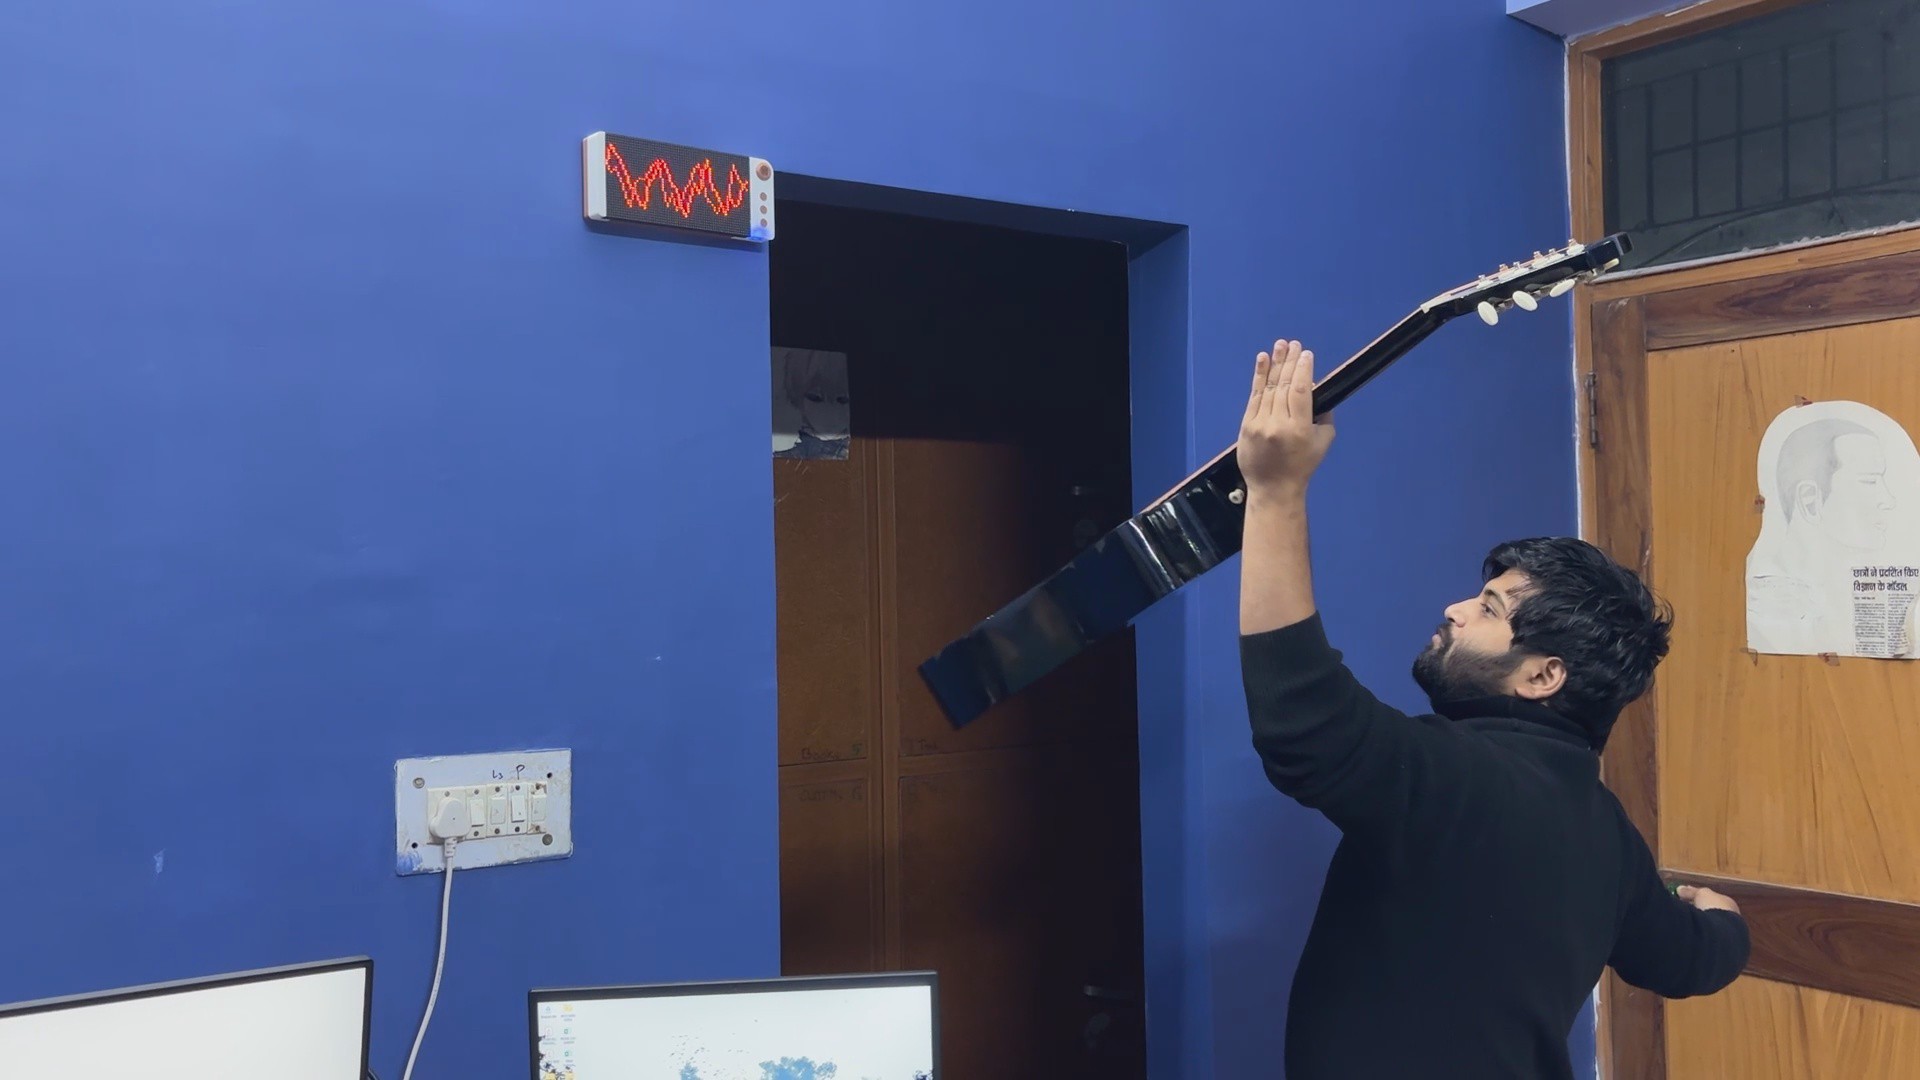
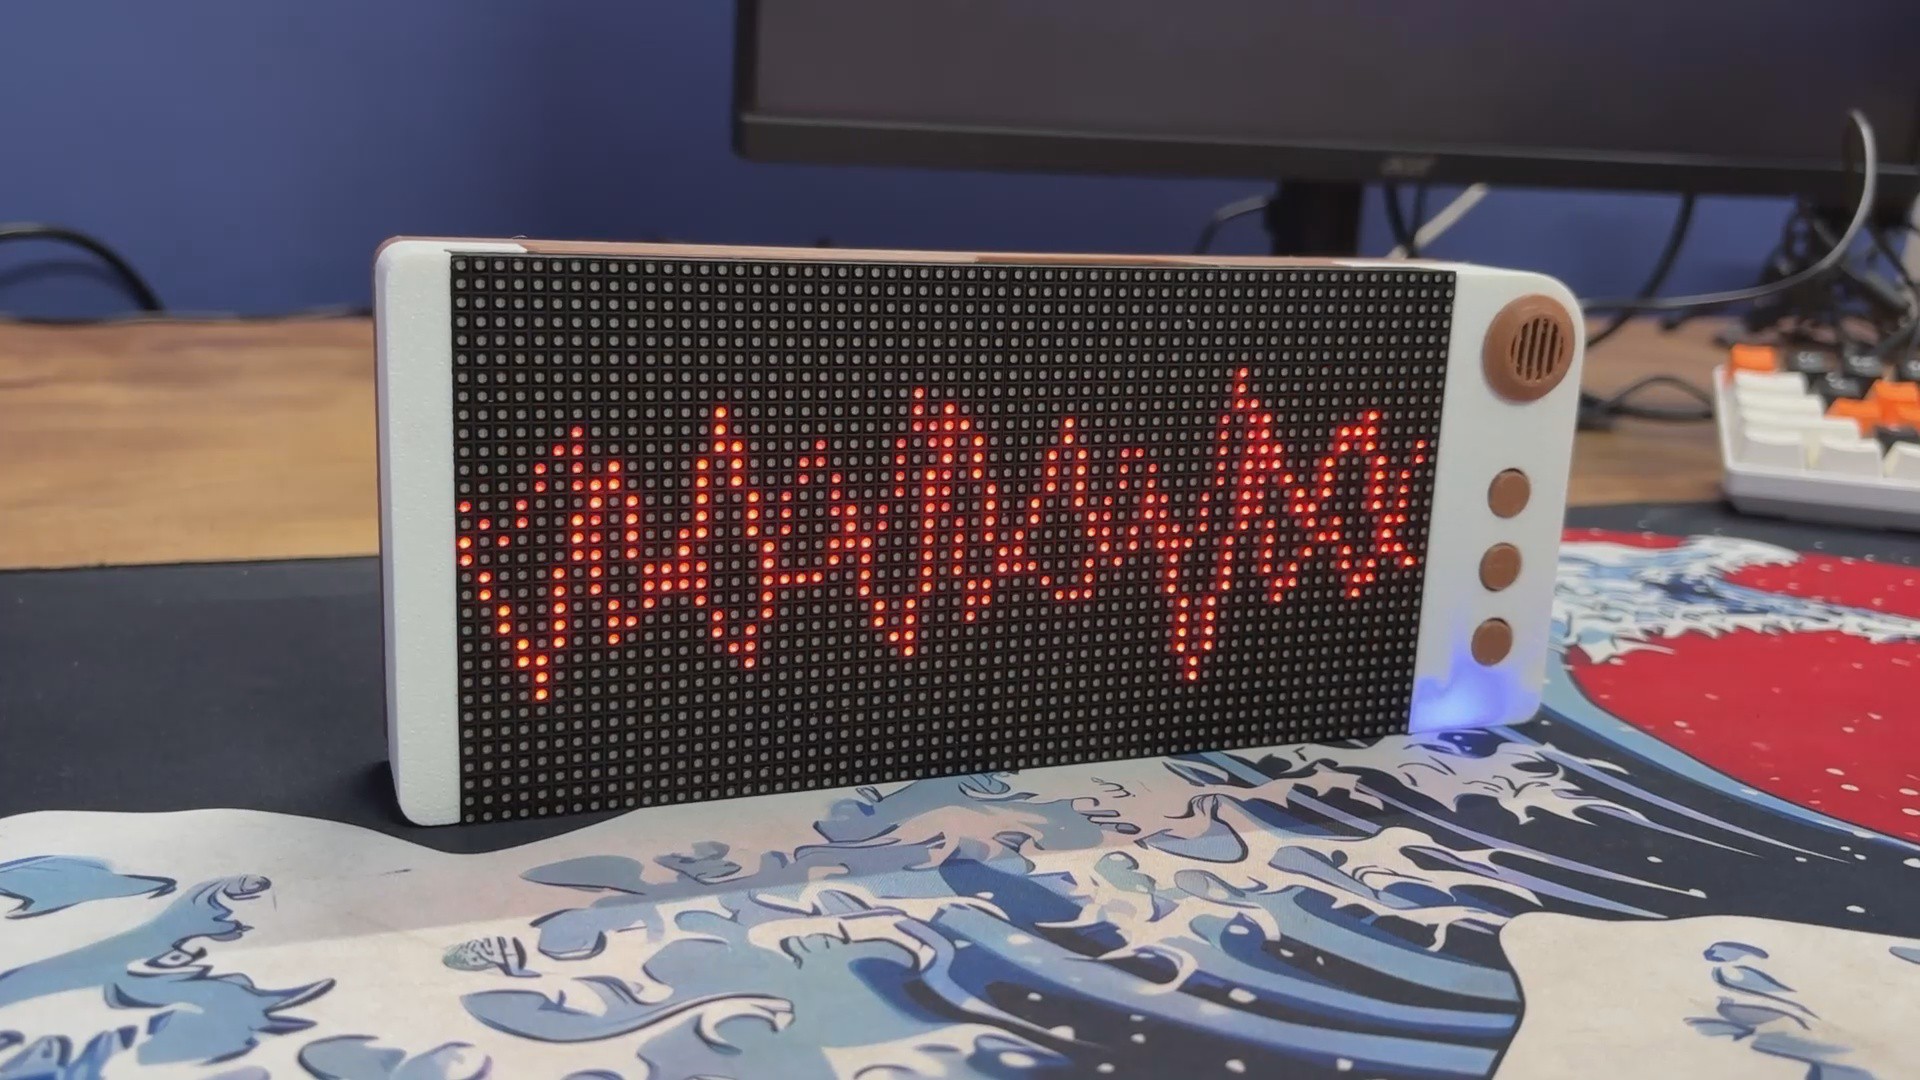
WaveForm takes this unseen phenomenon and transforms it into an interactive visual wave displayed on a HUB75 matrix. As the sound grows louder, the wave expands and intensifies in real time.
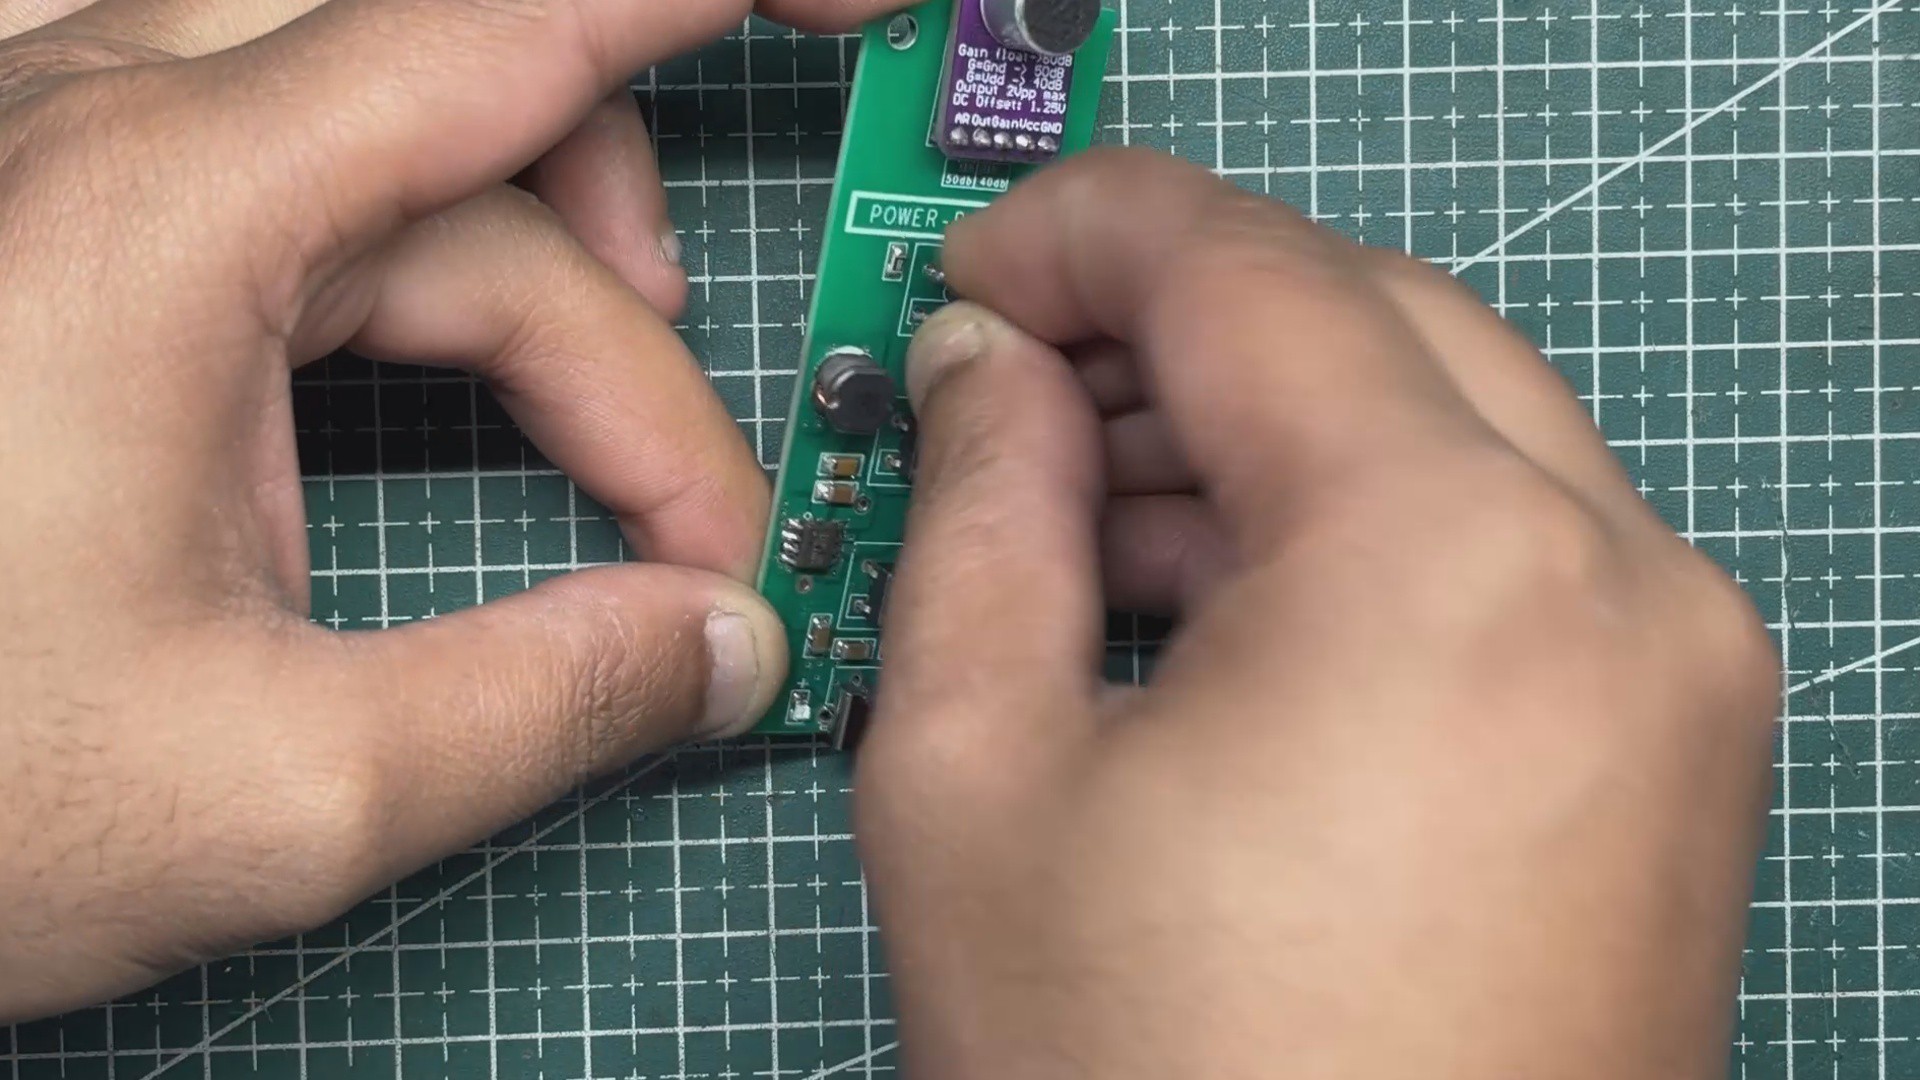
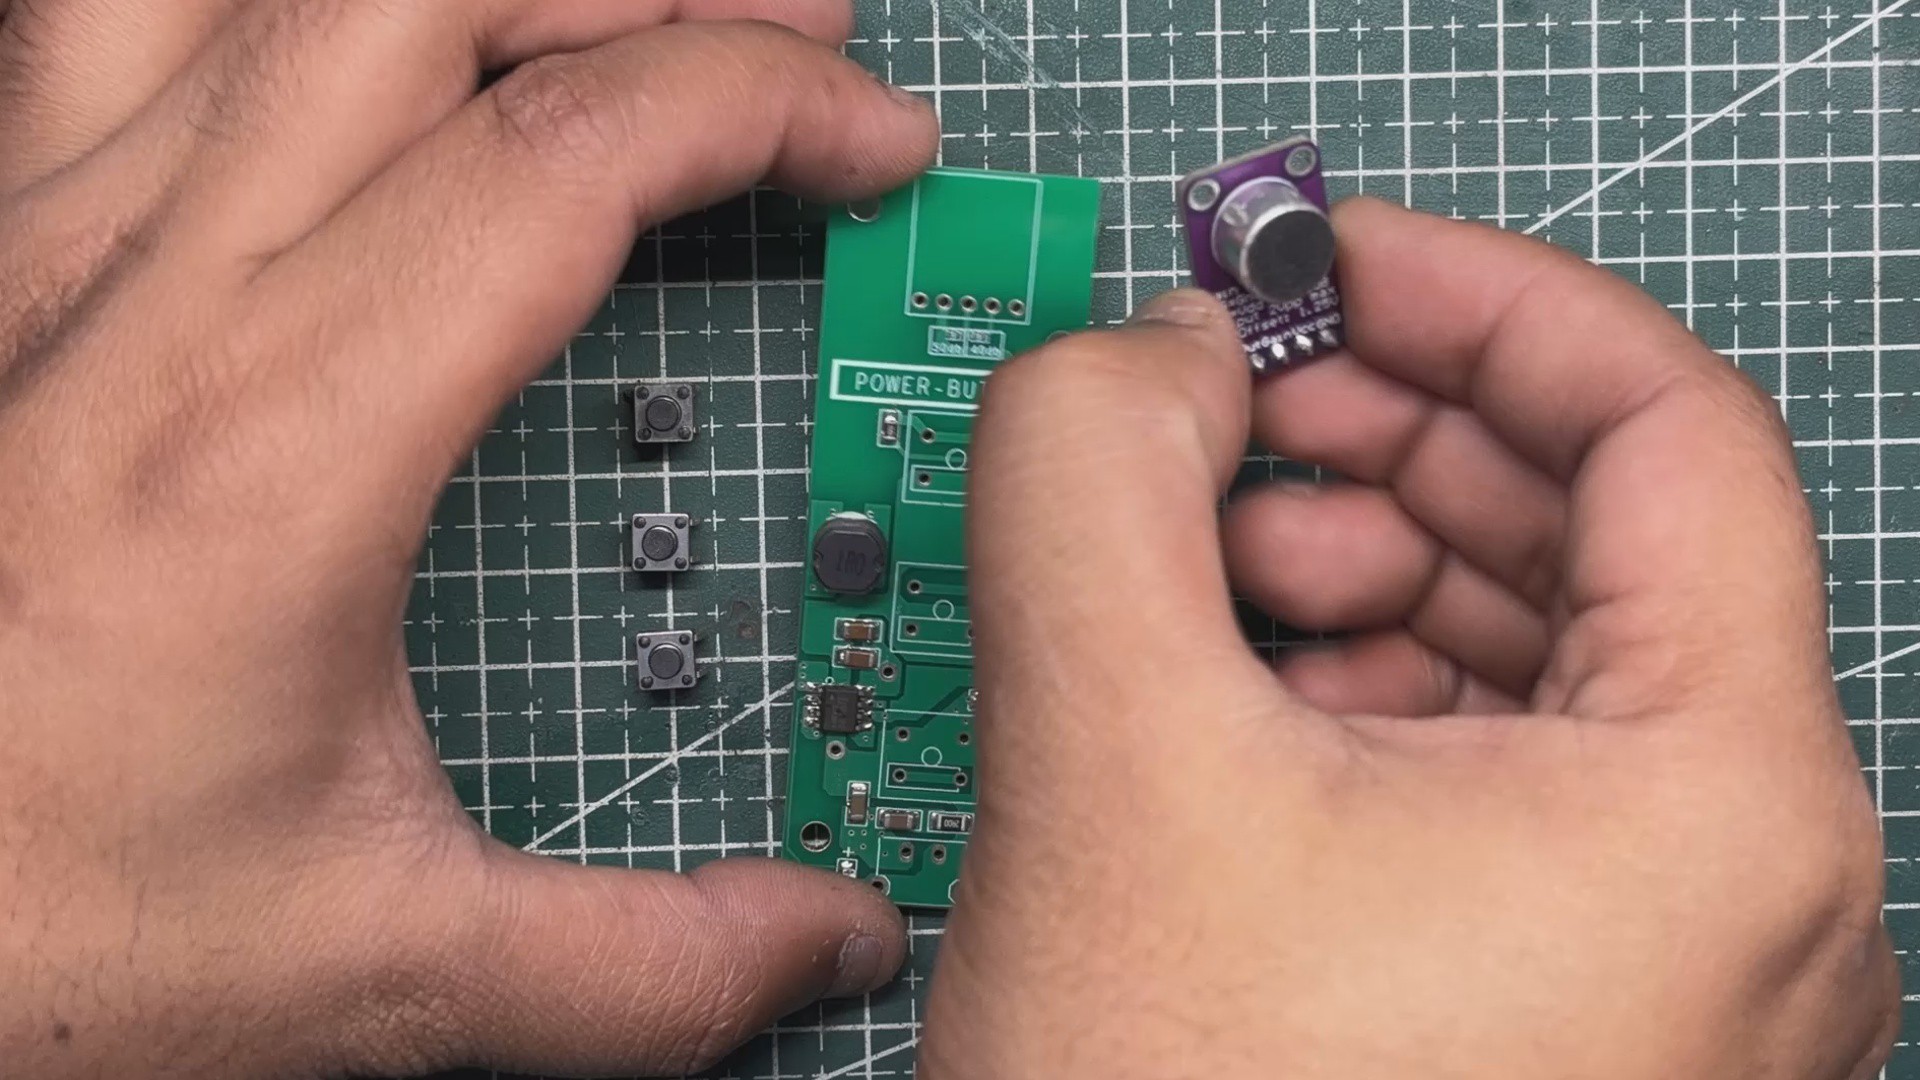
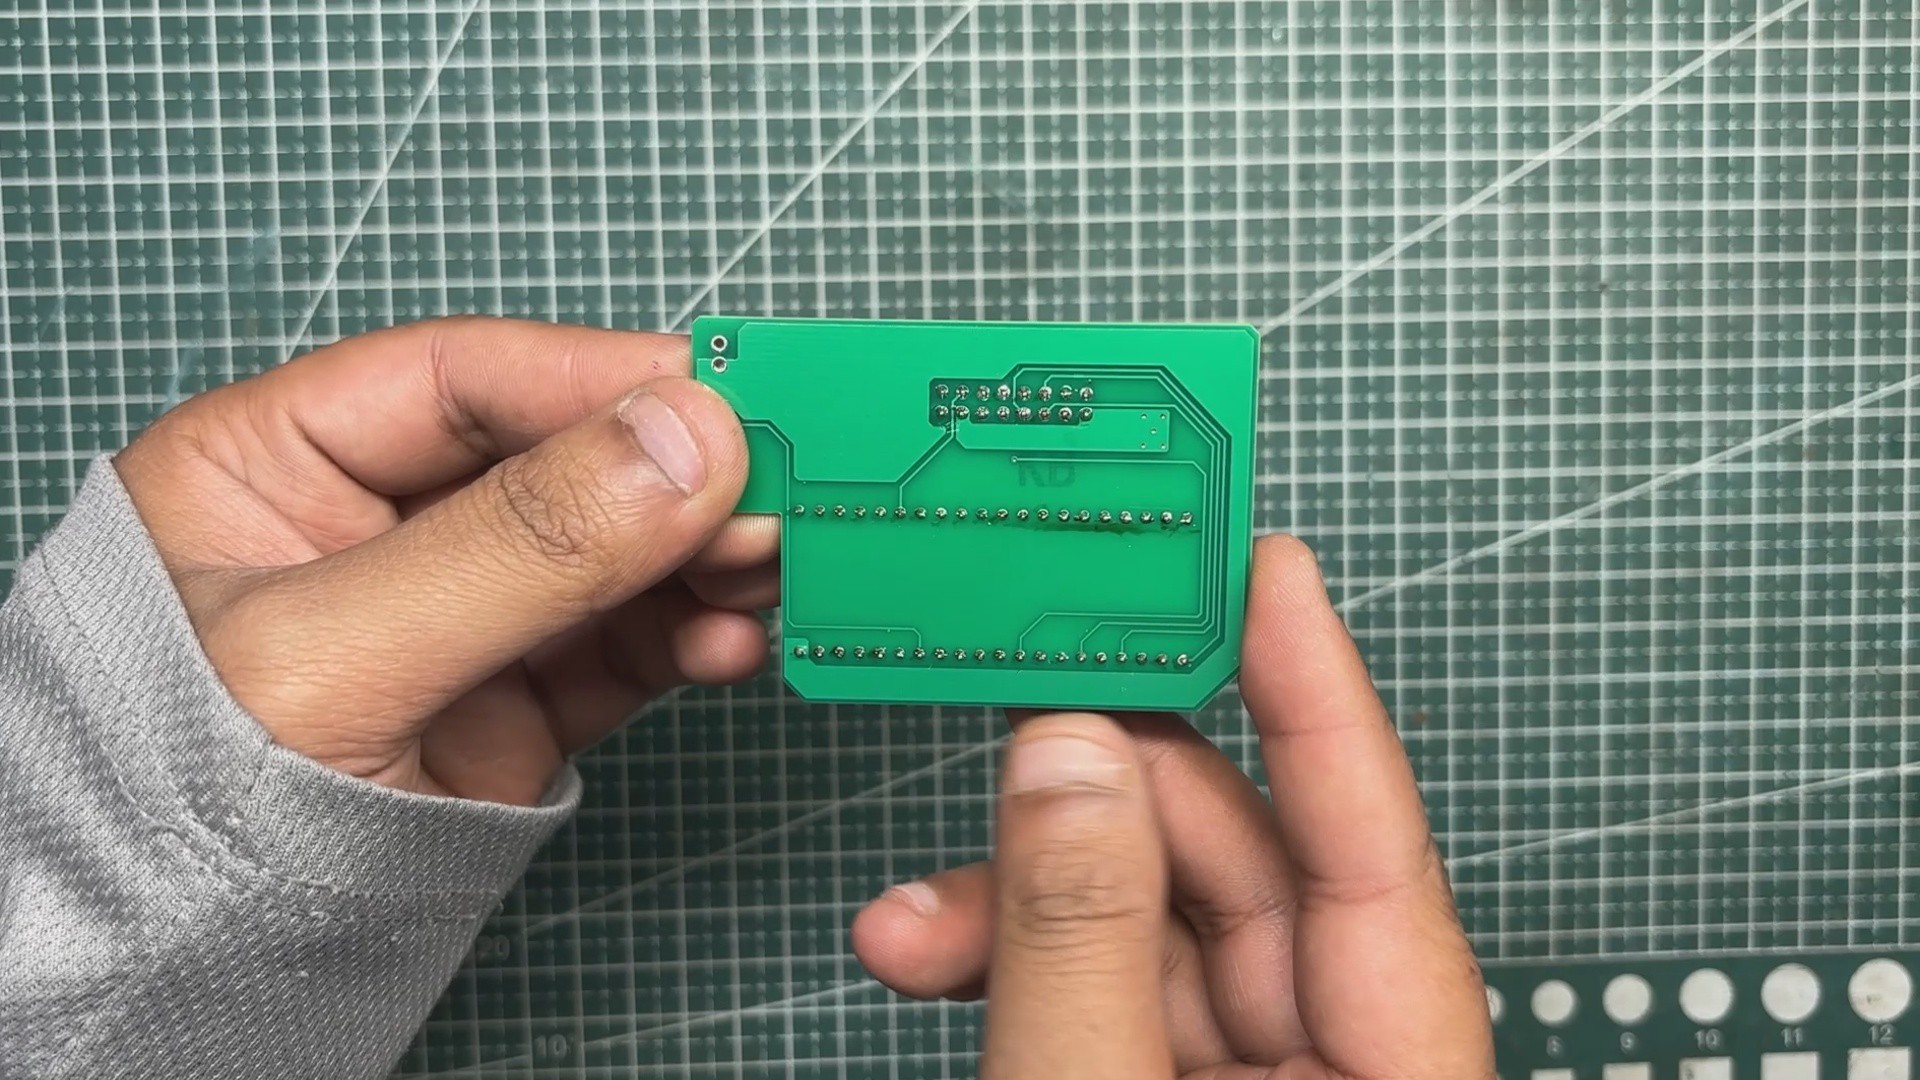
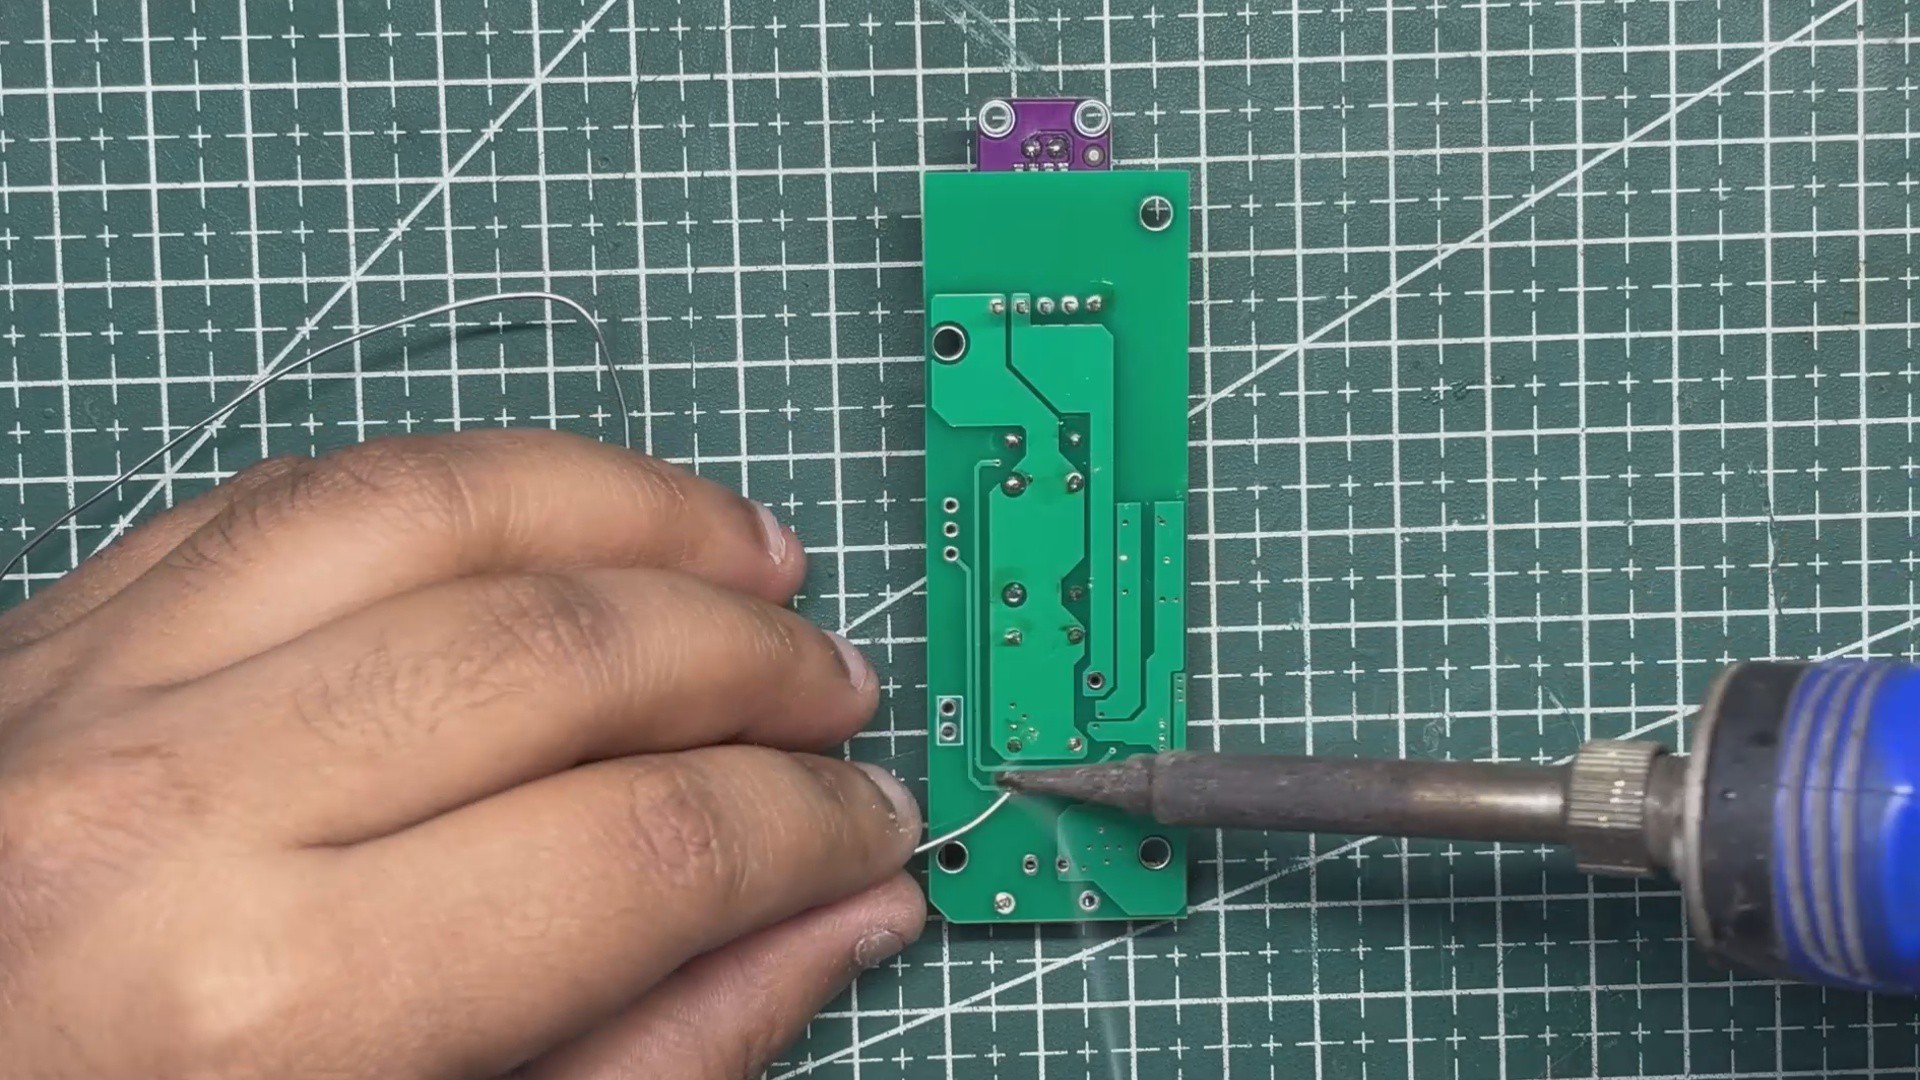
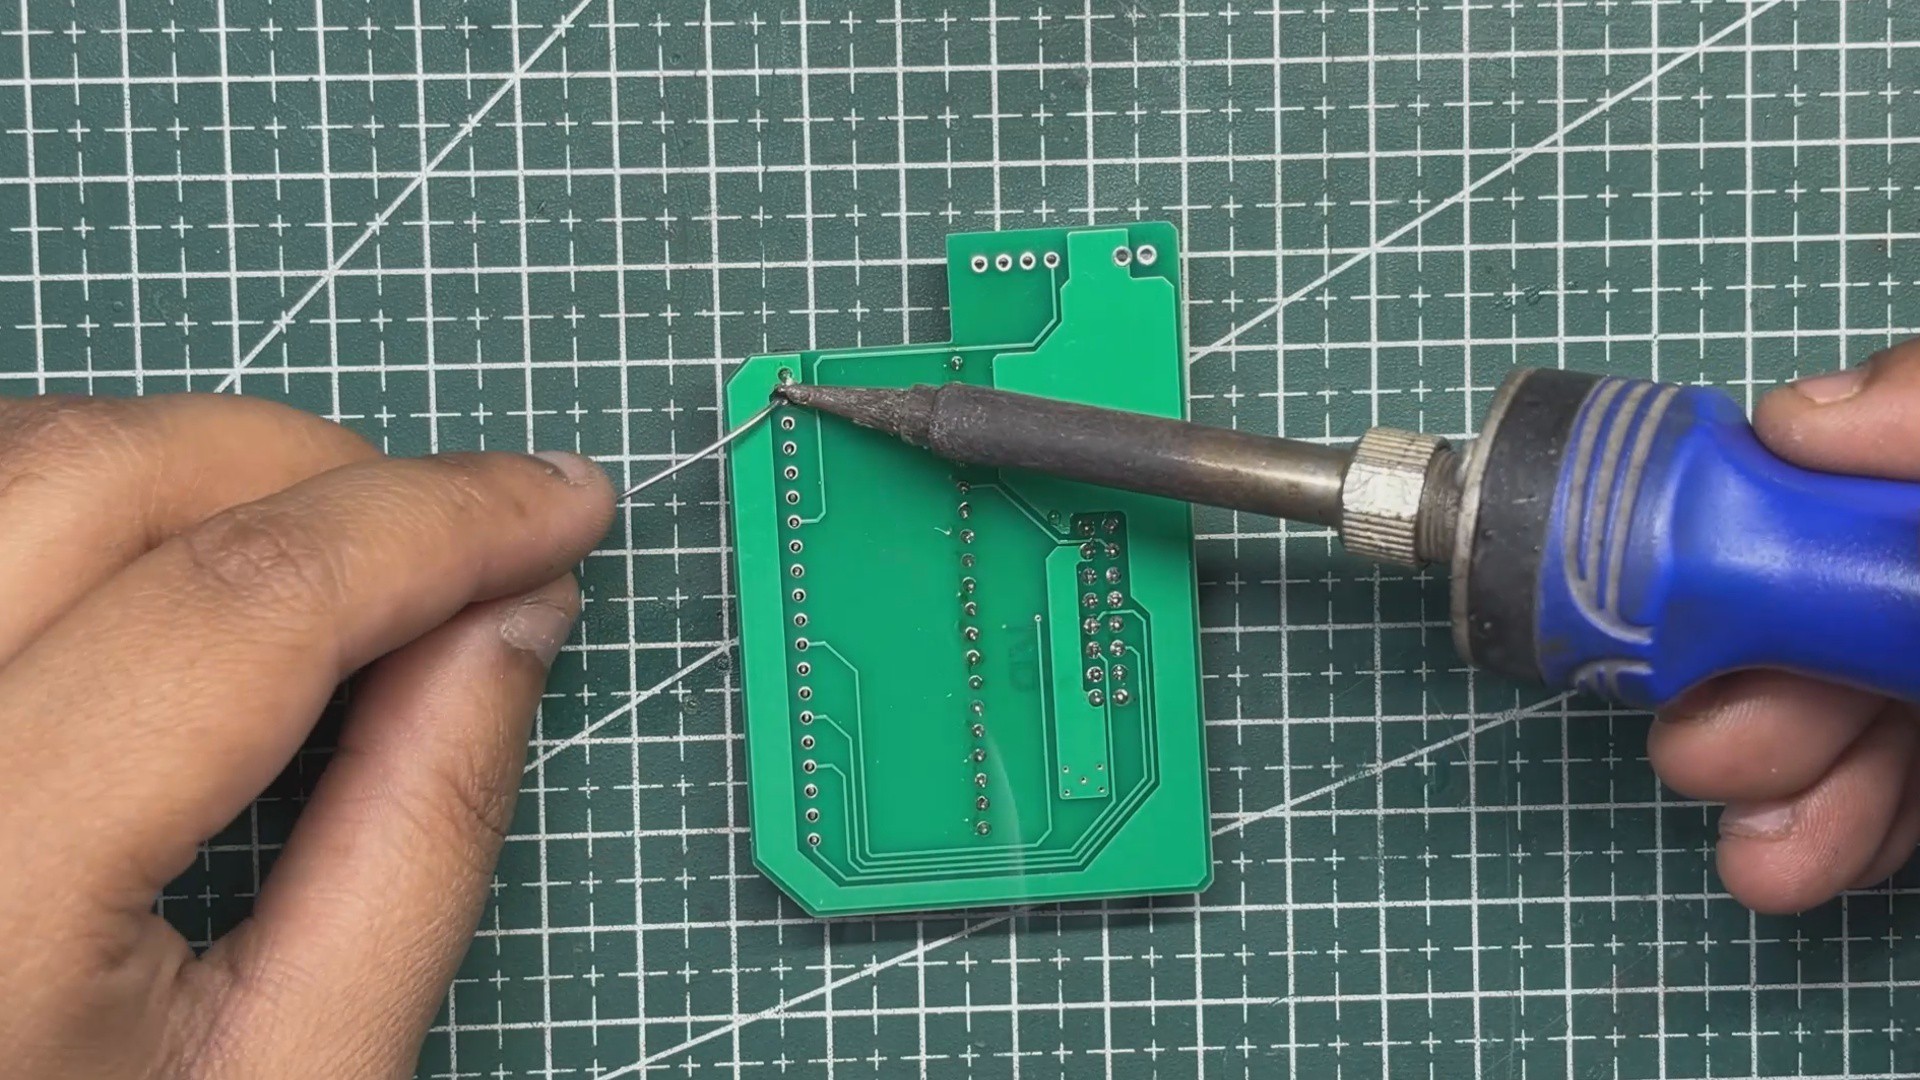
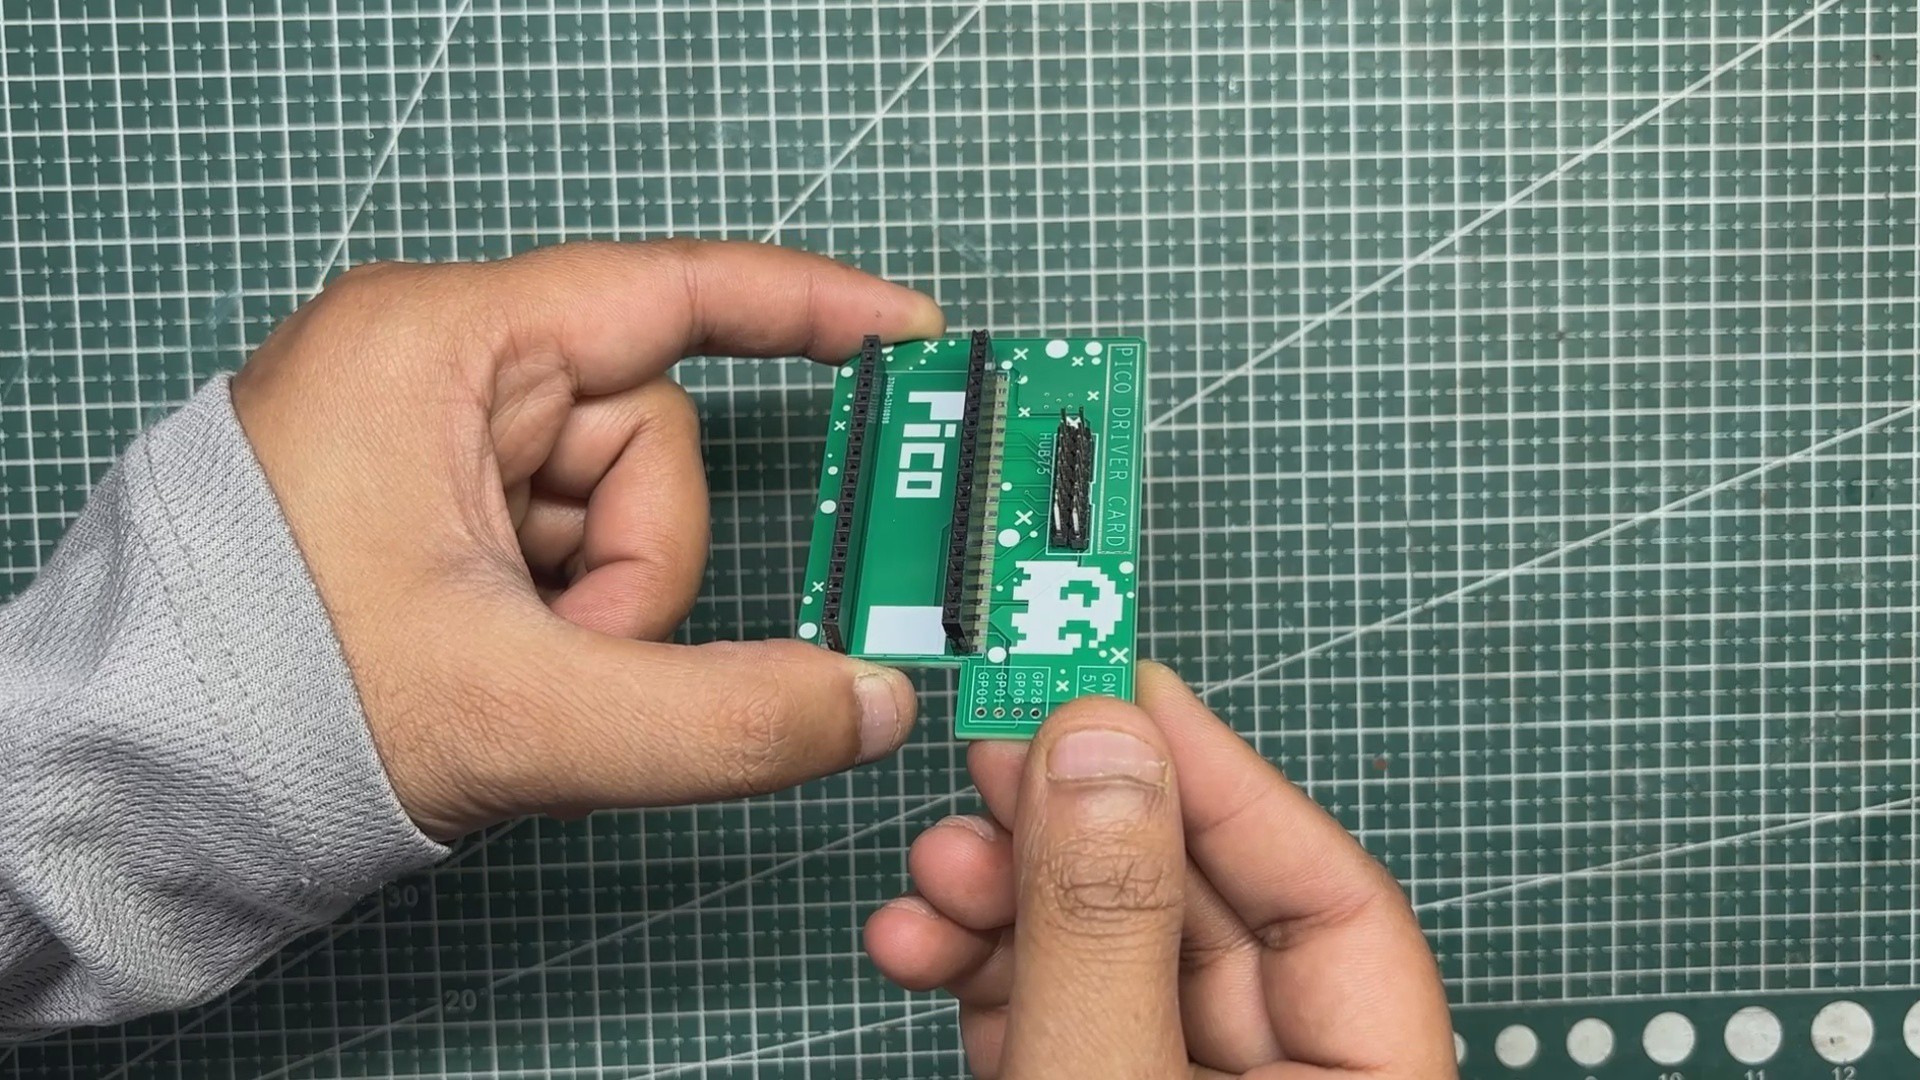
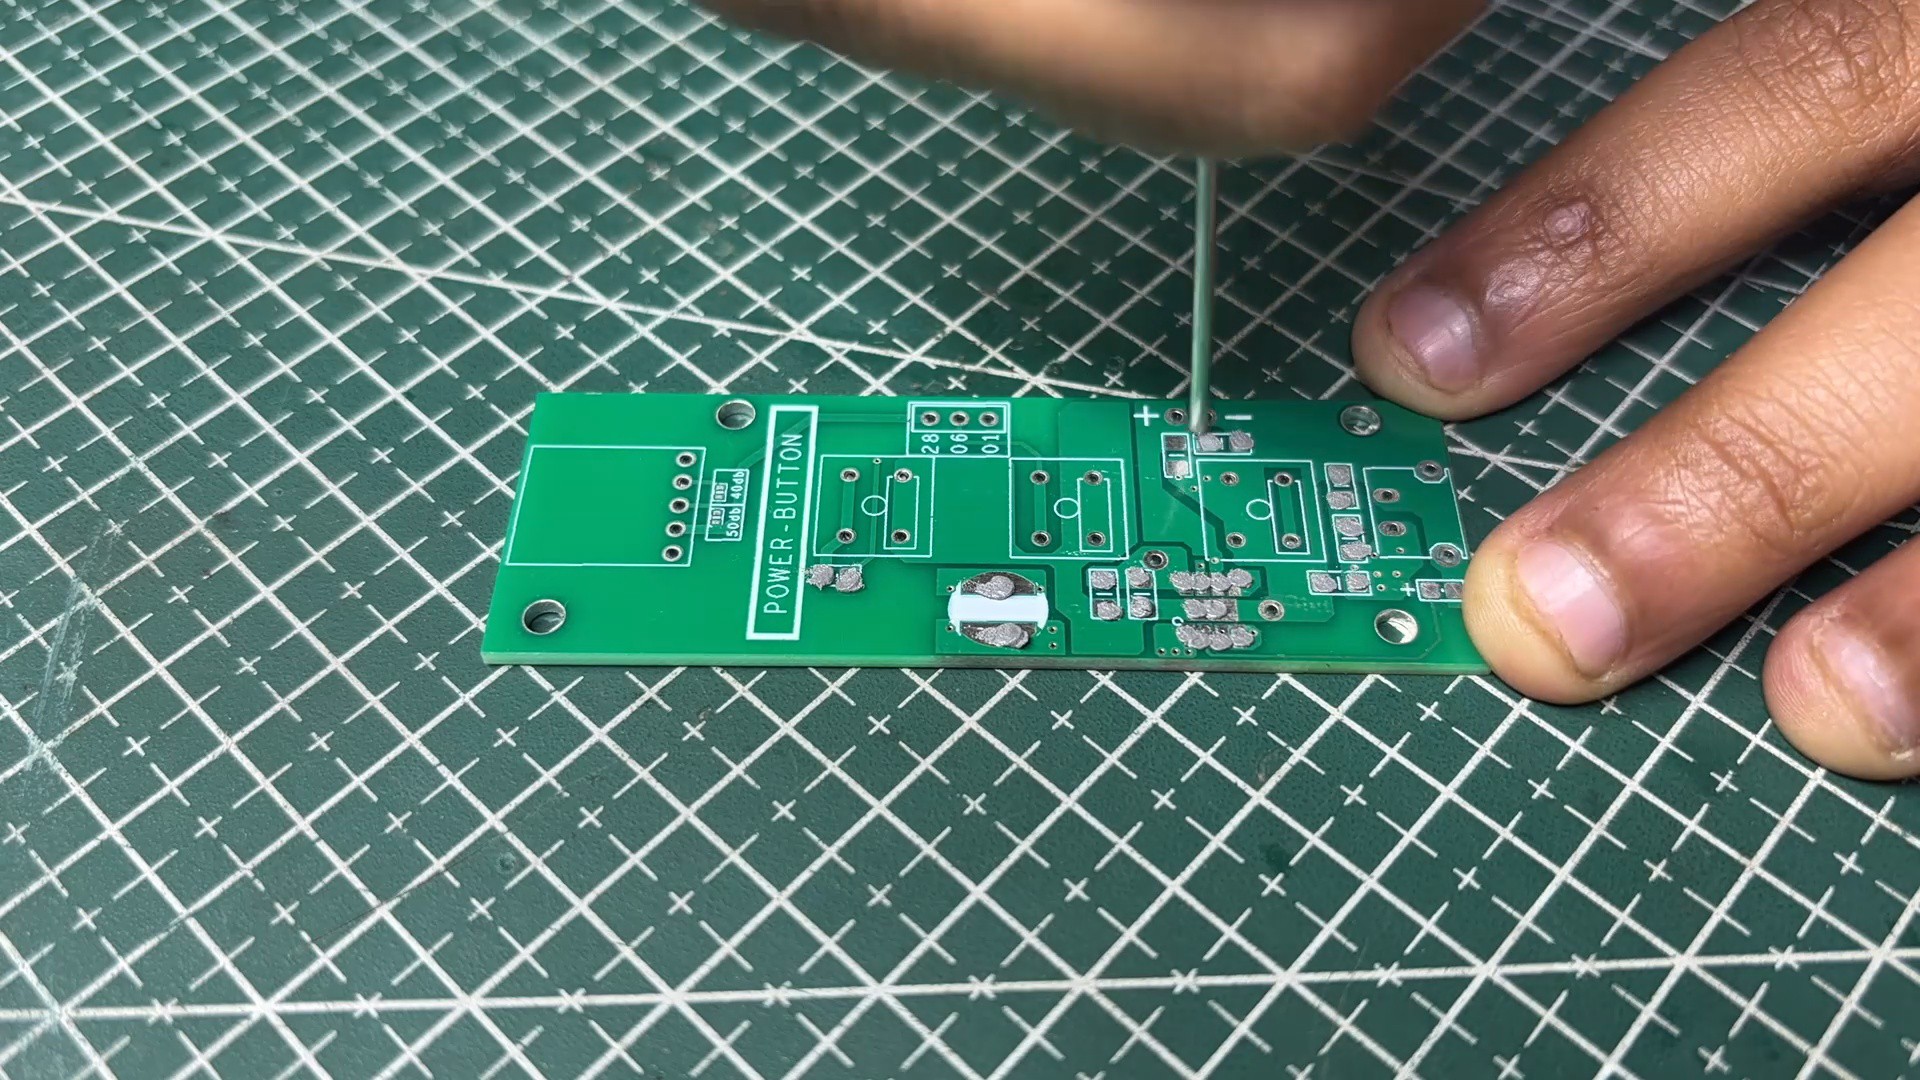
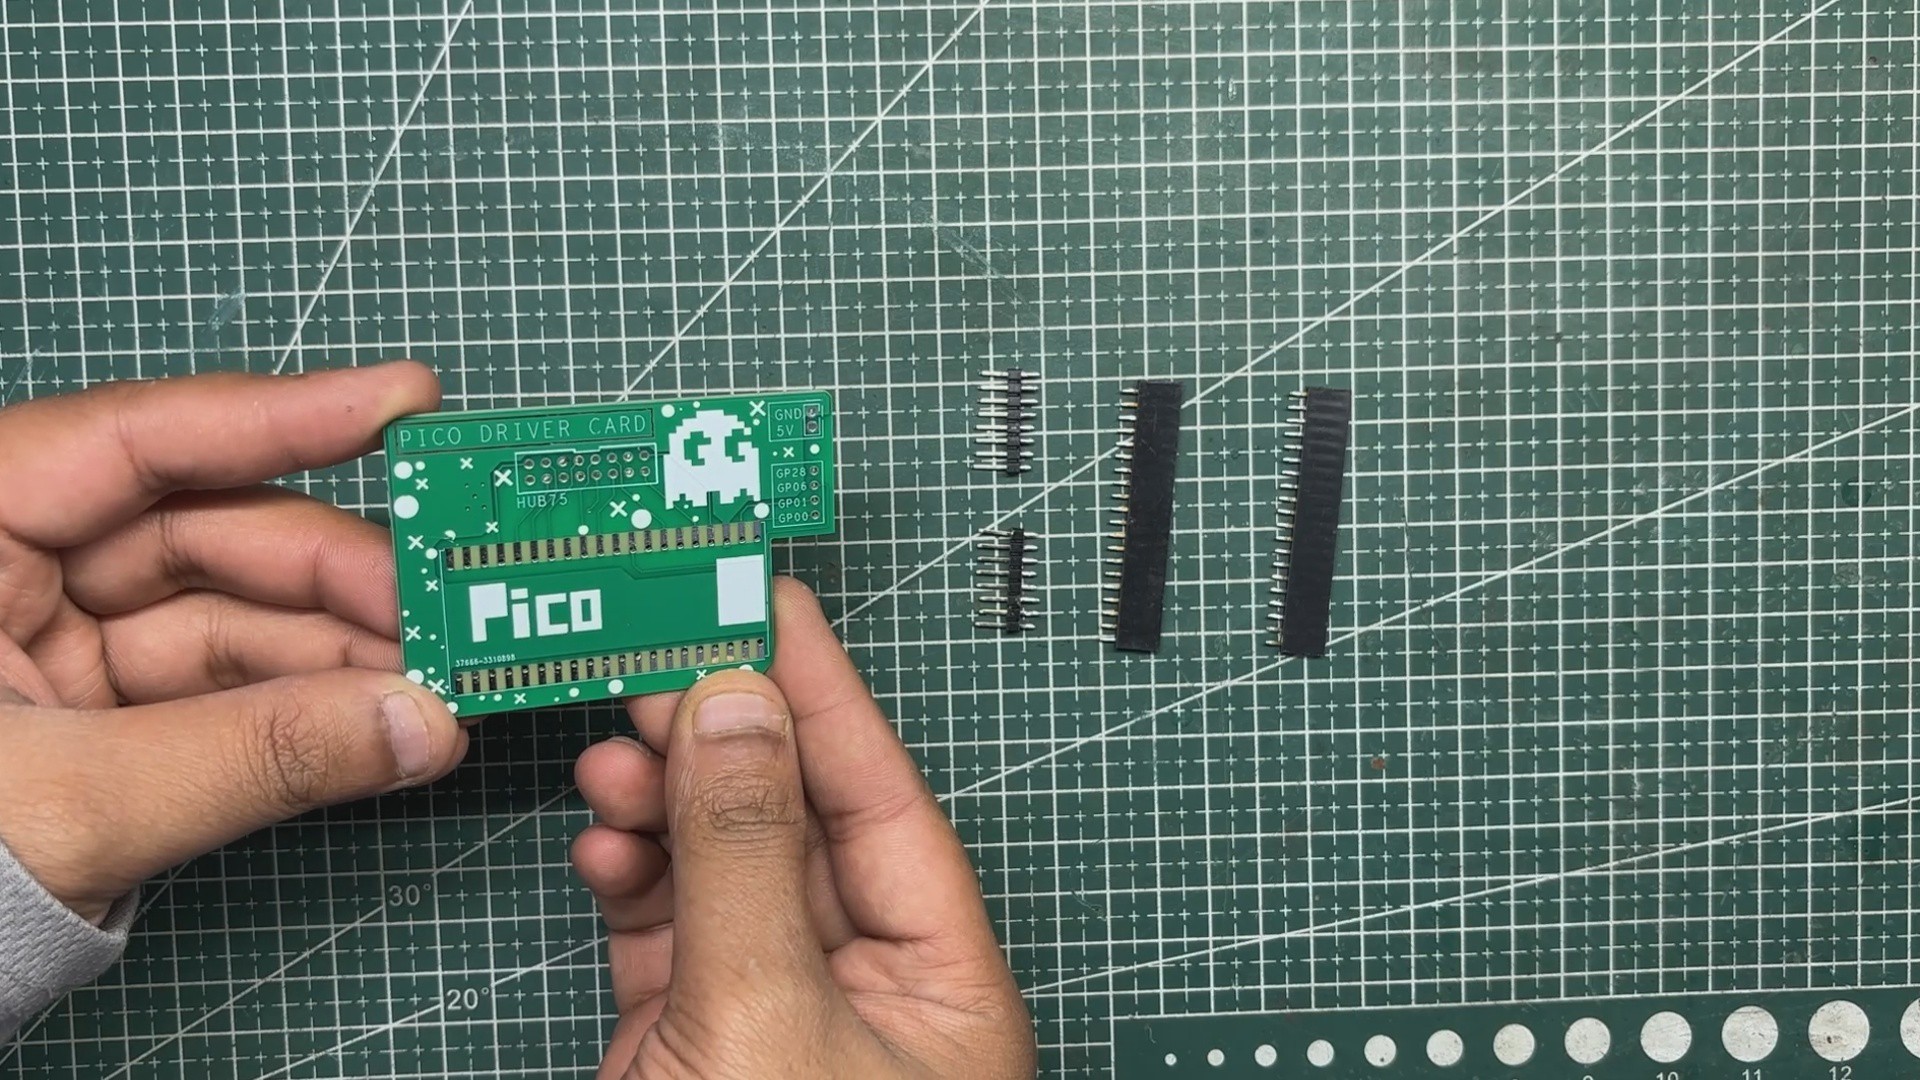
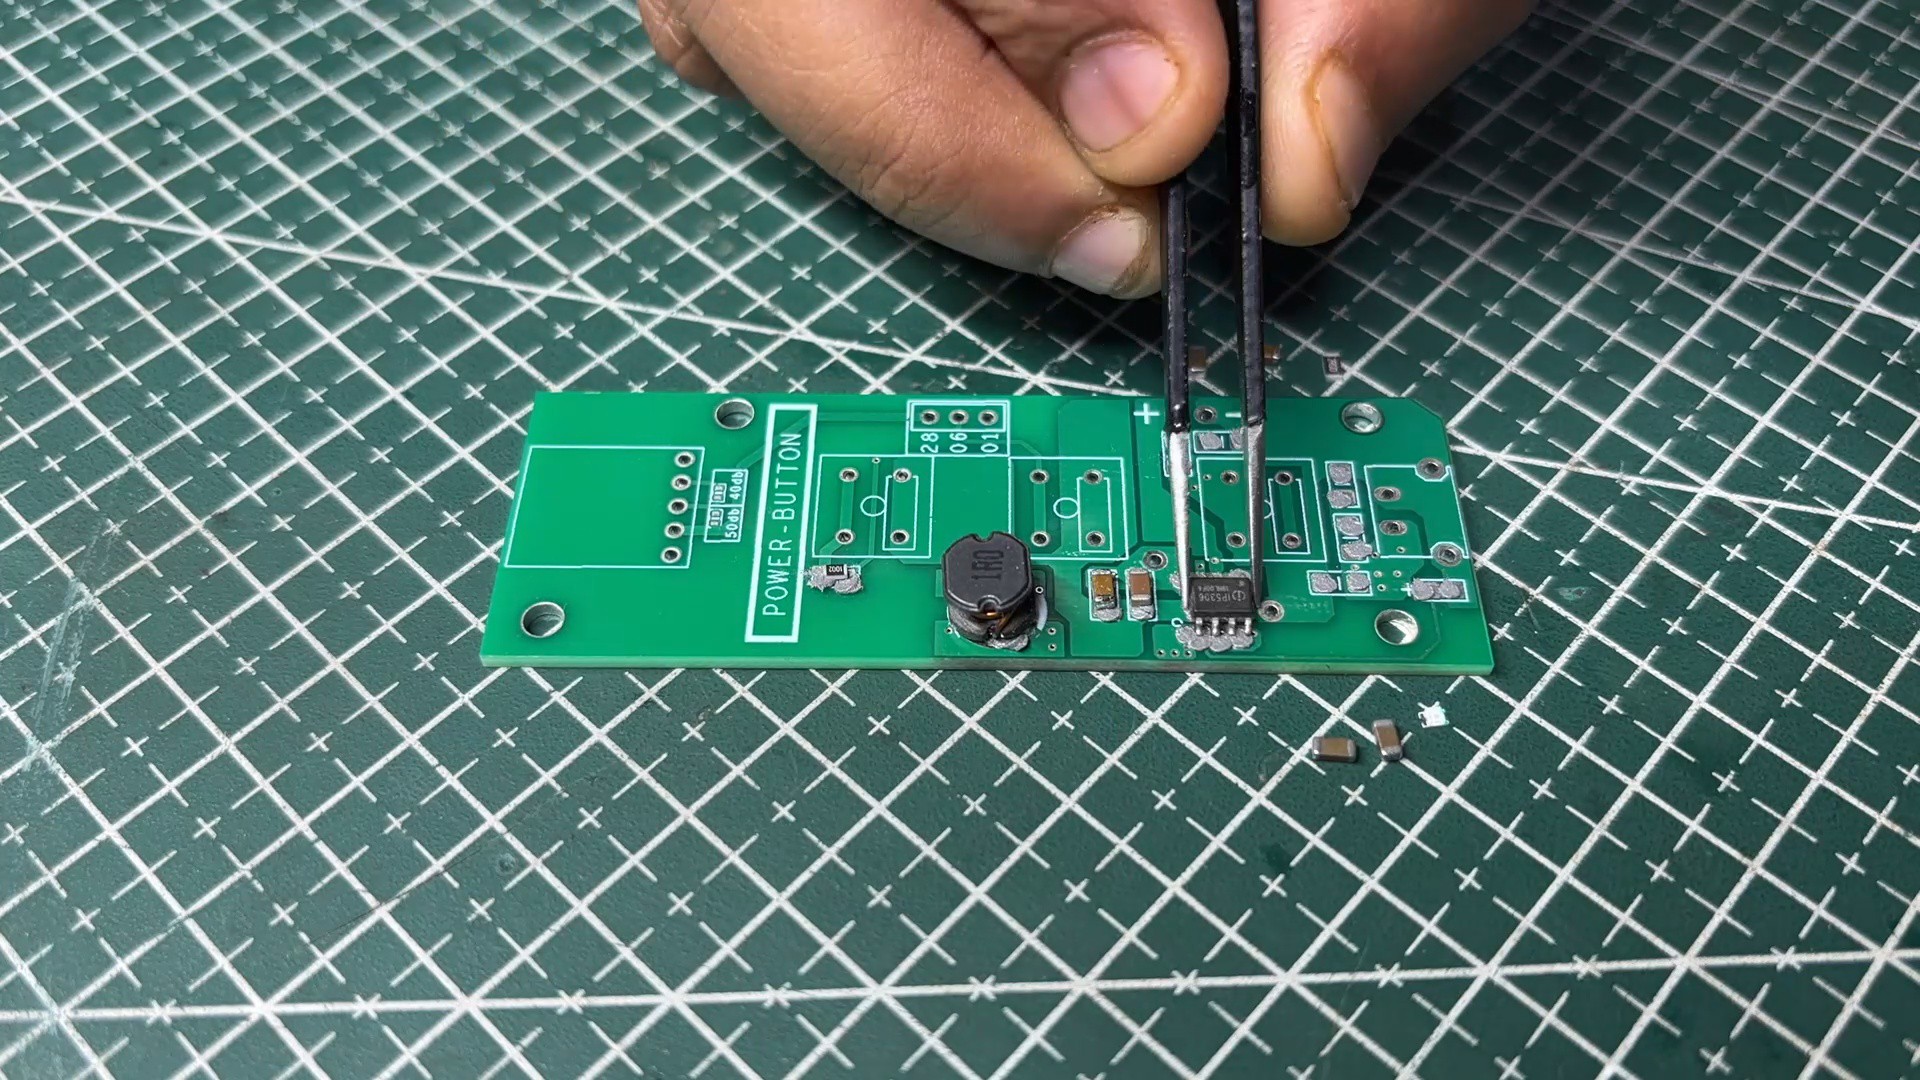
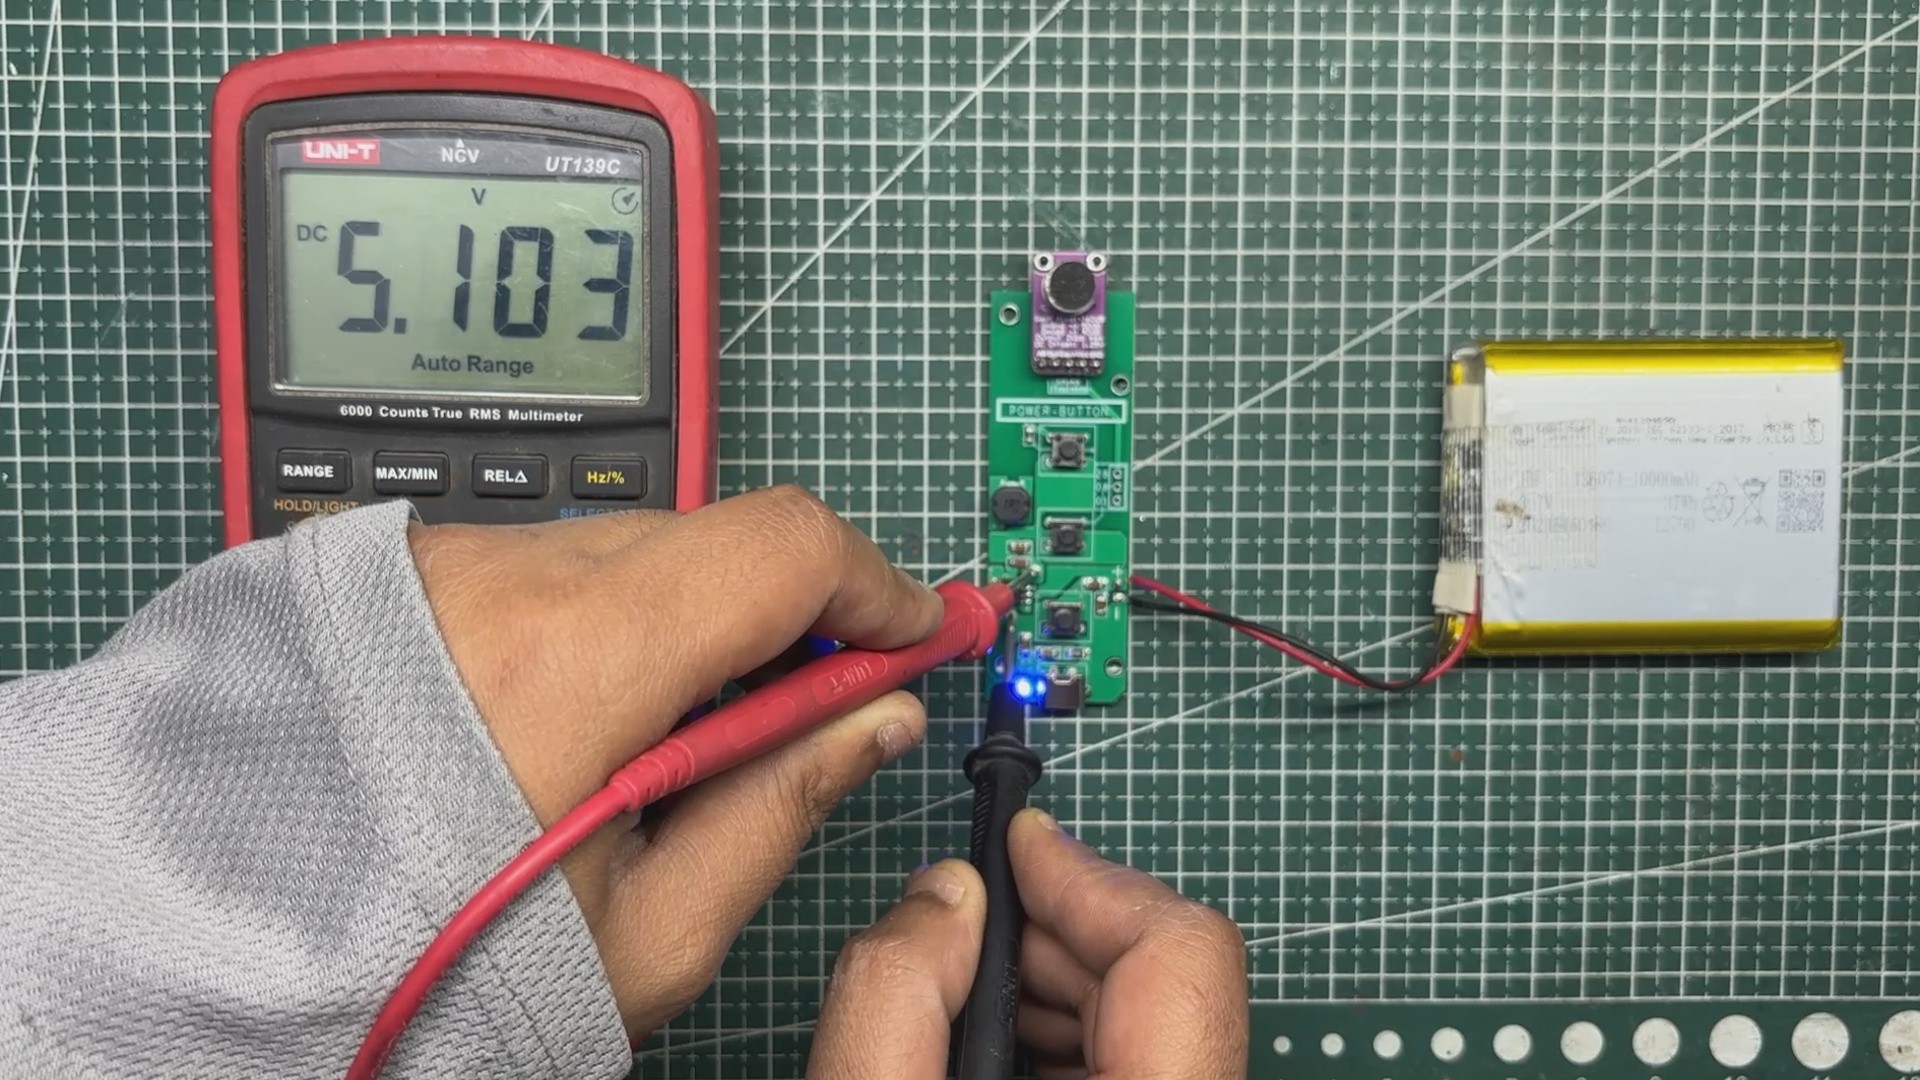
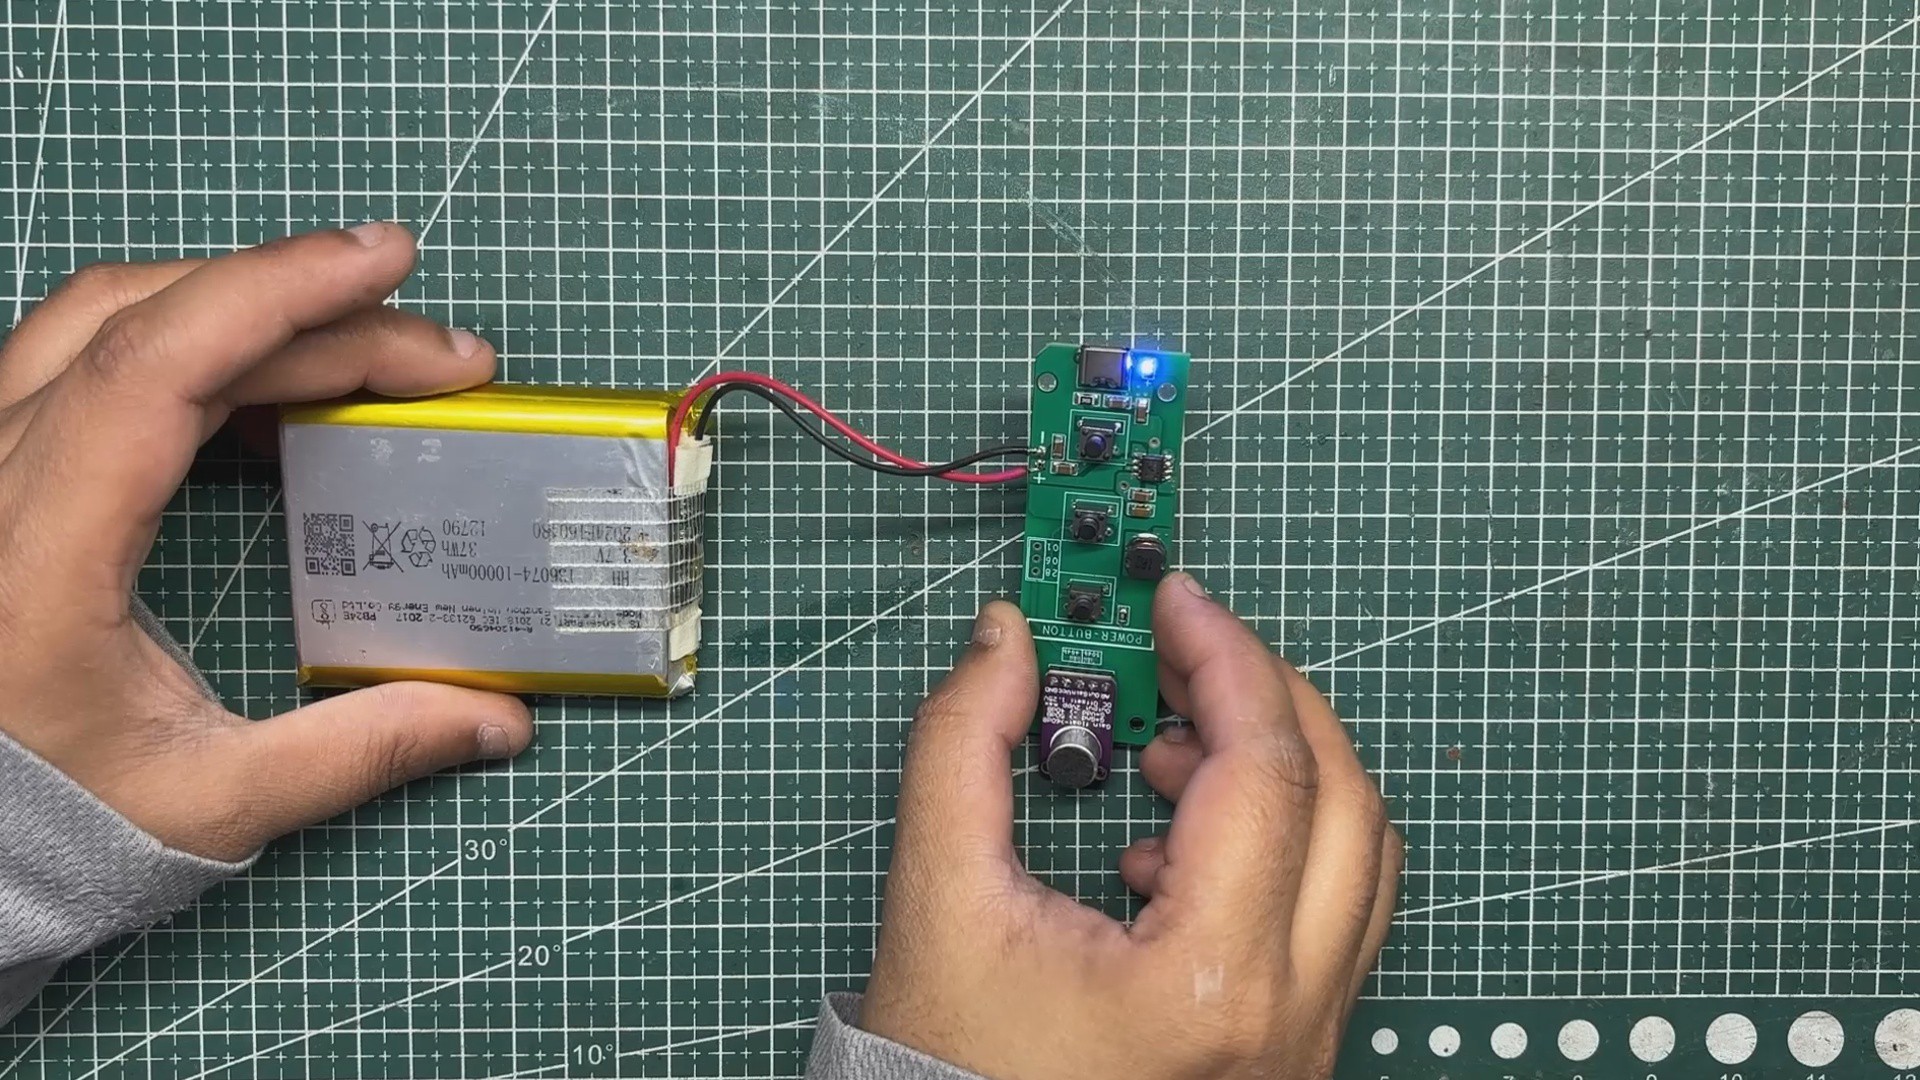
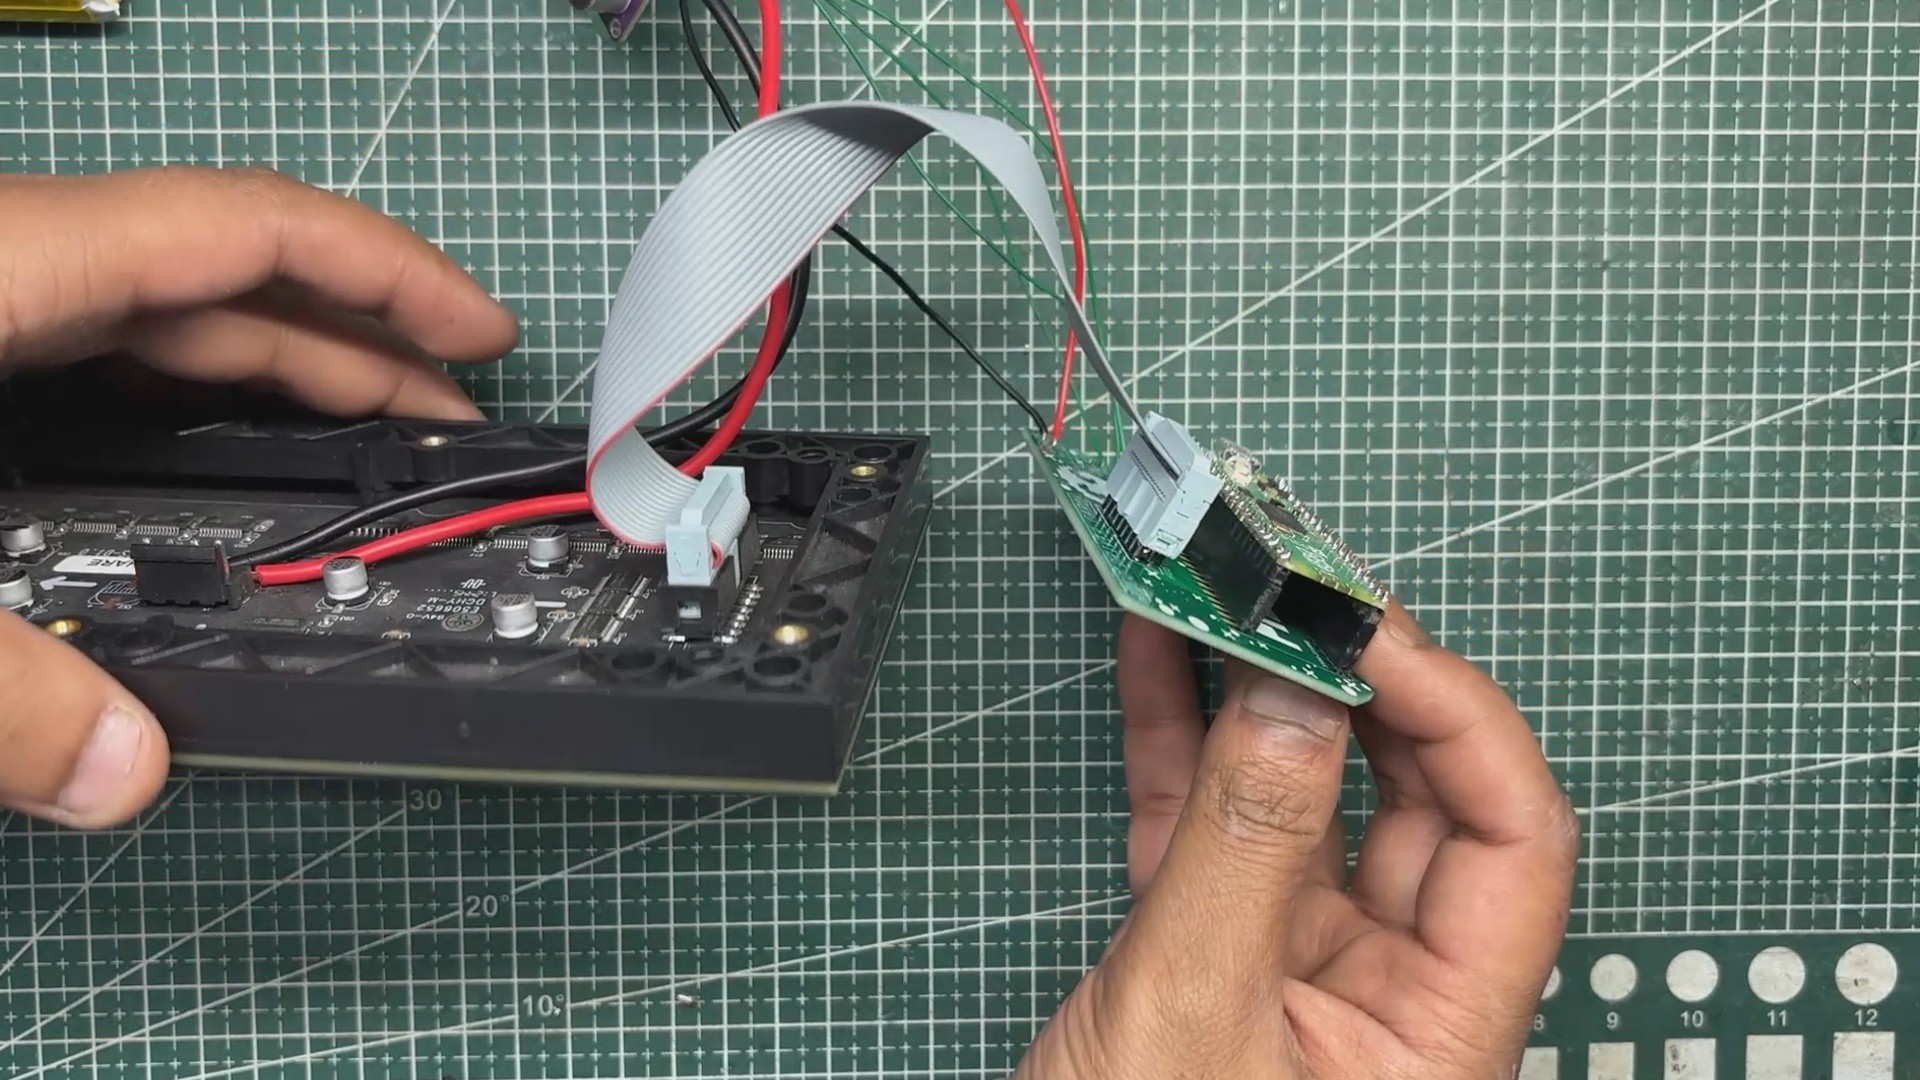
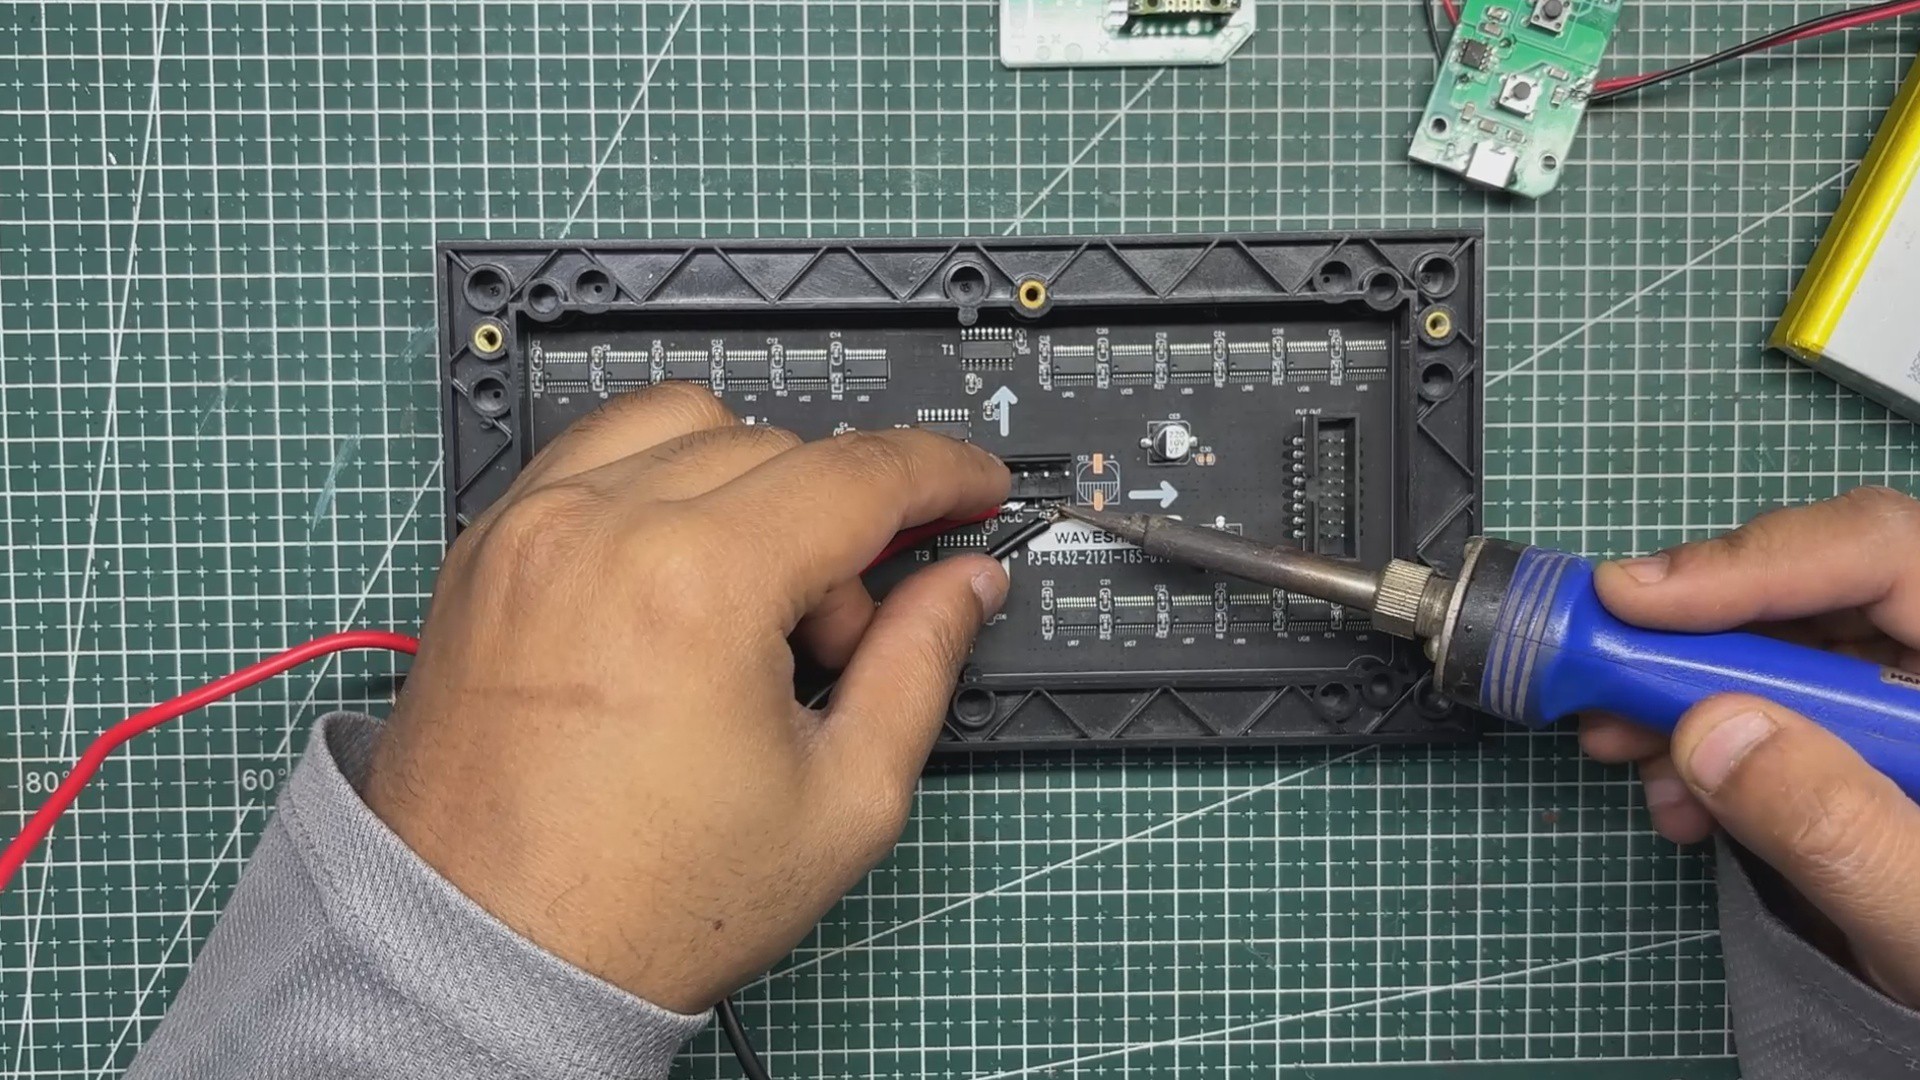
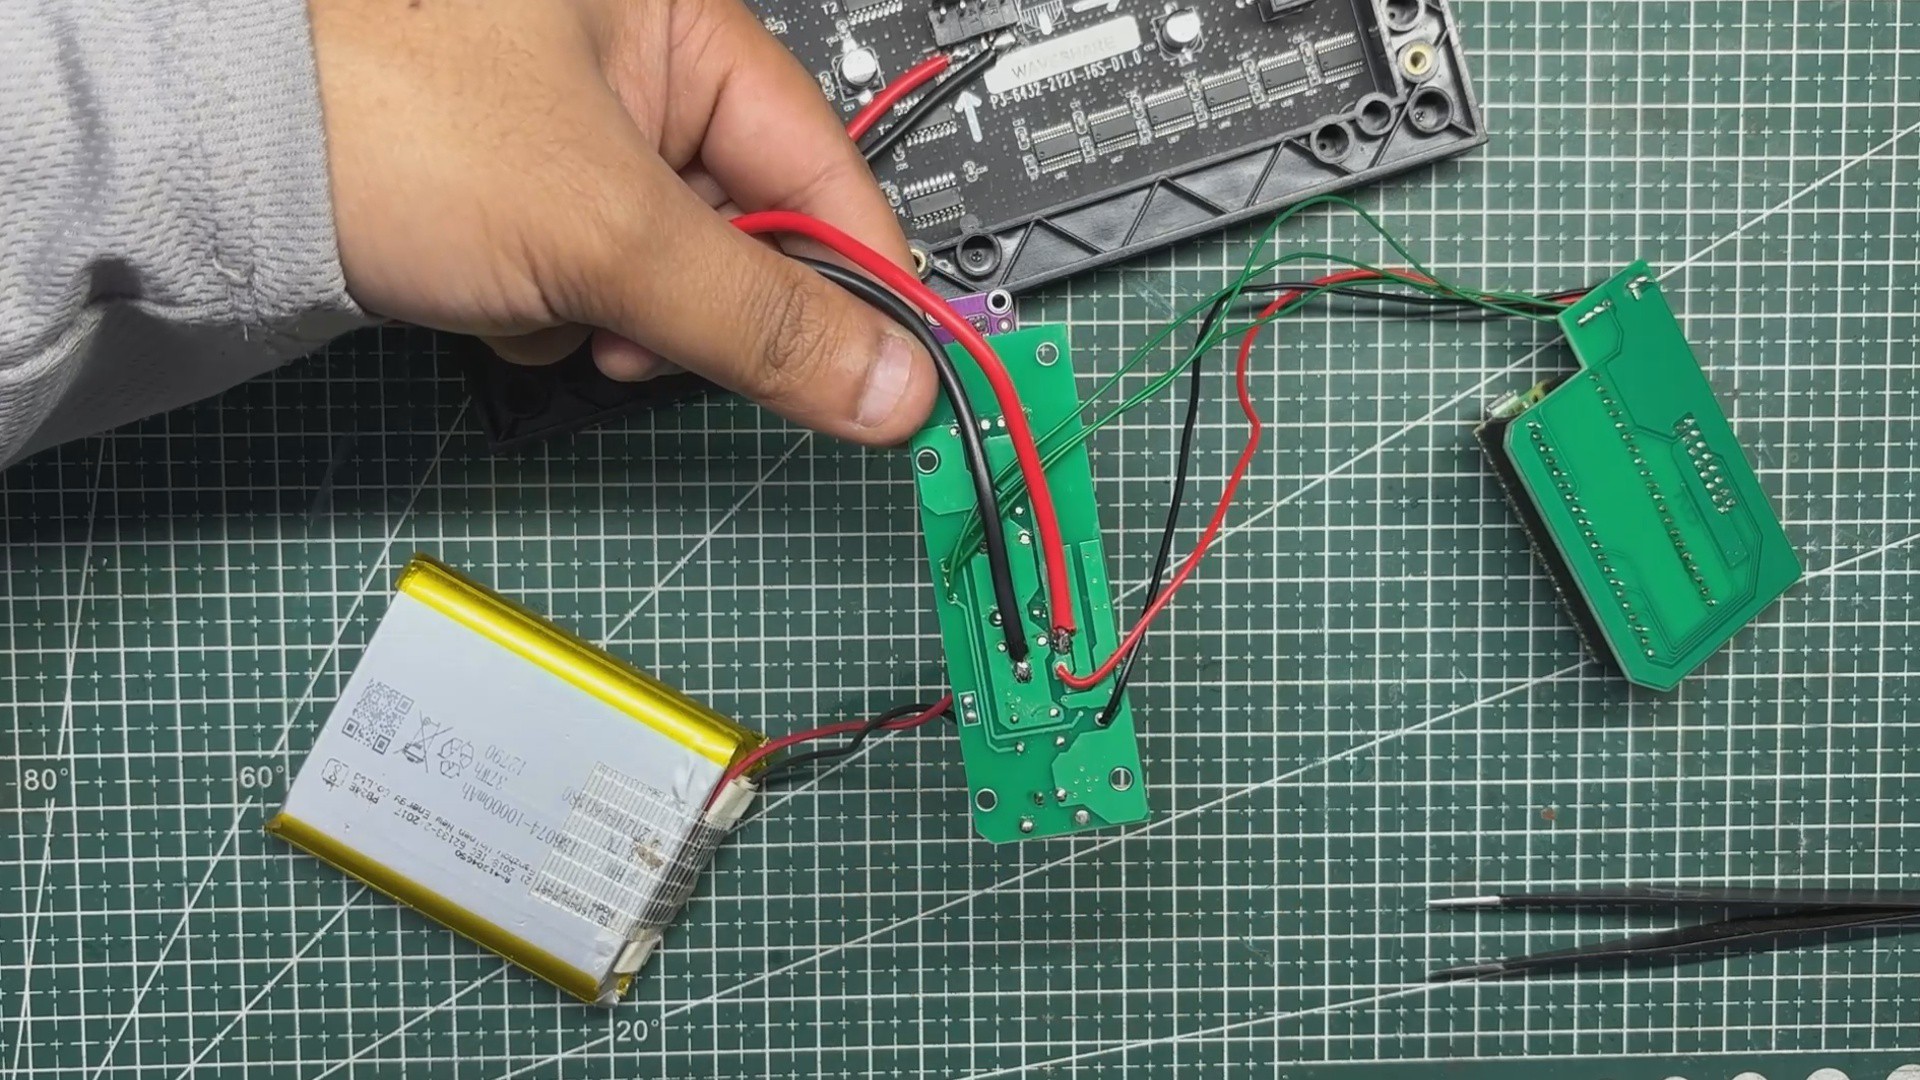
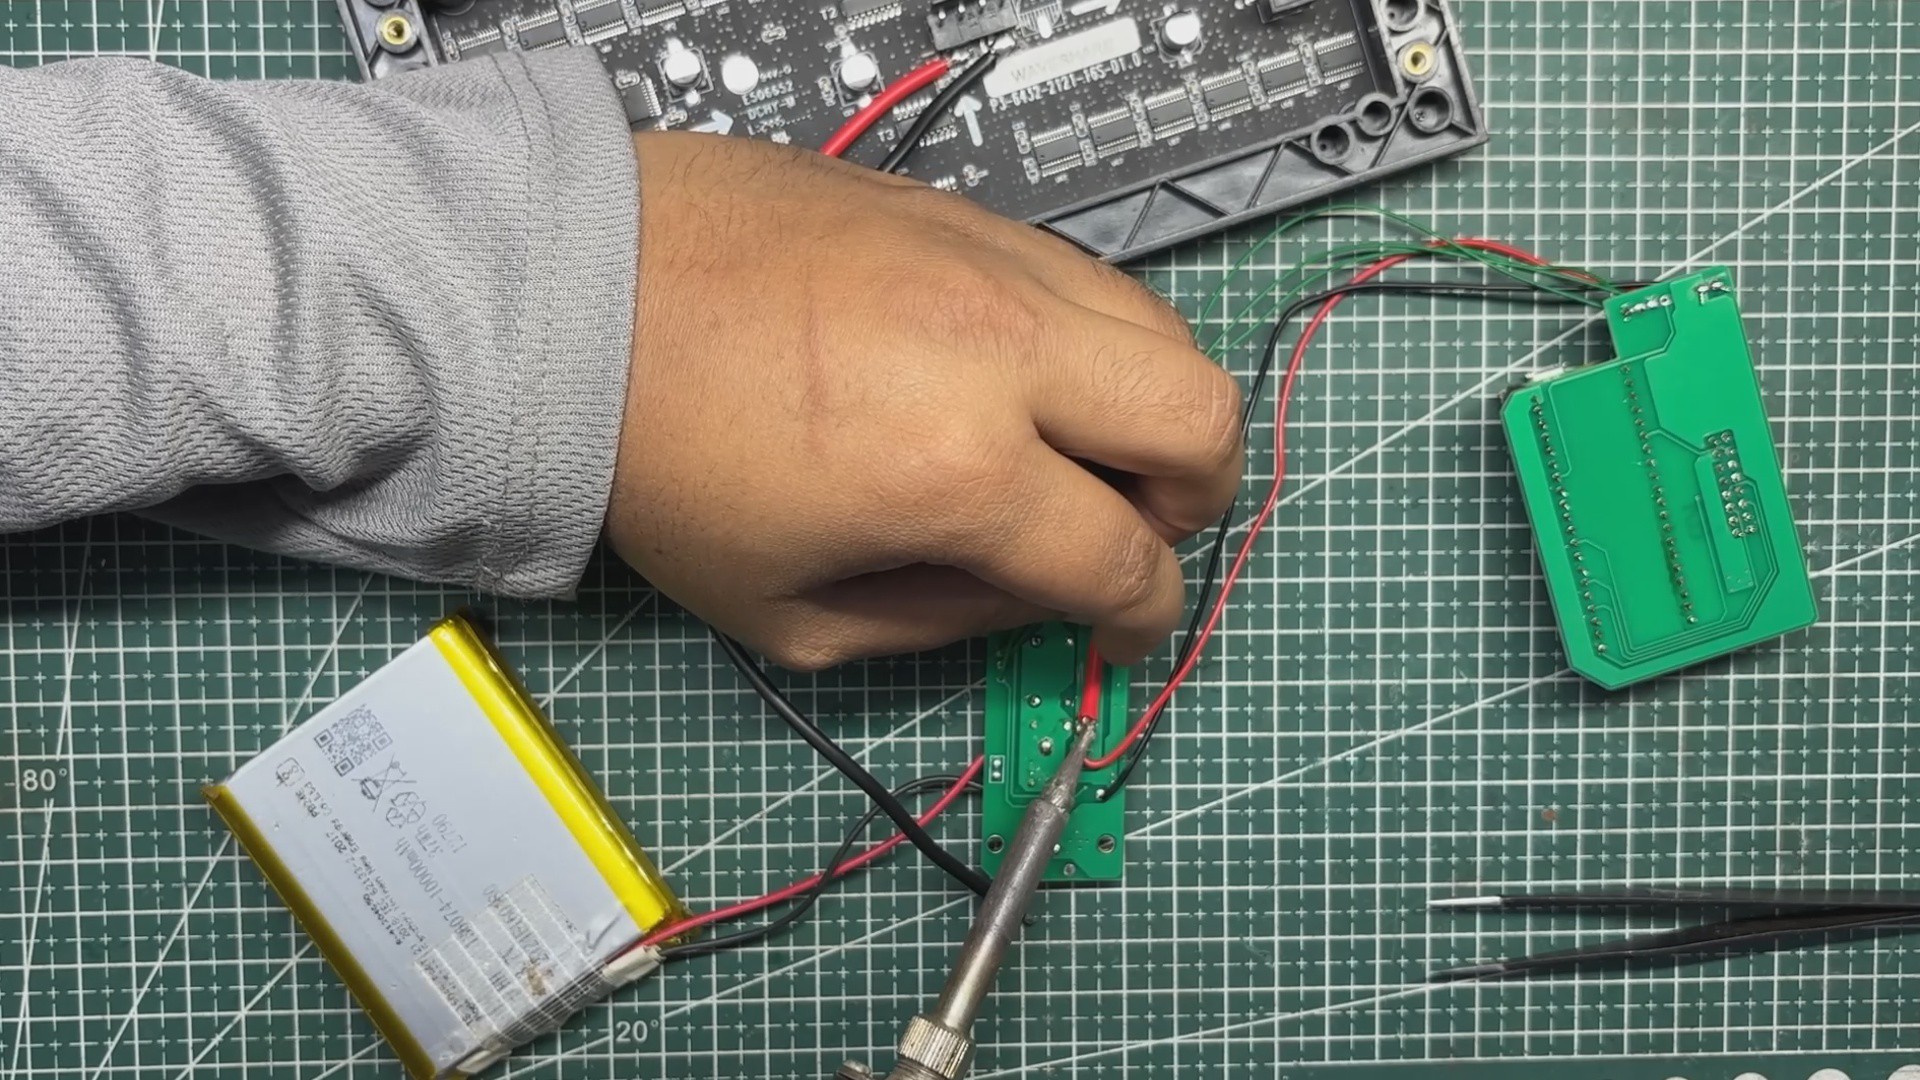
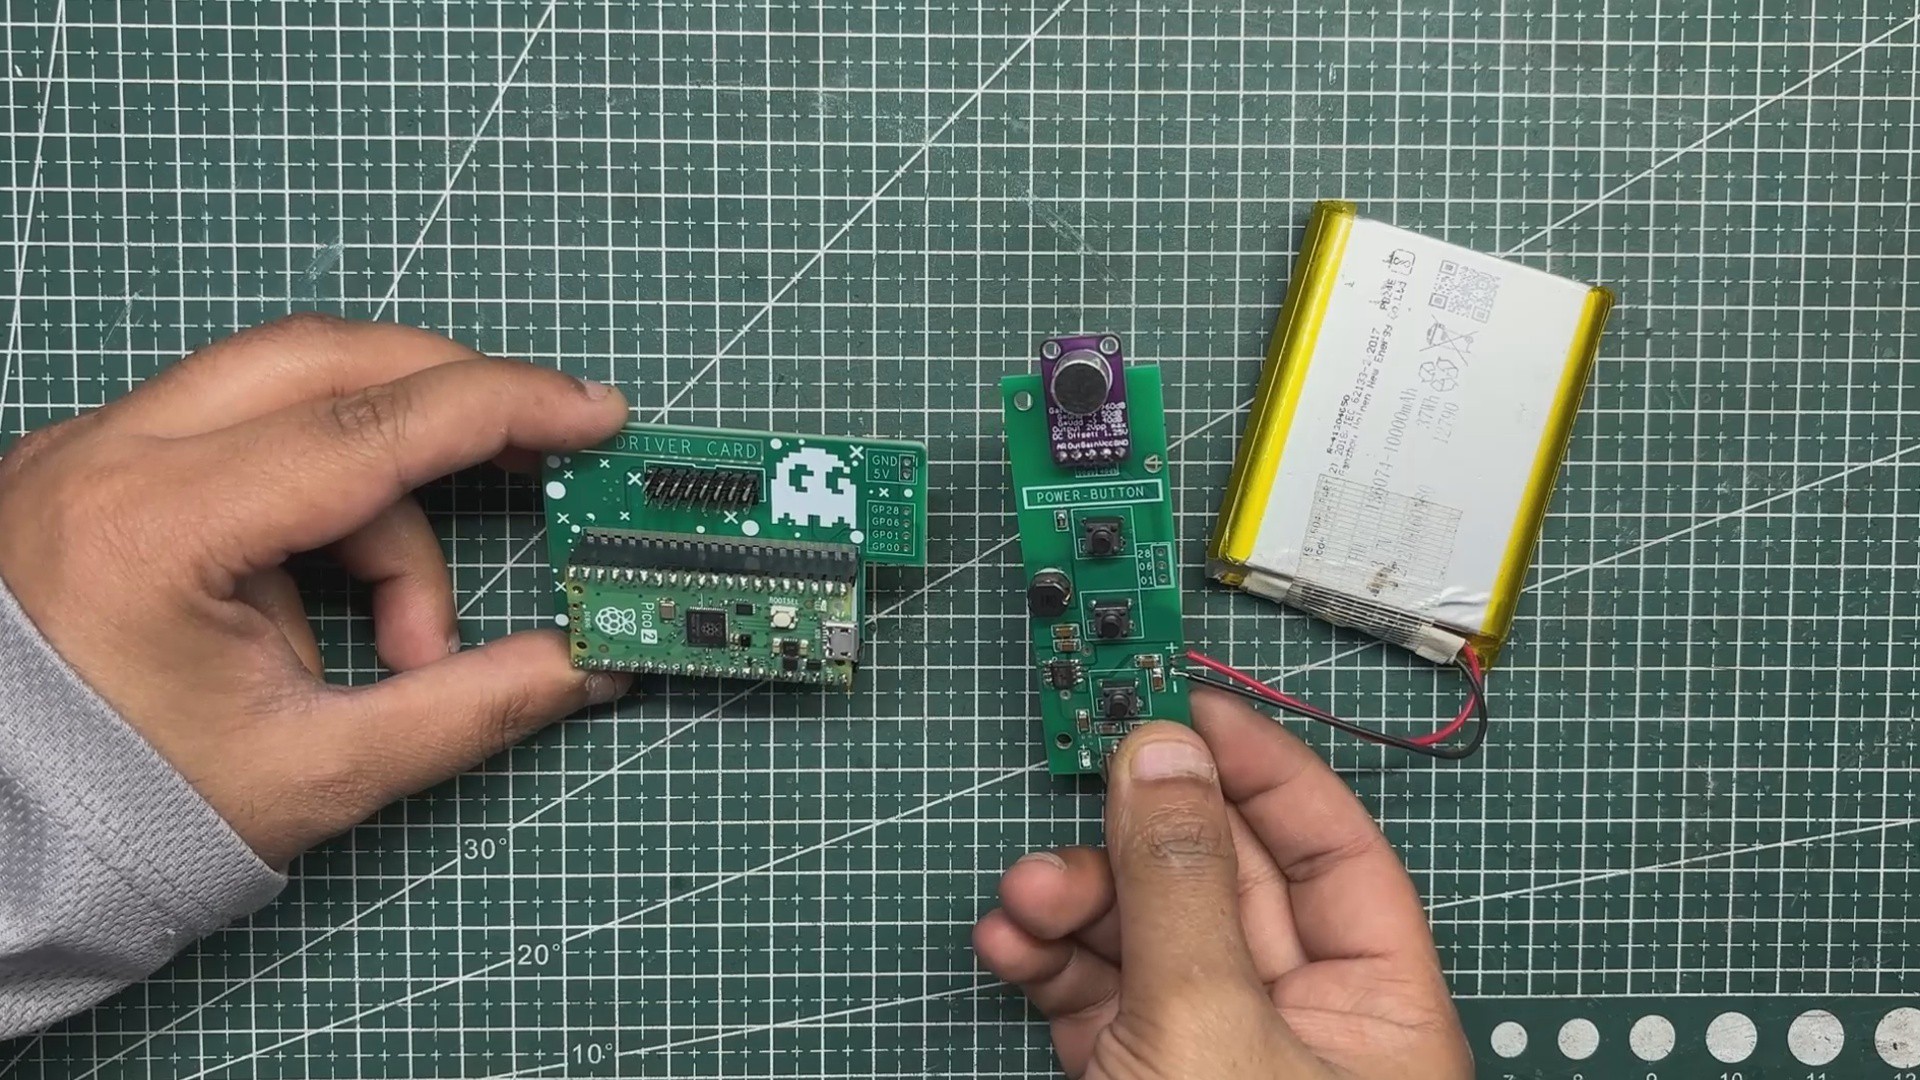
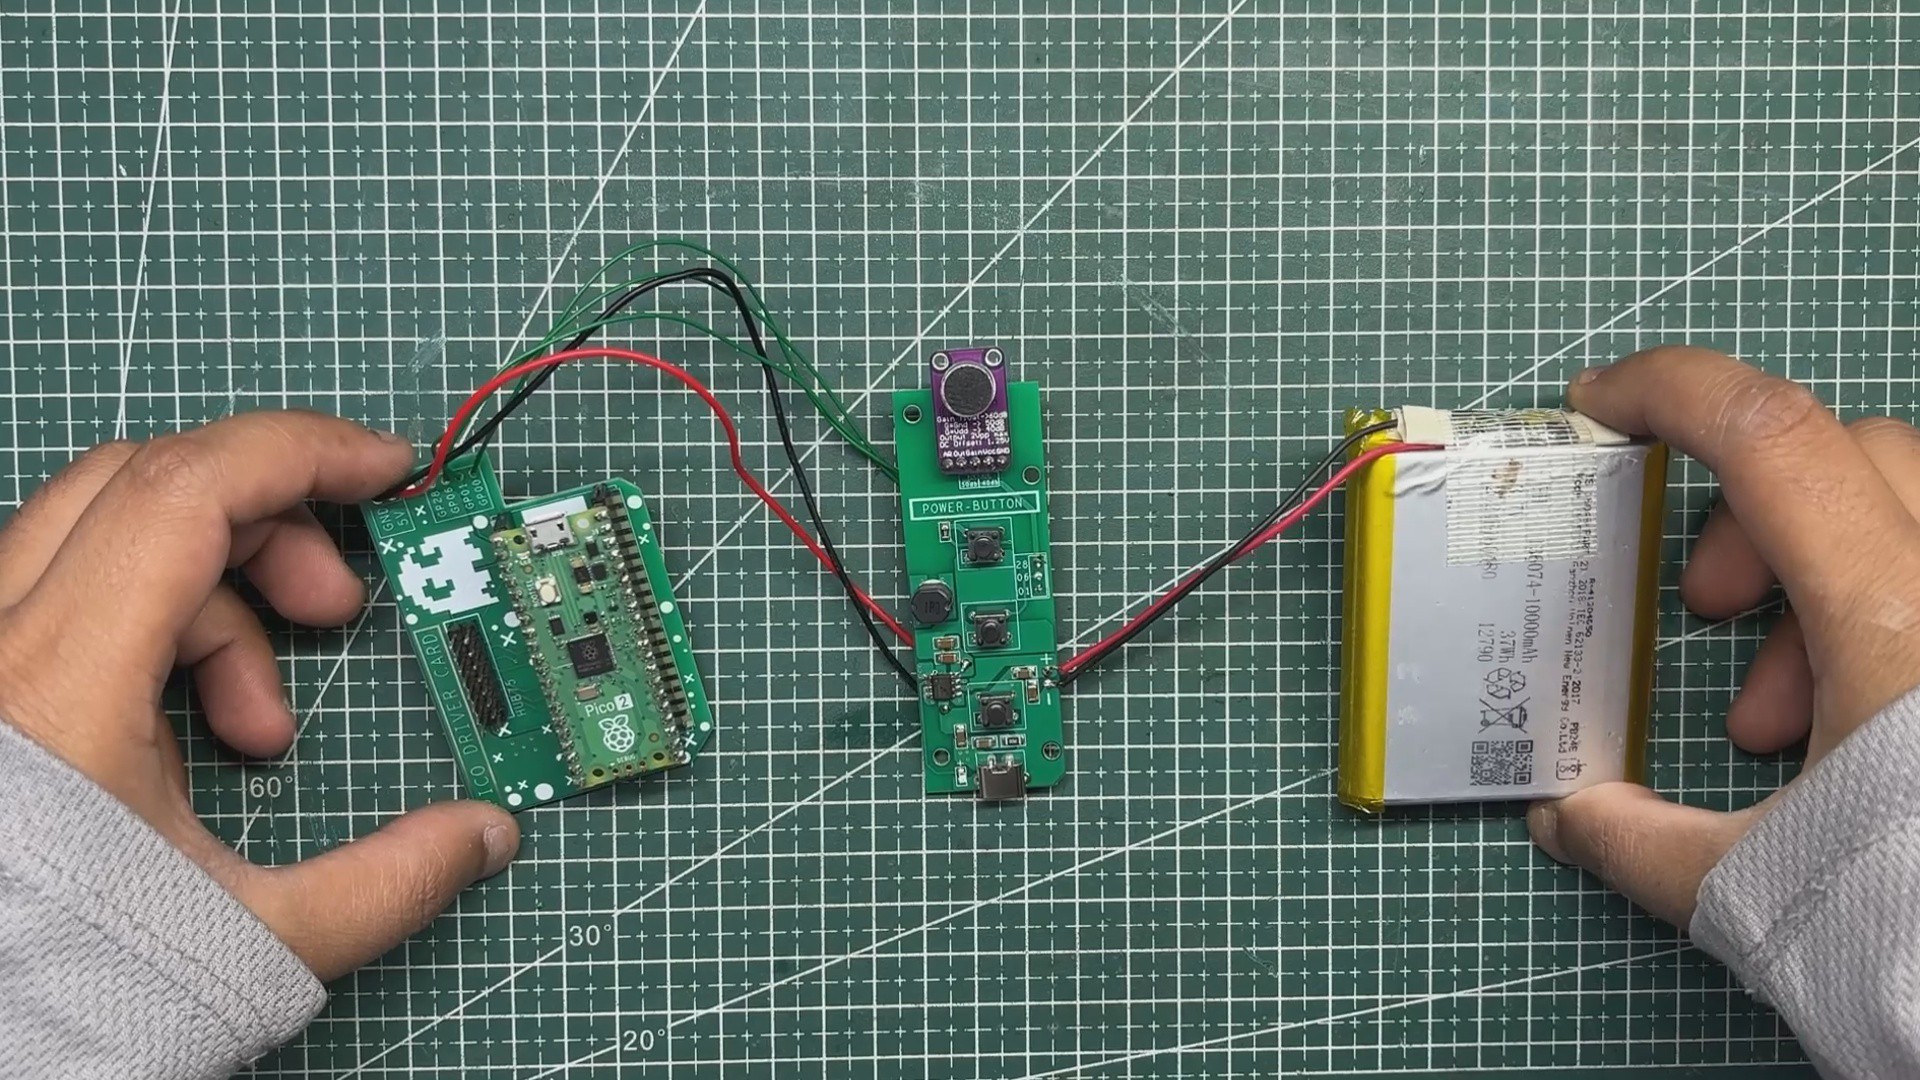
We built a custom enclosure that houses the RGB matrix along with a custom PCB featuring the Raspberry Pi Pico 2 and the MAX9814 microphone amplifier, paired with a dedicated power and button board. This enclosure lets us mount the device on a wall inside our workspace.
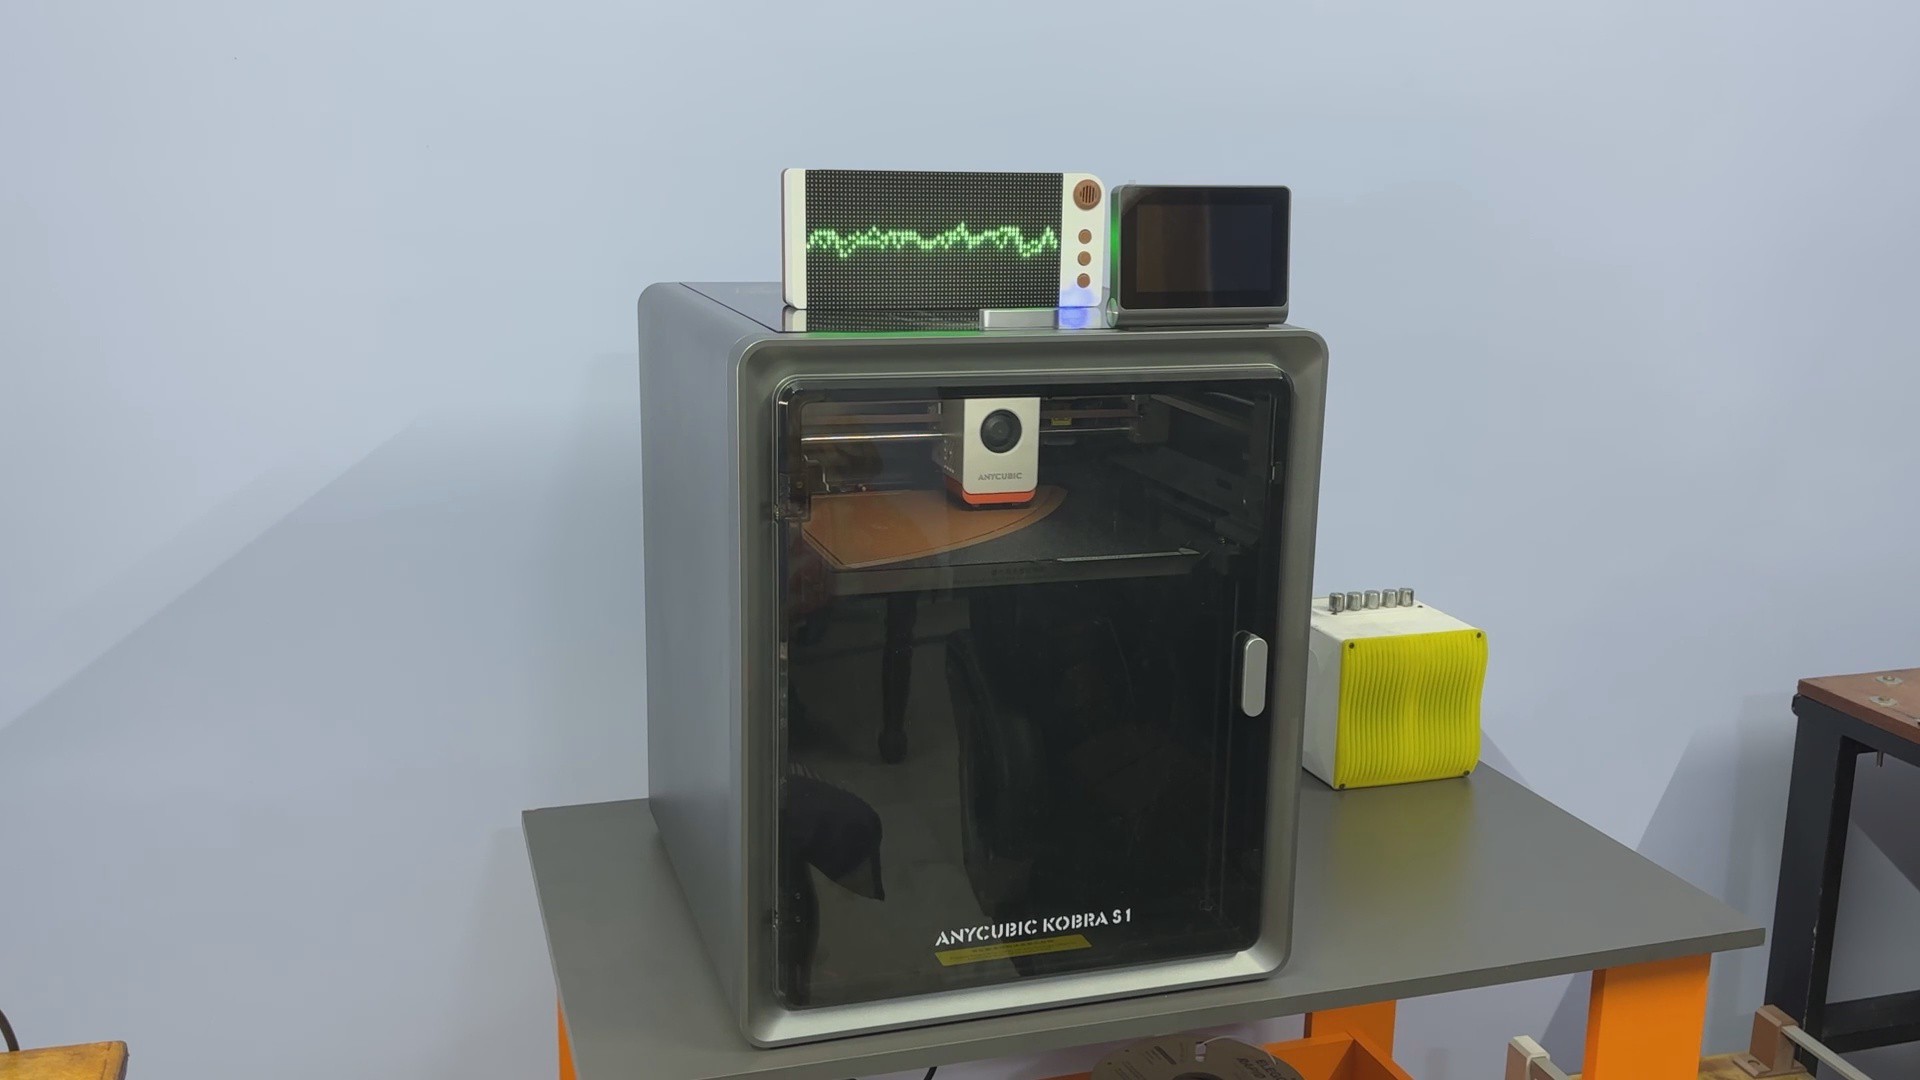
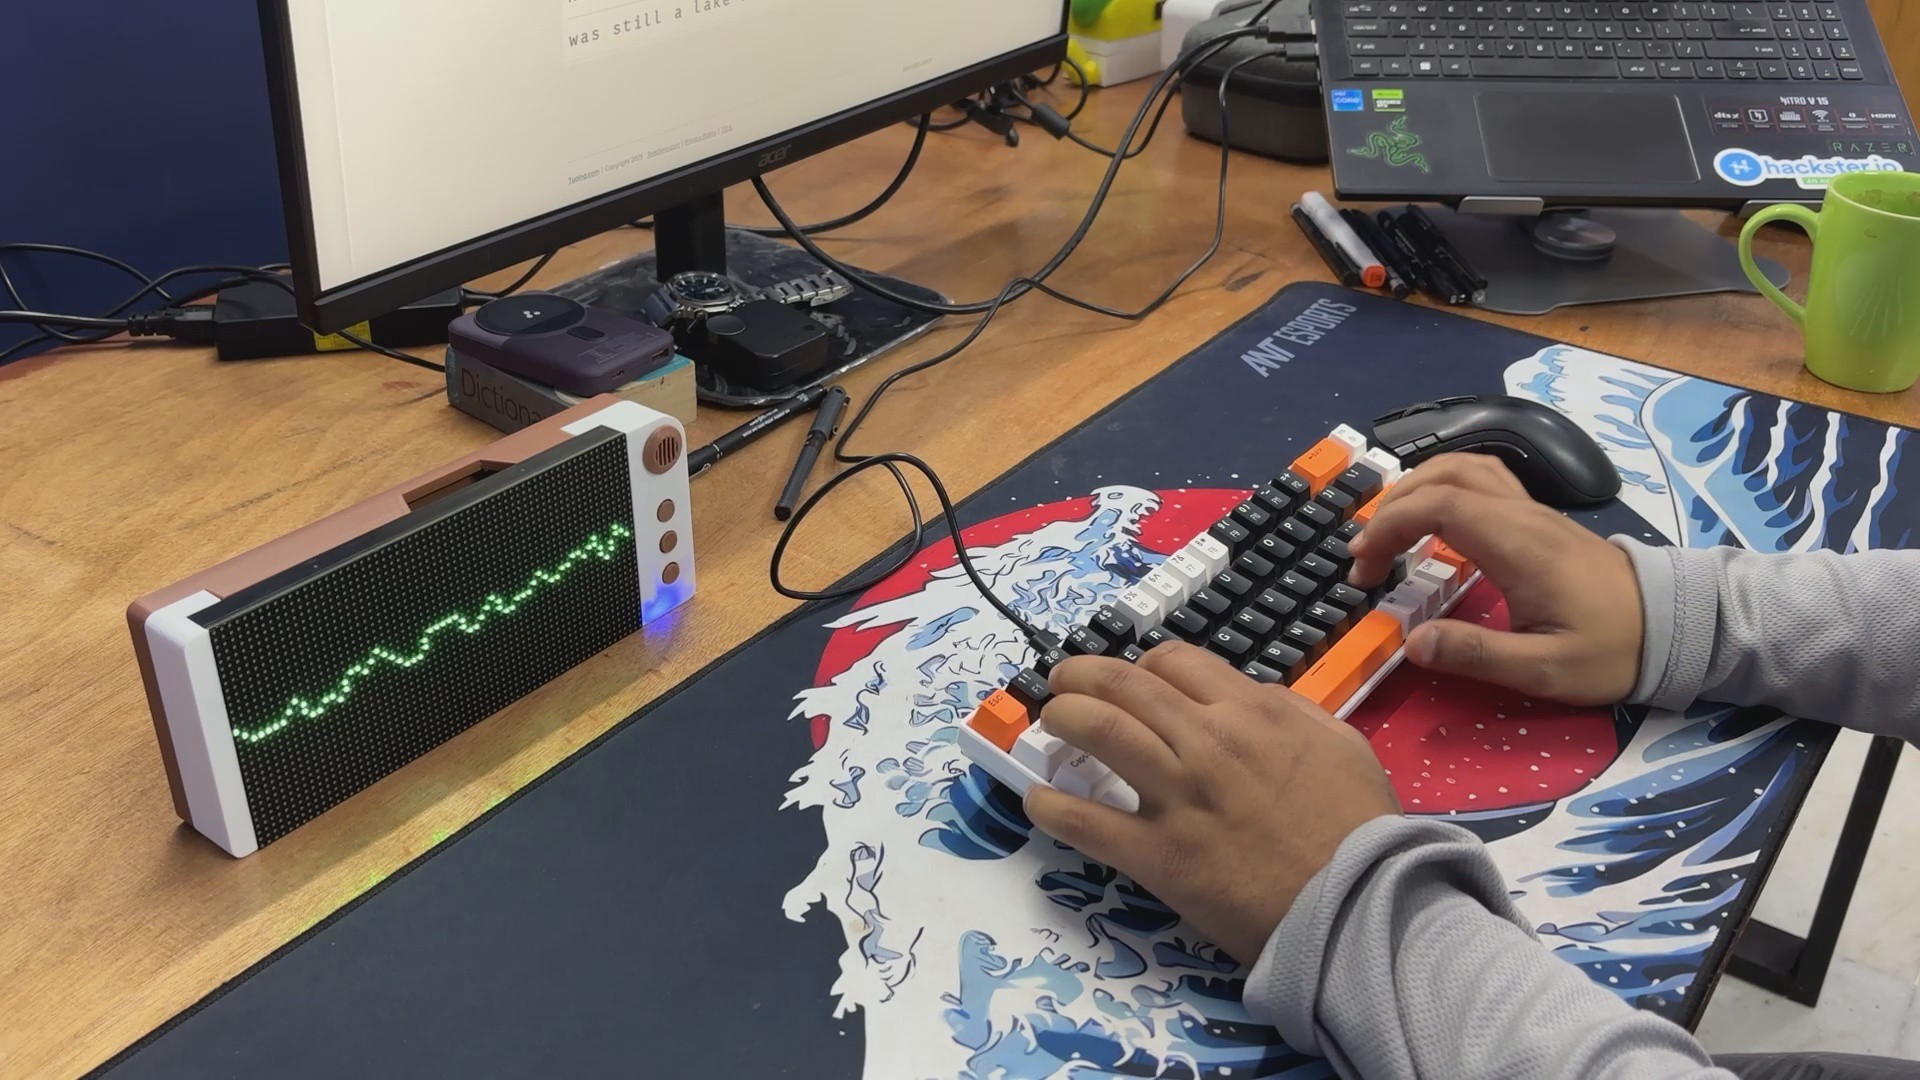
When the room is silent, WaveForm displays a calm, single center line. As soon as there’s activity—my 3D printer running, mechanical keyboard typing, or even general background music—the device picks up those sounds and transforms them into smooth, flowing waves.
The result is a visually engaging ambient display that looks great in the background while revealing the hidden sound patterns of our environment.
This article covers the complete build process of this project. Let's get started!
MATERIALS REQUIRED
These are the materials used in this project:
- Custom PCBs (provided by HQ NEXTPCB)
- Raspberry Pi PICO 2
- IP5306
- 10 uF Capacitor 1206 Package
- 10k Resistor 0805 Package
- 1uH Inductor
- RGB matrix HUB75 63x32
- MAX9814 Microphone module
- Indicator LED 0805 Package
- Push Buttons
- Type C Port
- 3D Printed Parts
UNDERSTANDING SOUND WAVES
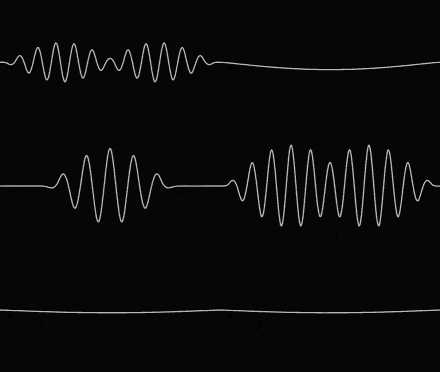
Sound is all around us, but we never actually see it. At its core, sound is simply a vibration traveling through the air—tiny, rapid changes in air pressure created whenever something moves, taps, clicks, or speaks. These pressure variations form a waveform: a repeating pattern of peaks and valleys that represent how the air is compressing and expanding over time.
Our ears interpret these changes instantly, but the waveform itself remains completely invisible.
Our project, WaveForm, is built around the idea of revealing this hidden pattern.
Using a MAX9814 microphone amplifier, the Raspberry Pi Pico 2 continuously measures the incoming sound pressure and converts it into digital readings hundreds of times per second. In our code, each of these readings becomes part of a sequence of numbers—the raw shape of the sound wave.
Here’s the exact moment the waveform is captured: (I will be explaining more about code in later later section of the project.)
for (int i = 0; i < OVERSAMP; i++) {
int v = analogRead(MIC_PIN);   // read sound level from mic
samples[i] = (float)v;         // store it in the buffer
sum += v;
if (v < vmin) vmin = v;
if (v > vmax) vmax = v;
delayMicroseconds(150);
}
Each number represents a single instant of air pressure. By processing this stream of data in real time, we can calculate the sound’s amplitude (loudness), filter out background noise, and map every moment of the waveform to a corresponding point on the display.
These points are then drawn as a smooth, scrolling curve across the HUB75 RGB matrix. Quiet sounds create gentle ripples near the center of the screen, while louder sounds stretch the waveform outward and shift its color toward red. The result is a living visualization of something we normally experience only with our ears.
3D DESIGN
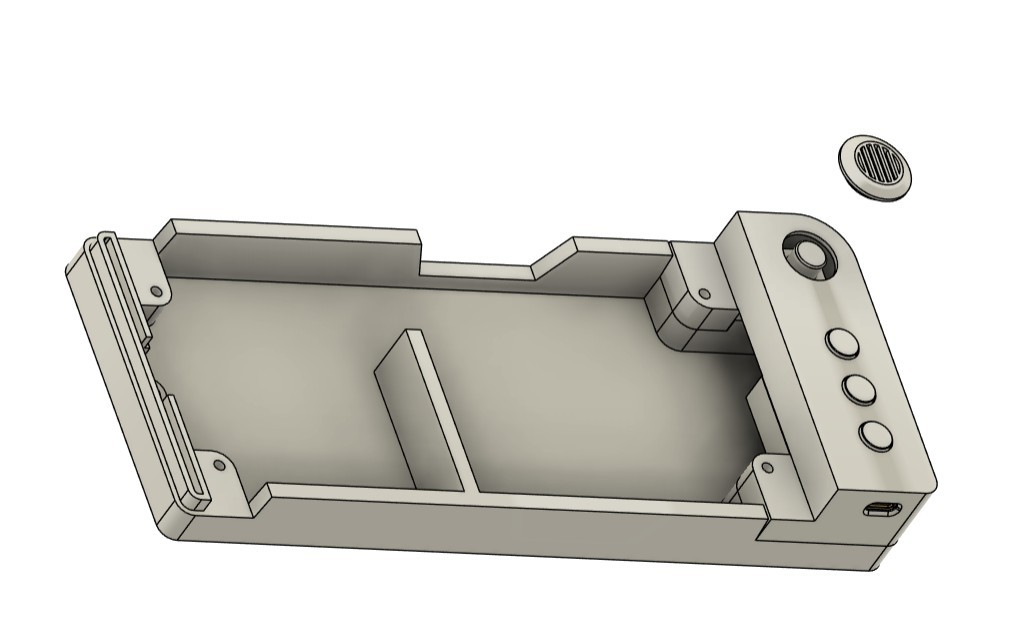
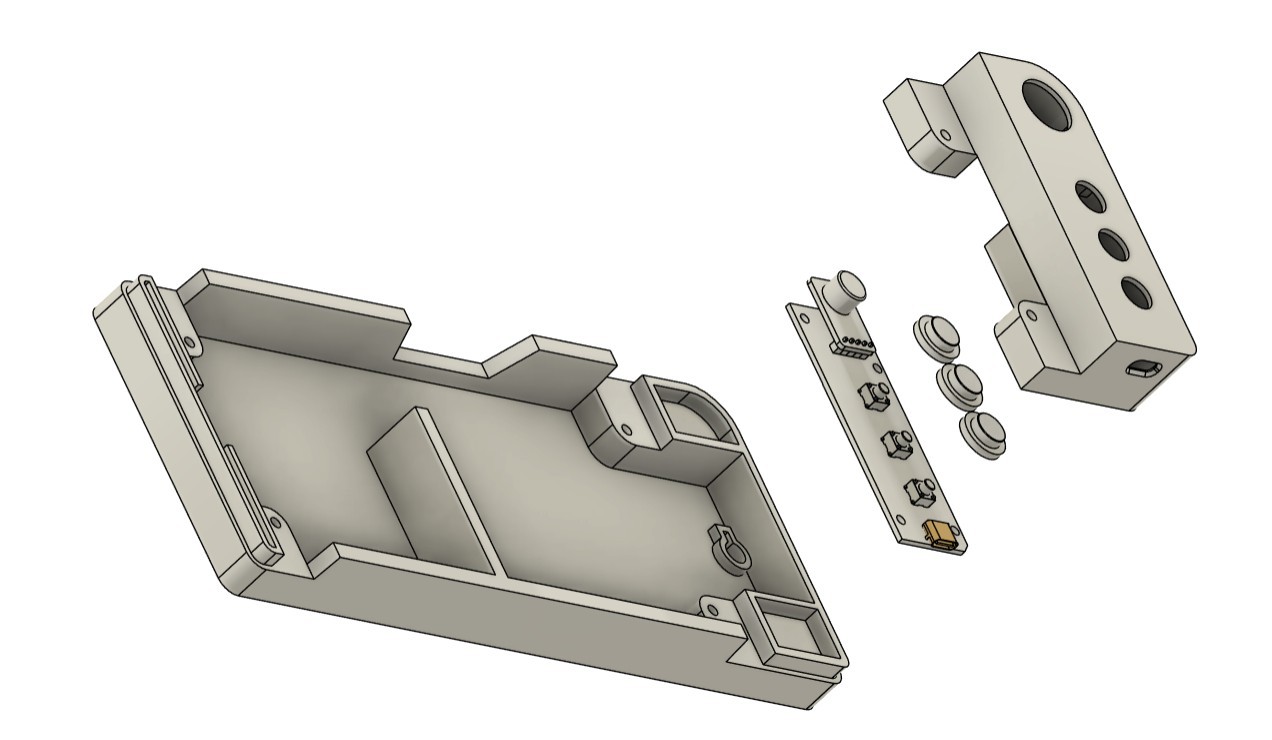
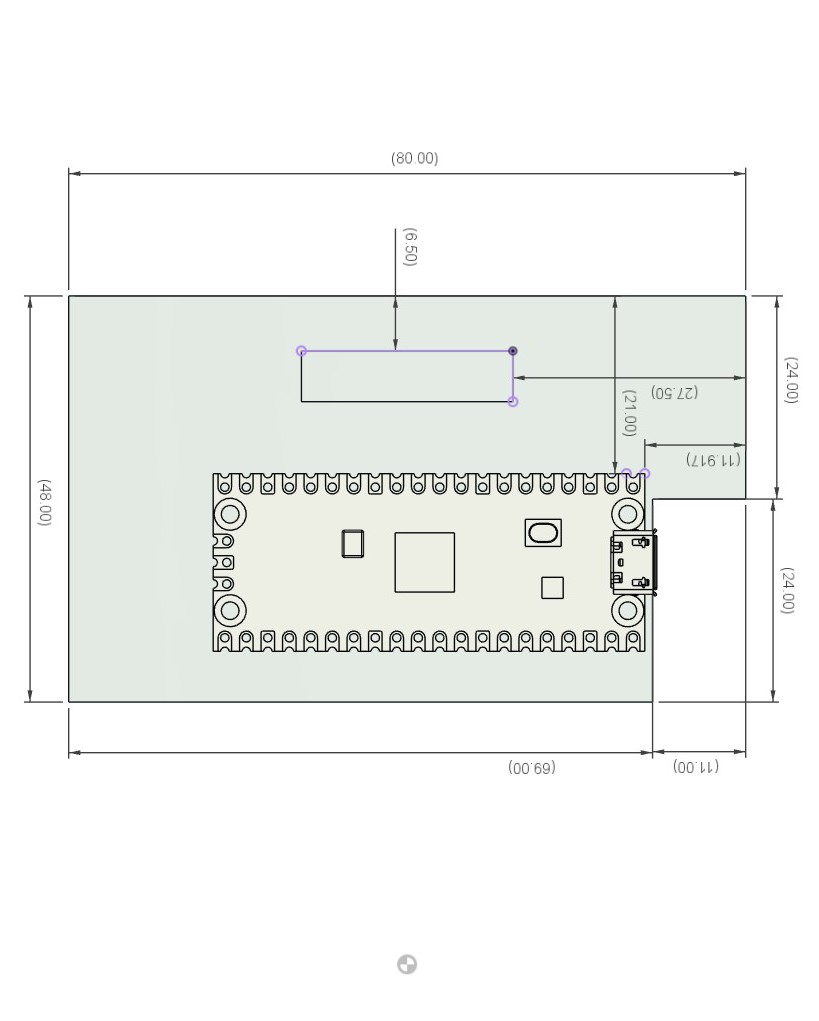
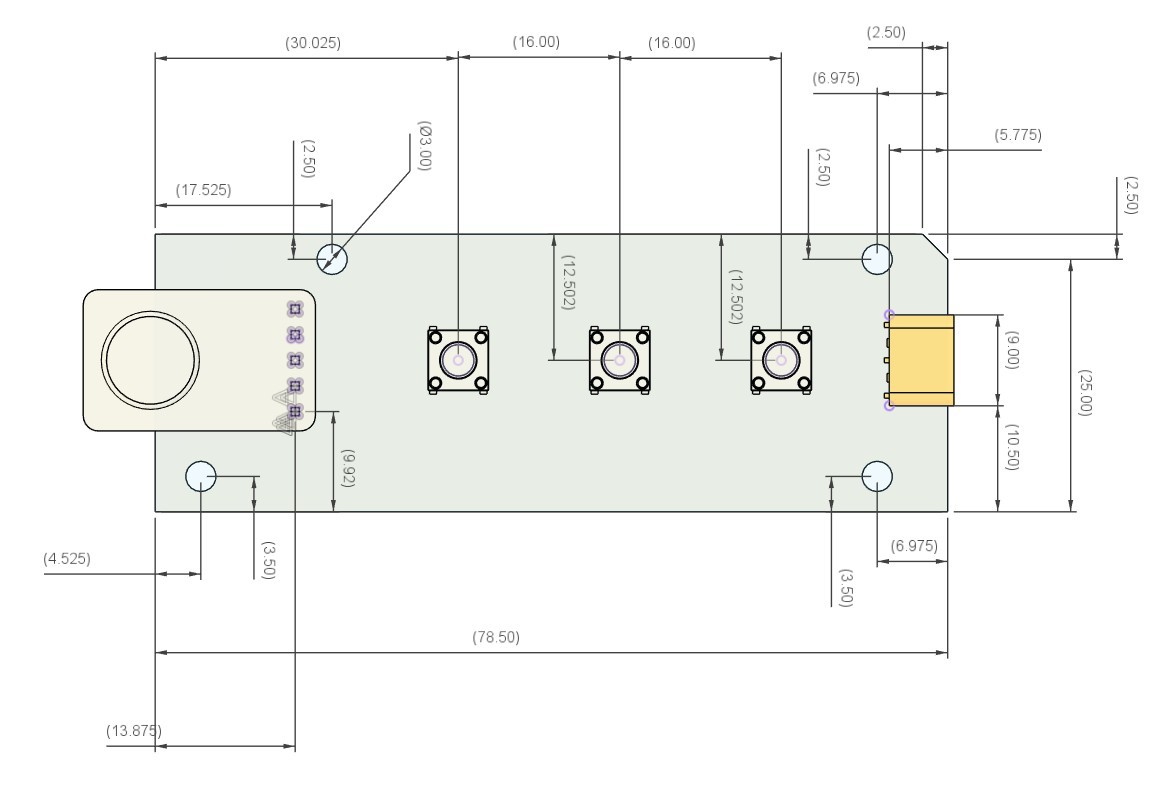
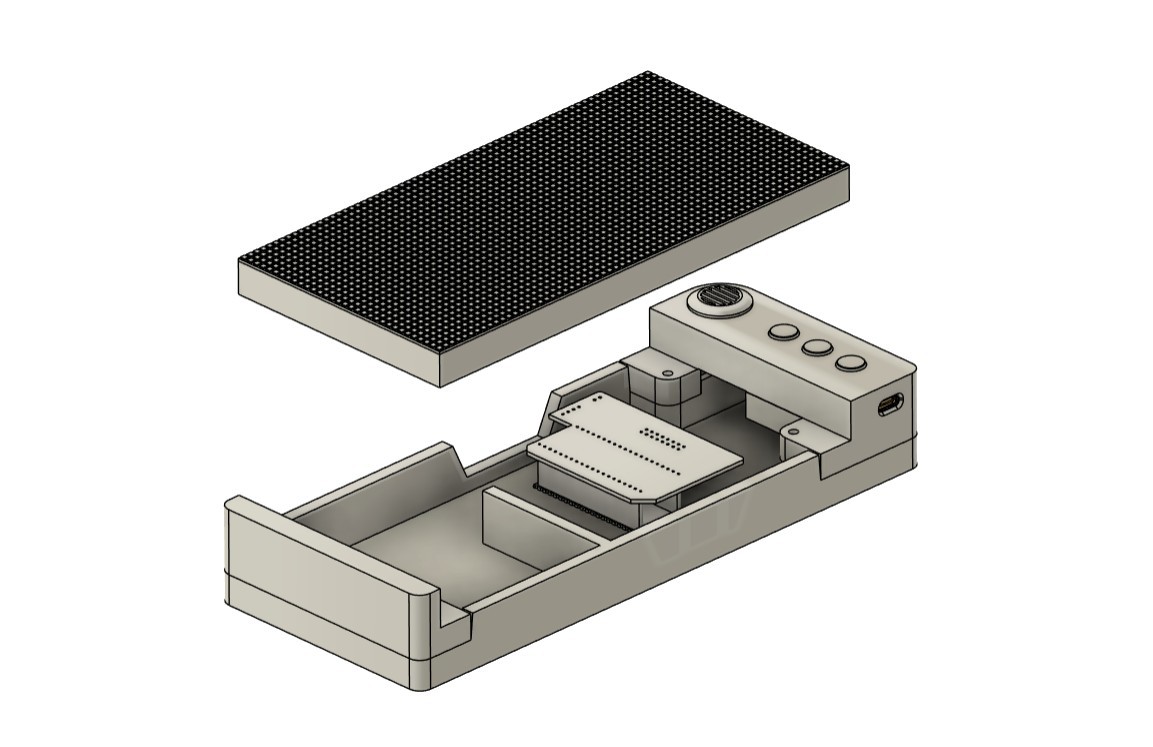
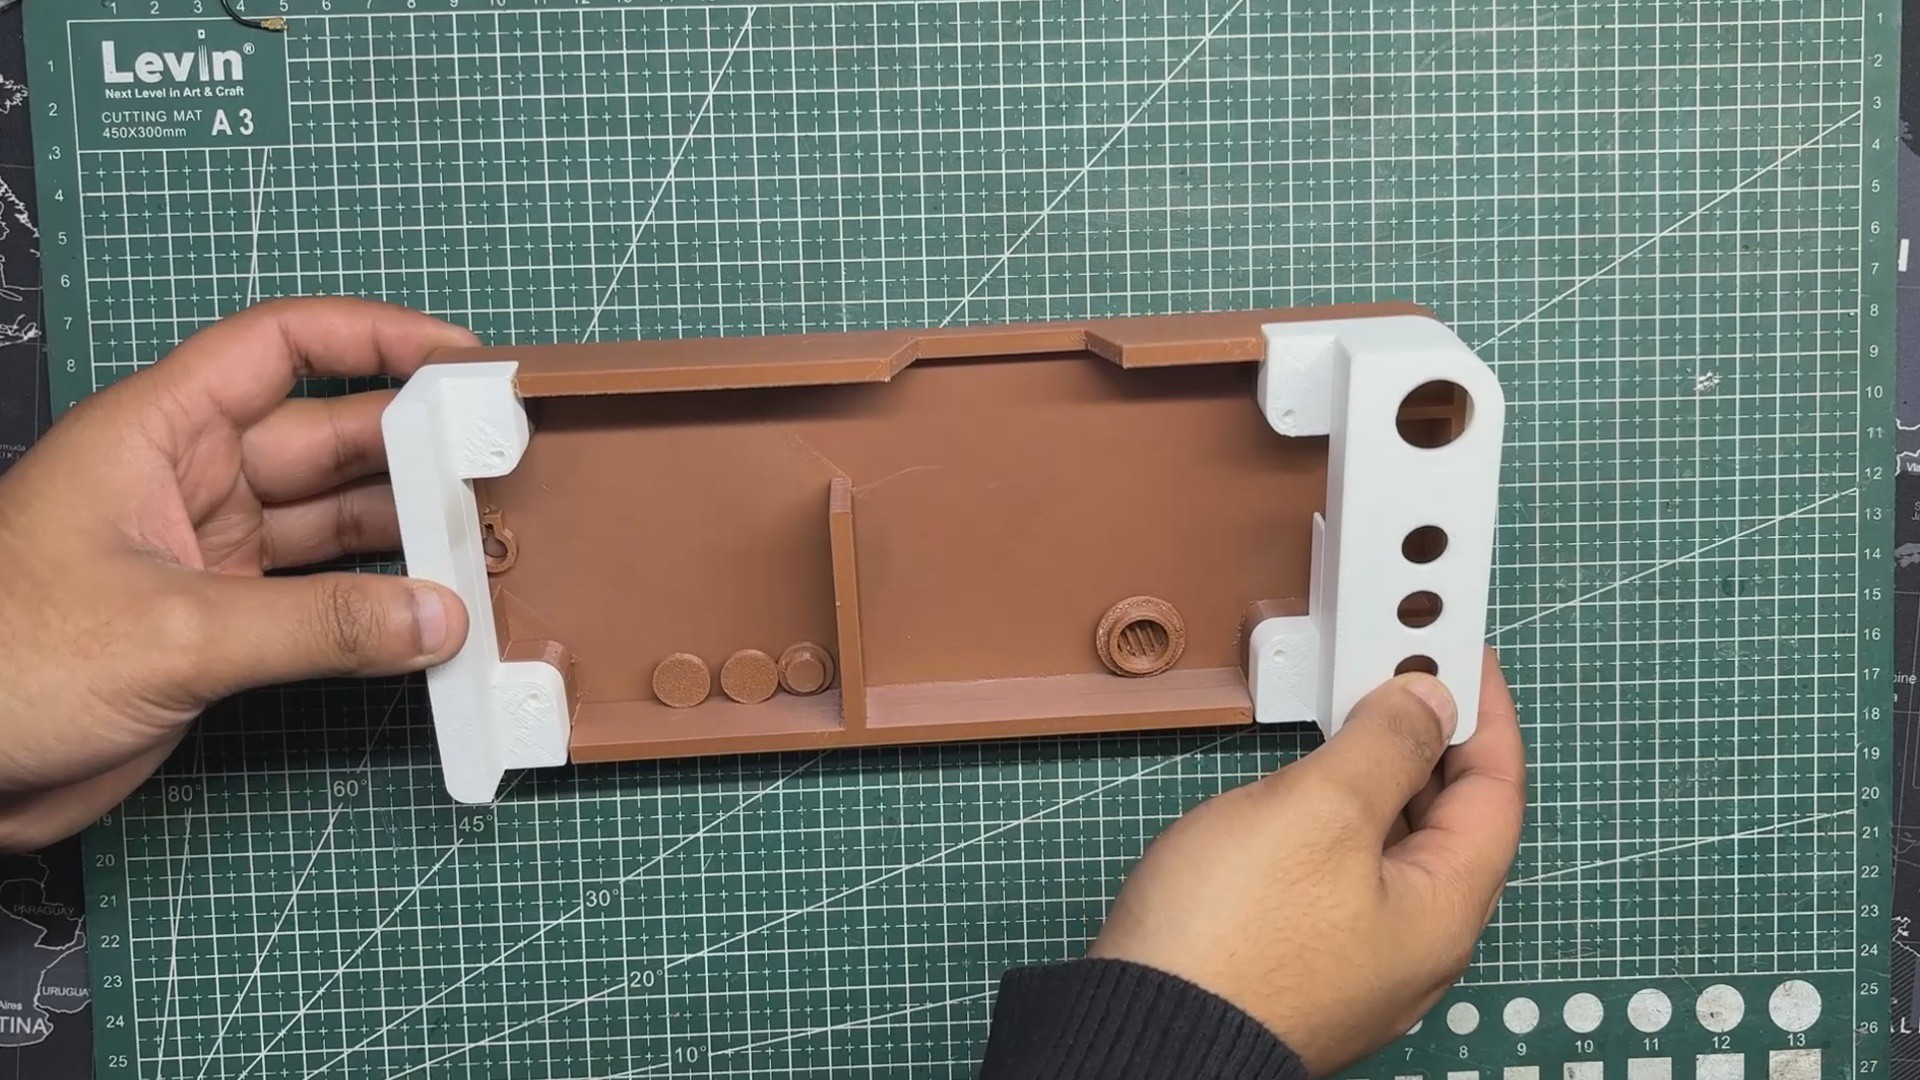
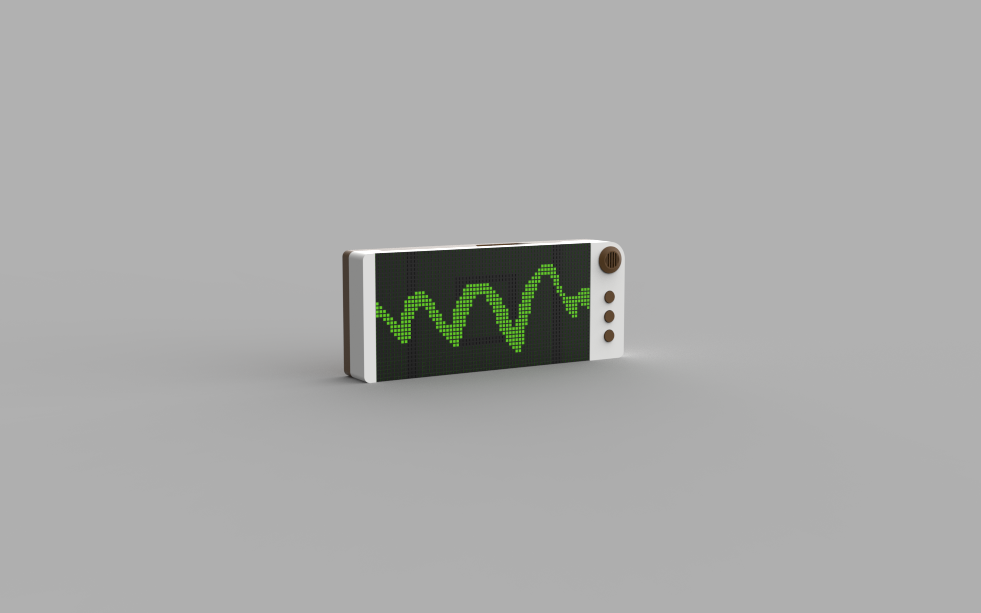
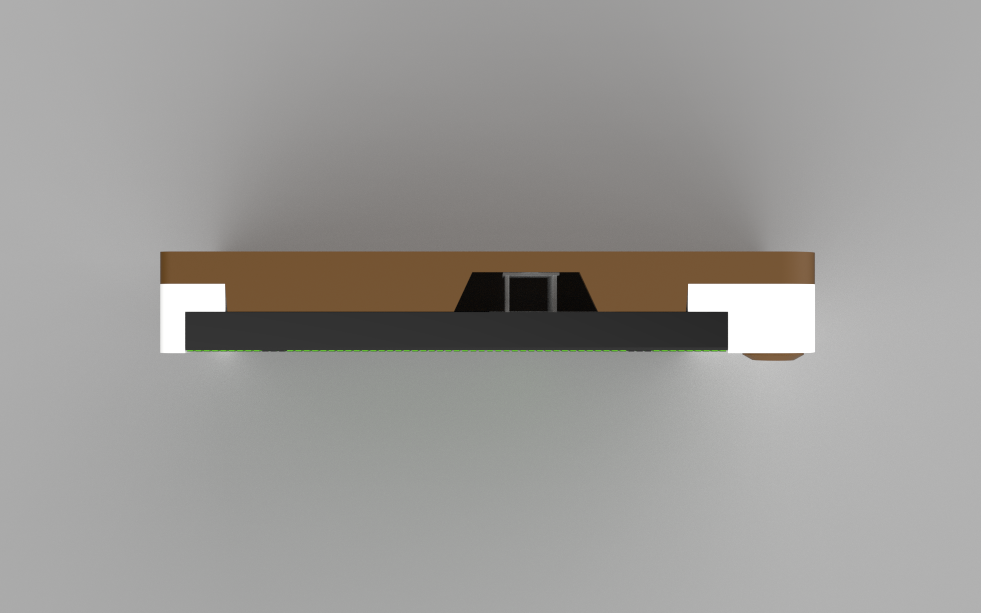
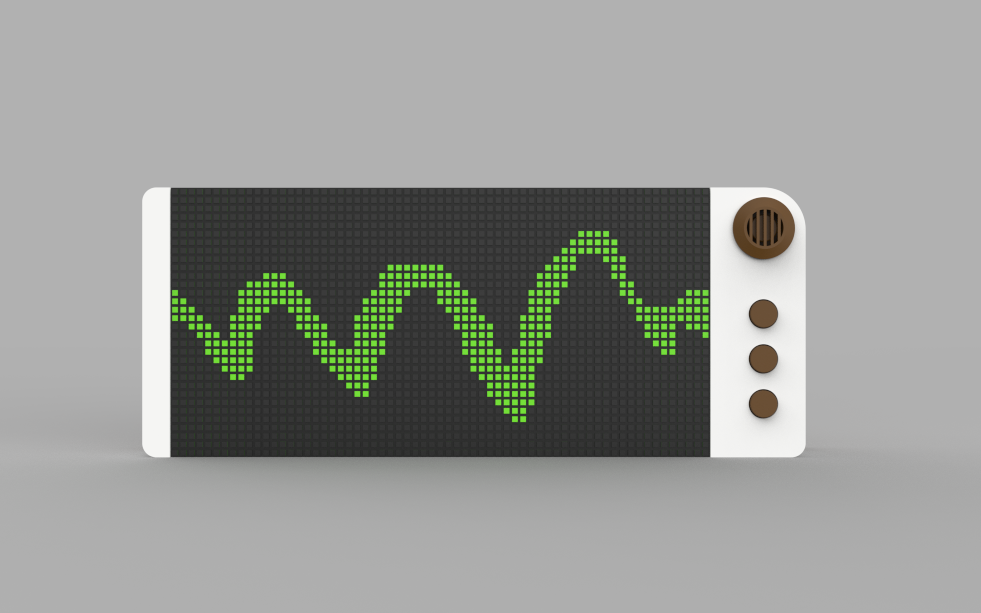
Before diving into the PCB design process, we first prepared a complete 3D design of the device. This began by importing models of the LED matrix, the Pico 2, the MAX9814 microphone module, and the push buttons. We then rearranged them to form an enclosure layout: the matrix display sits in the center, and on the right side we created a custom compartment that holds three push buttons aligned in a row. Above the buttons, we placed the microphone module.
The idea was to keep all interactive elements—buttons, microphone, switch, and USB port—on one side. Because the internal space was quite limited, we positioned the Pico 2 driver board and the battery on the backside of the display.
The enclosure was split into two main parts: a left and a right side. The right side houses the switch, microphone, and power-management board. The left...
Read more »