 mircemk
Shortwave Propagation is the way radio waves in the 3 to 30 MHz range travel from point A to point B, using the ionosphere as a mirror. The ionosphere is a layer of the atmosphere full of charged particles (ions). The quality of the signal depends on how "dense" this layer is.
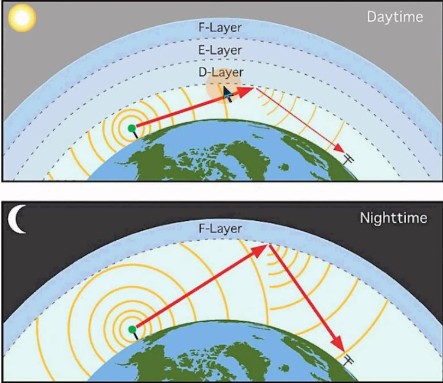
This is affected by several factors such as Solar activity (the most important factor), time of day (day or night), seasons, and others. In this project I will present you a very simple way to measure the current conditions of the ionosphere, and therefore the conditions for receiving shortwave signals.
This is an extremely useful tool for SW listeners because at any moment with one glance at the instrument they know what quality of reception they can expect at a given moment. Basically I'm using an old circuit diagram from Elektor magazine from the 1990s.
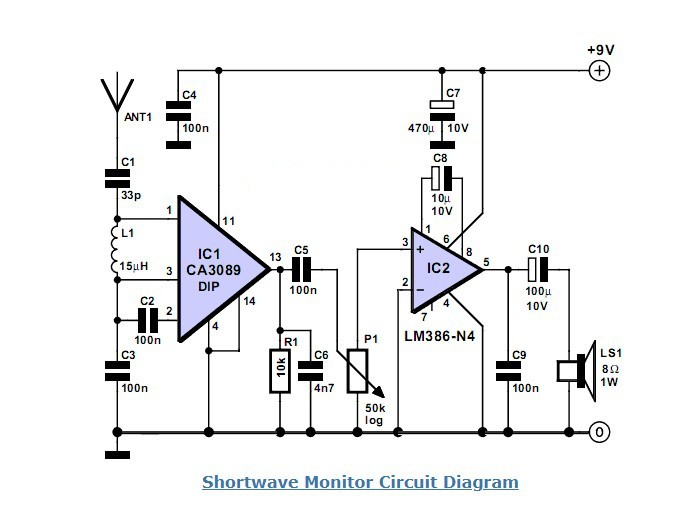
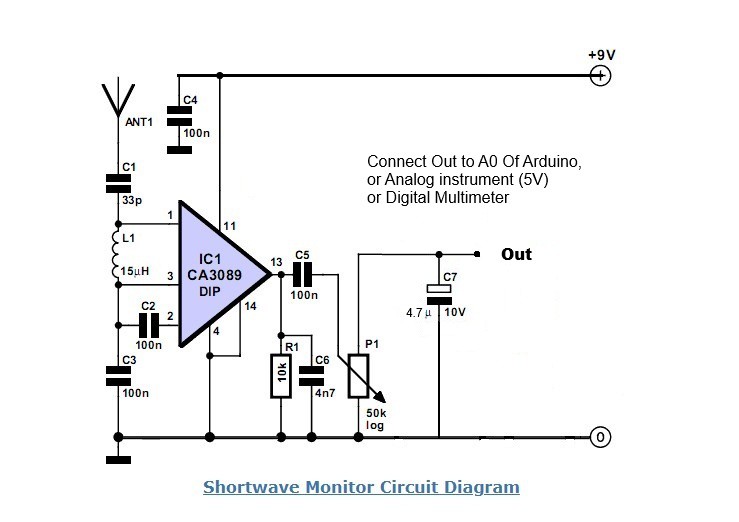
I modified it by removing the audio section from the original schematic, and adapting the output of the CA3089 to drive a standard multimeter, analog instrument, or Arduino microcontroller with a suitable display to show the result. This is not a classic radio receiver, but a frequency-non-selective monitor.
This project is sponsored by PCBWay. From April 15 to June 15, 2026, PCBWay is organizing KiCad PCB Design Contest on the occasion of the launch of KiCad 10 with enhanced features and improved workflows. There are three grand prizes of $500 cash + a Raspberry Pi 5, as well as a Participation Award, a Raspberry Pi Pico 2. Review the official rules and selection criteria, submit your innovative design, and you could be our next winner. PCBWayand KiCad look forward to seeing your creativity in action!

The CA3089 IC is the heart of the device. Although it is designed as an FM intermediate frequency amplifier, here is used its broadband amplification capability. It “catches” all signals in a certain range (about 1–30 MHz) at once. Instead of tuning to a single station, it measures the total level of RF energy in the air. This makes it ideal for measuring signal propagation in the SW range. The CA3089 has a built-in RSSI (Received Signal Strength Indicator) circuit and it is pin 13 that also provides a logarithmic output, which is perfect for a propagation monitor because you will see both the weakest and strongest changes on the scale. I connected an electrolytic capacitor in parallel with the voltage output in order to avoid frequent and sudden changes (jumps and drops) in the voltage, so that the value is relatively constant at a given moment.
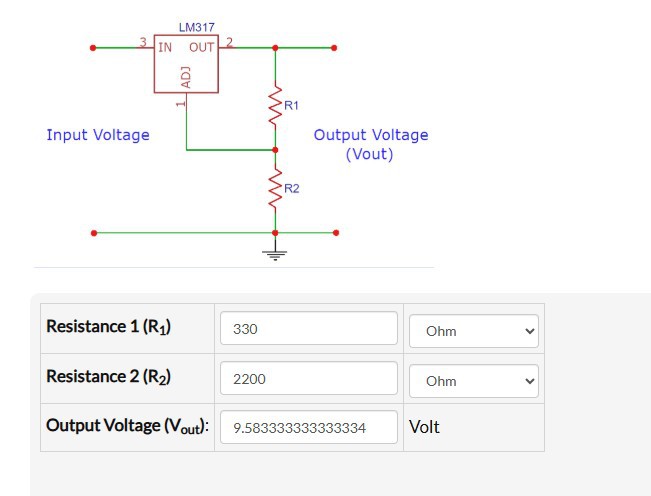
The supply voltage should be constant because a lower supply voltage would give a lower value of the output voltage. That's why I use a voltage stabilizer made with LM317, and it's simpler to use LM7809 Linear Stabilizer (I didn't have one at the moment).
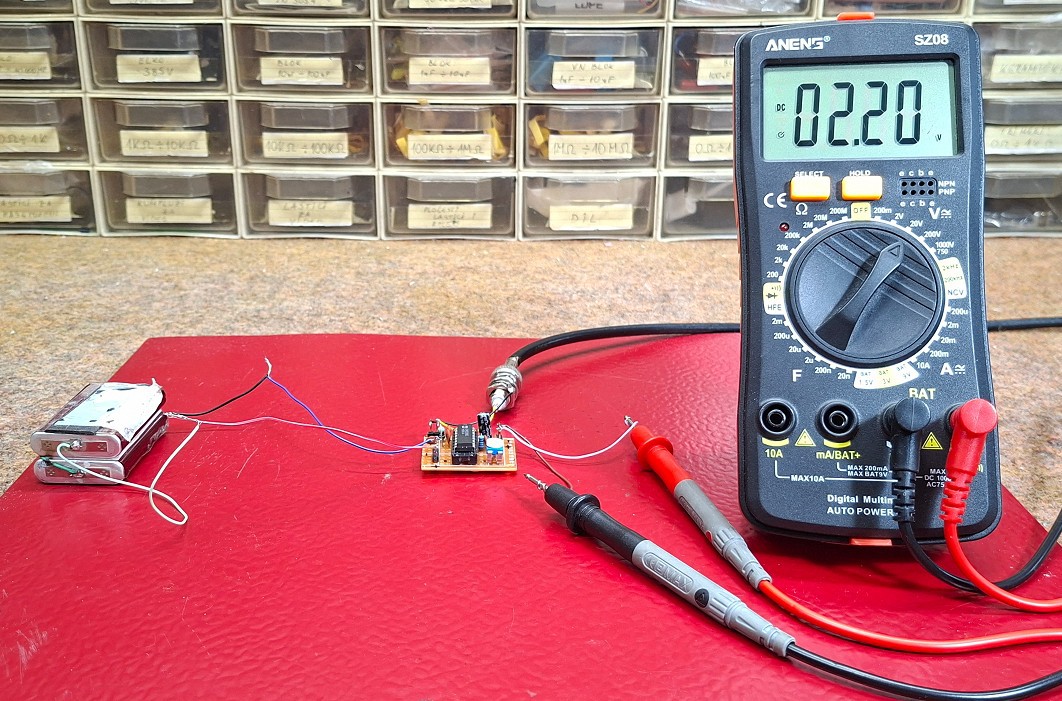
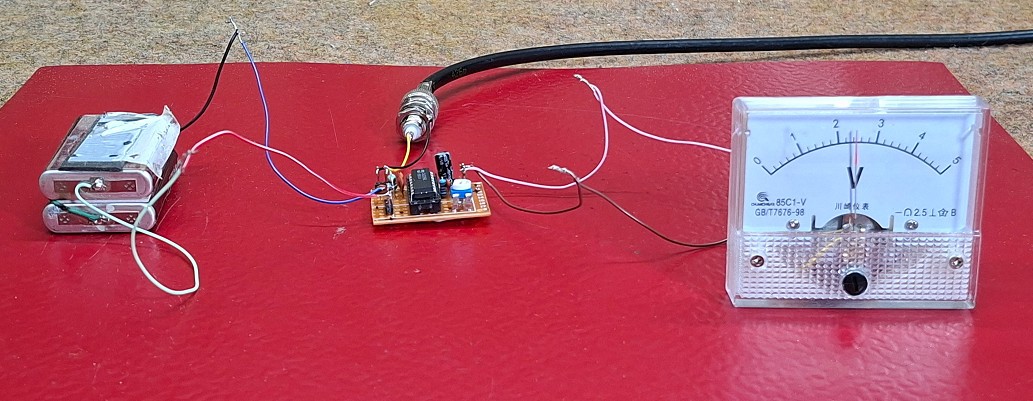
At the beginning, I tested with a digital multimeter and an analog instrument (5V voltmeter).
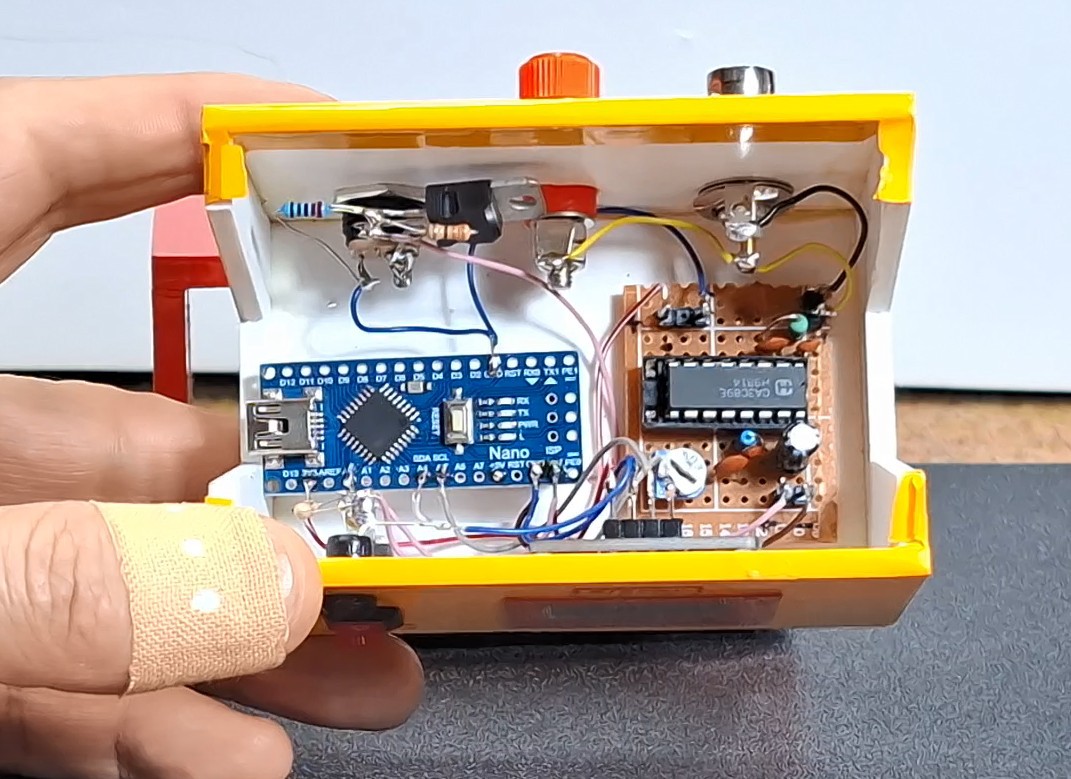
Then I decided to make a small Arduino assembly with an OLED display, and to install the complete device in a suitable housing. For even more precise information, in a more advanced version of this device we can set up two input circuits with different input coils and capacitors for day and night signal propagation, or for a certain band.
The device is very simple to make and consists of one IC (CA3089), several passive elements (resistors, capacitors and inductance) and an output unit that displays the result, which can be a small analog instrument, a multimeter, or as in my case, an OLED display with Arduino.
Now a few words about the setup. For accurate results, it is advisable to always use the same antenna, and it can be a regular wire with a length of one to several meters. Without an antenna connected, the output voltage is low and it is about 0.6V. If we touch the input with our finger, this voltage should increase (then there is a weak RF signal reception, and this is a sign that the device is functioning normally). Now...
Read more »


 Evangelos Petrongonas
Pretty cool! I'd go for a retro way by using an analog VU. Maybe an ESP32 could provide logging as well.