 Mitsuru Yamada
1. Configuration of the controller system
Figure 1 shows the setup consisting of the Model Railway Controller MRC-2, the track layout, and the PERSEUS-9. The MRC-2 is located in the upper right corner of Fig. 1, and to its left is the homemade computer, the PERSEUS-9. Unless operating in automatic mode, the PERSEUS-9 is not required; the locomotive and turnouts can be controlled via the MRC-2’s control panel.
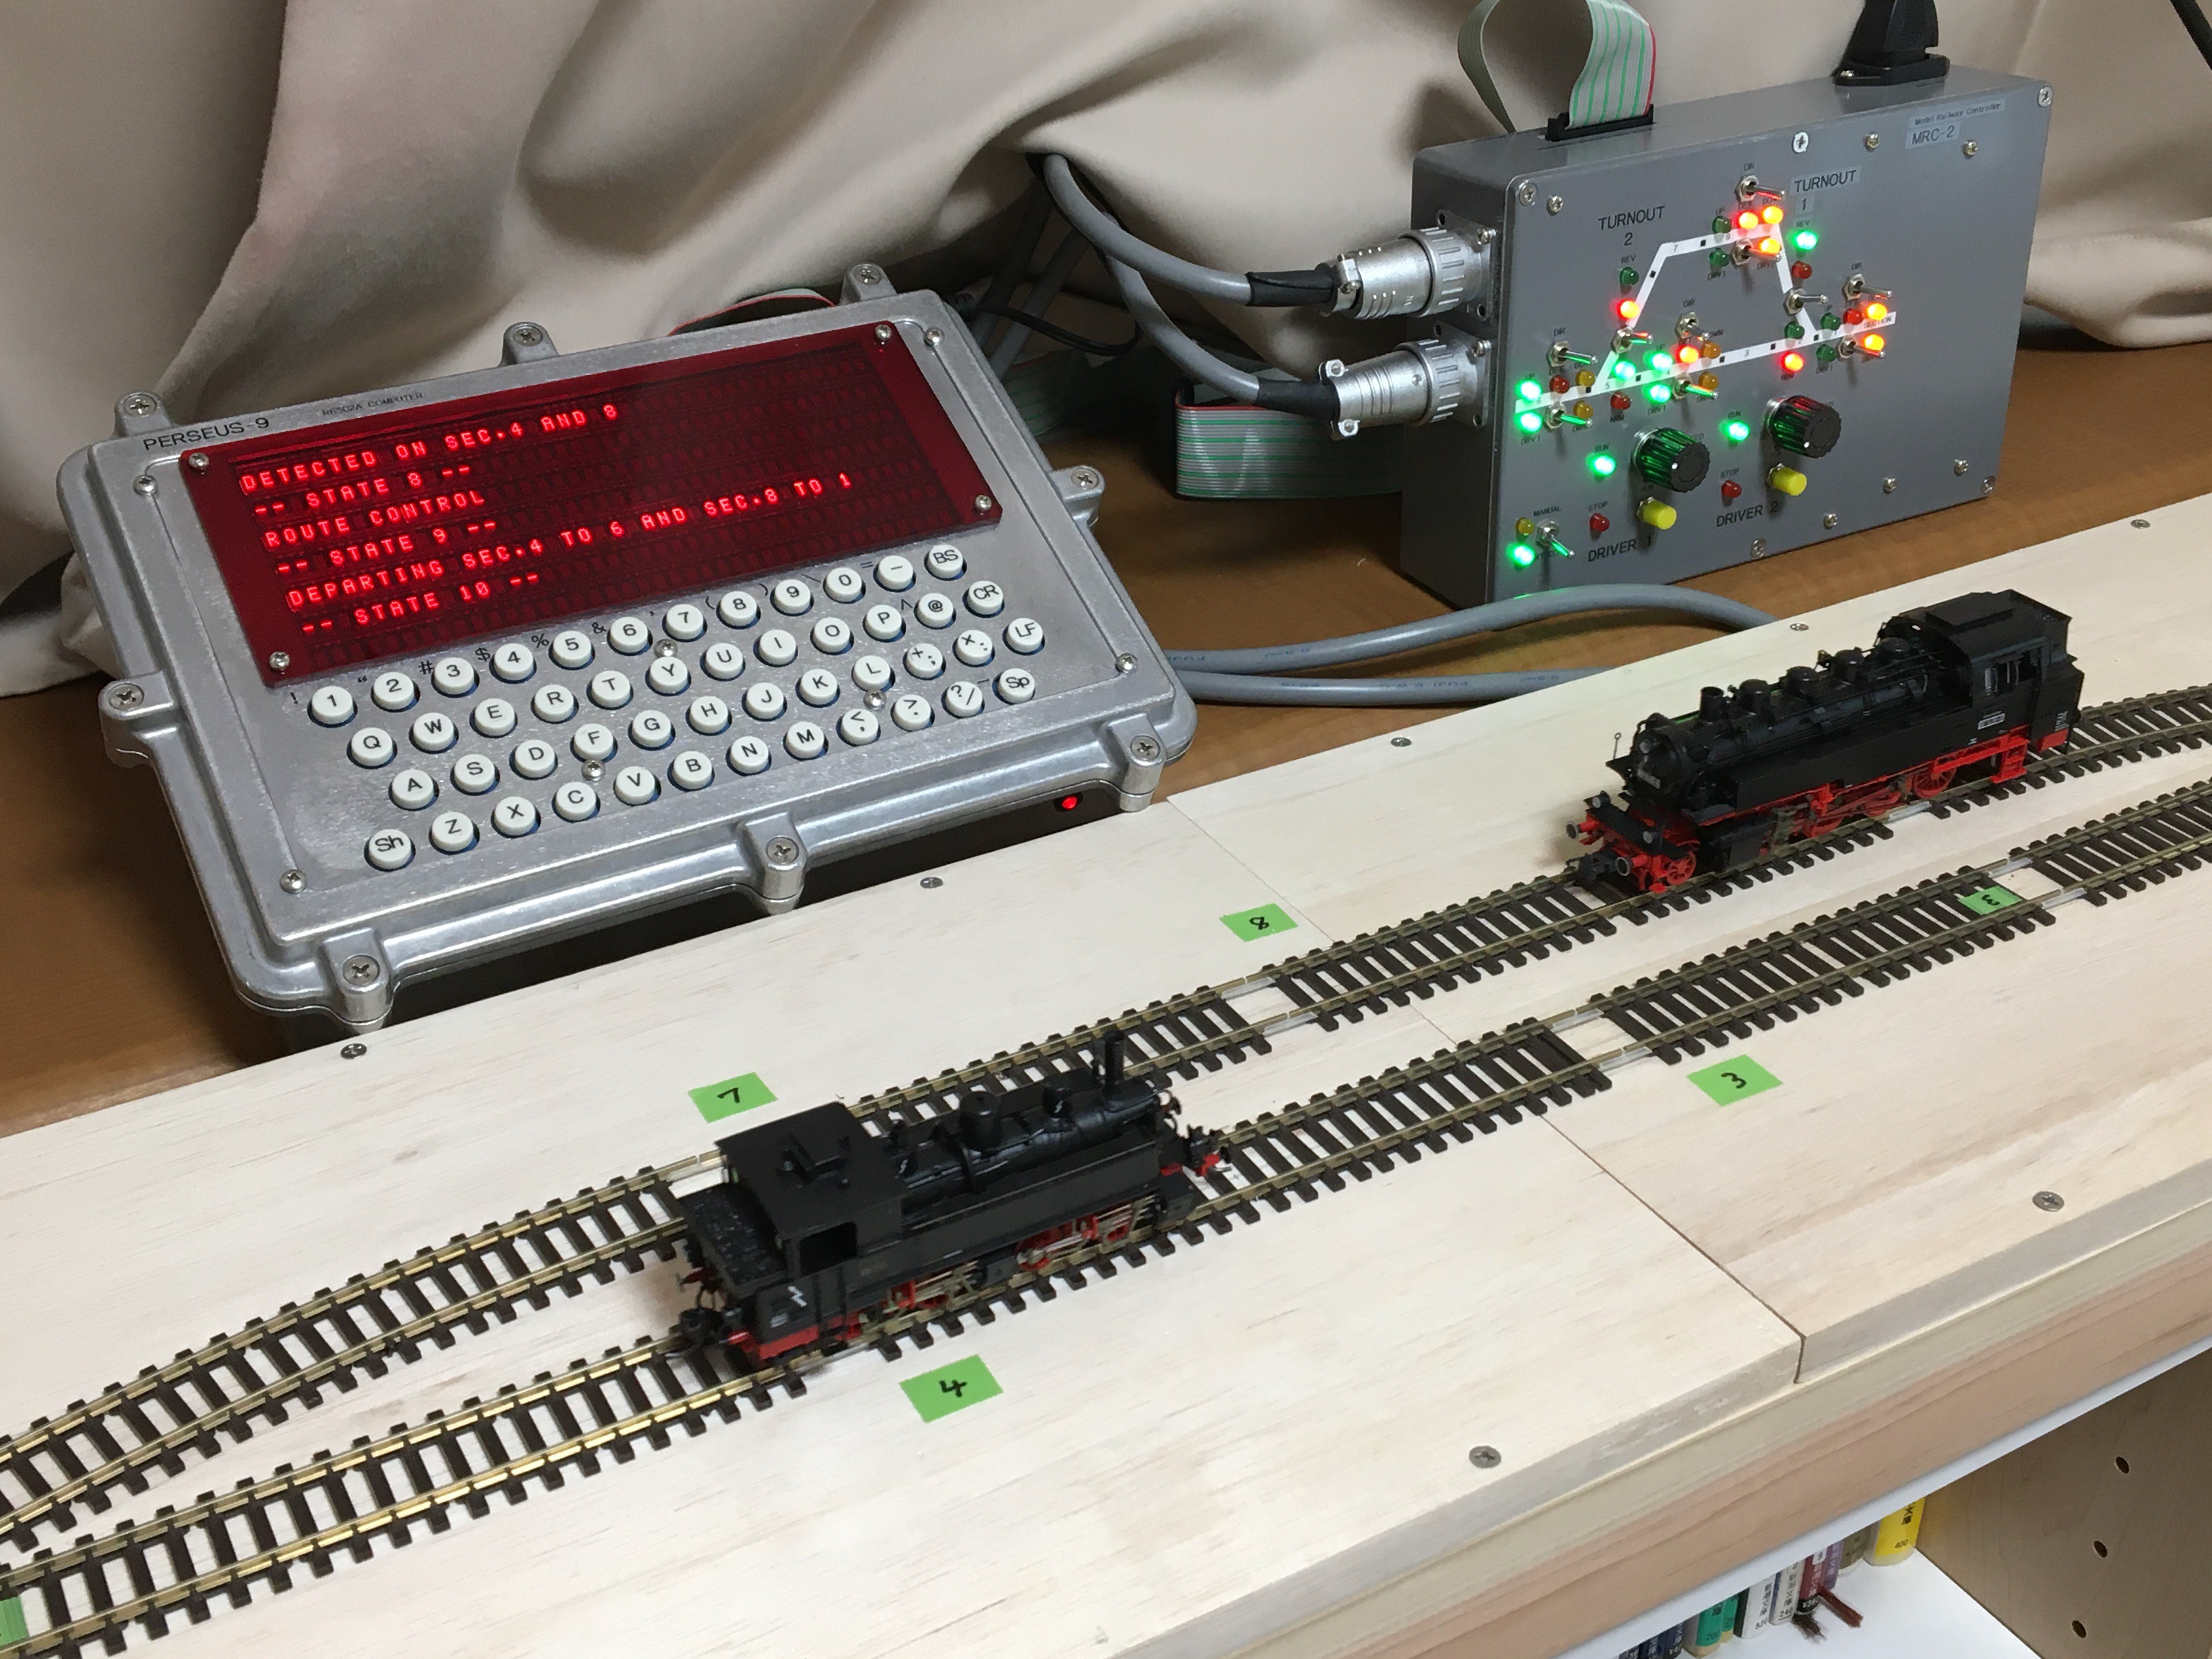
Fig. 1 Model Railway Controller MRC-2, layout track and PERSEUS-9 the computer.
This configuration is shown in Fig. 2. As shown in Fig. 2, the track layout to be controlled is assumed to be a very simple configuration that allows for train passing siding on a single track. There are eight sections, of which four—sections 1, 4, 6, and 8—are capable of block detection. Therefore, the MCR-2 is configured with a 4-channel block detection circuit.
The PWM drivers are independent 2-channel units, and each driver can be assigned to any section. In this way, two locomotives can run simultaneously on a single track, enabling passing maneuvers using a siding. The locomotives are controlled to move or stop based on logic control signals (1/0). Even when stopped, a PWM drive signal with a 3 % duty cycle is sent to the track; when a move command is issued, this duty cycle automatically increases to approximately 30 %. When a stop command is issued, the duty cycle automatically decreases back to 3 %, and the locomotive comes to a stop.
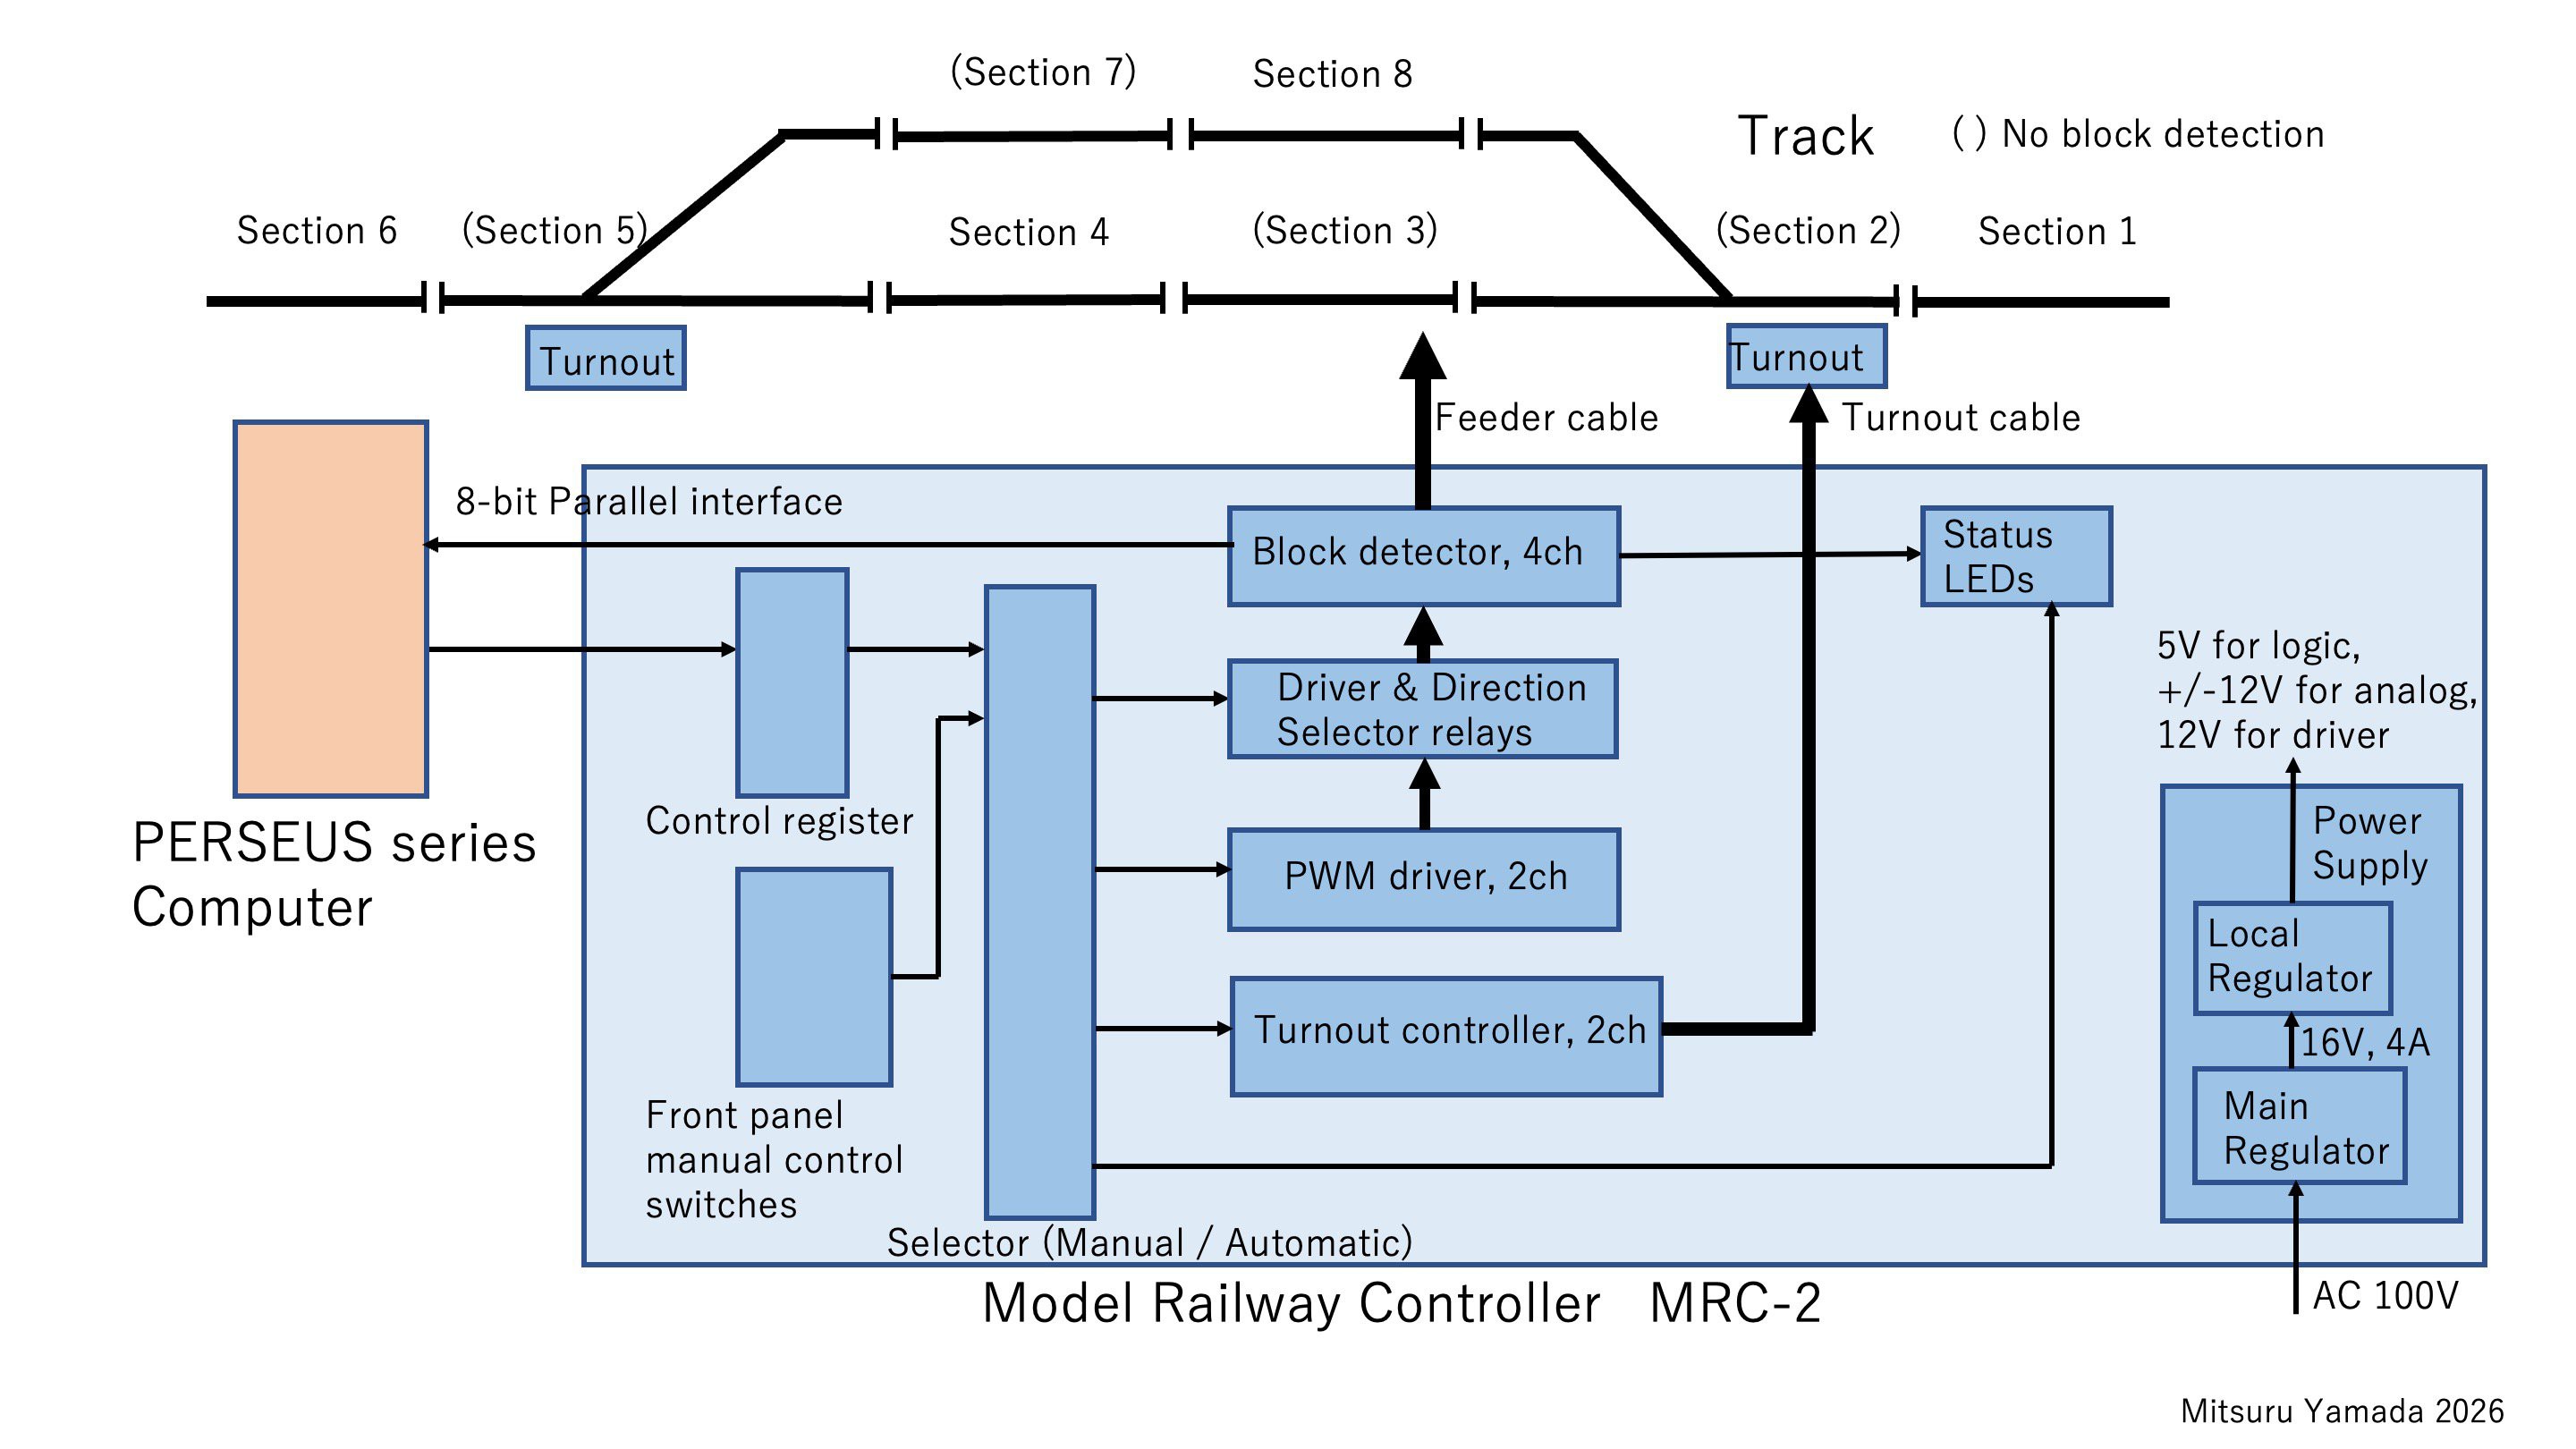
Fig. 2 MRC-2 configuration.
The PWM drive signal is then passing through a relay circuit to select the driver and the direction of travel. It is then supplied to the track via a transformer for block detection. The pulse current signal detected by the transformer is converted into a detection logic signal by an analog circuit. This signal lights up the red “DET” LED on the panel and is also made available for reading by an external computer.
In manual mode, toggle switches on the MRC-2 panel allow the user to select drivers 1 and 2 and set the direction of travel for any section. The current status is indicated by green and orange LEDs. When the driver pushbutton is not pressed, the locomotive is at a standstill; it moves only while the pushbutton is pressed. Turnout switching is also controlled by toggle switches, and the status is indicated by LEDs.
In automatic mode, the data selector routes all control logic signals from the parallel interface registers rather than from the panel switches. Each LED displays its status in the same way as in manual mode. Figure 3 shows the exterior of the MRC-2.
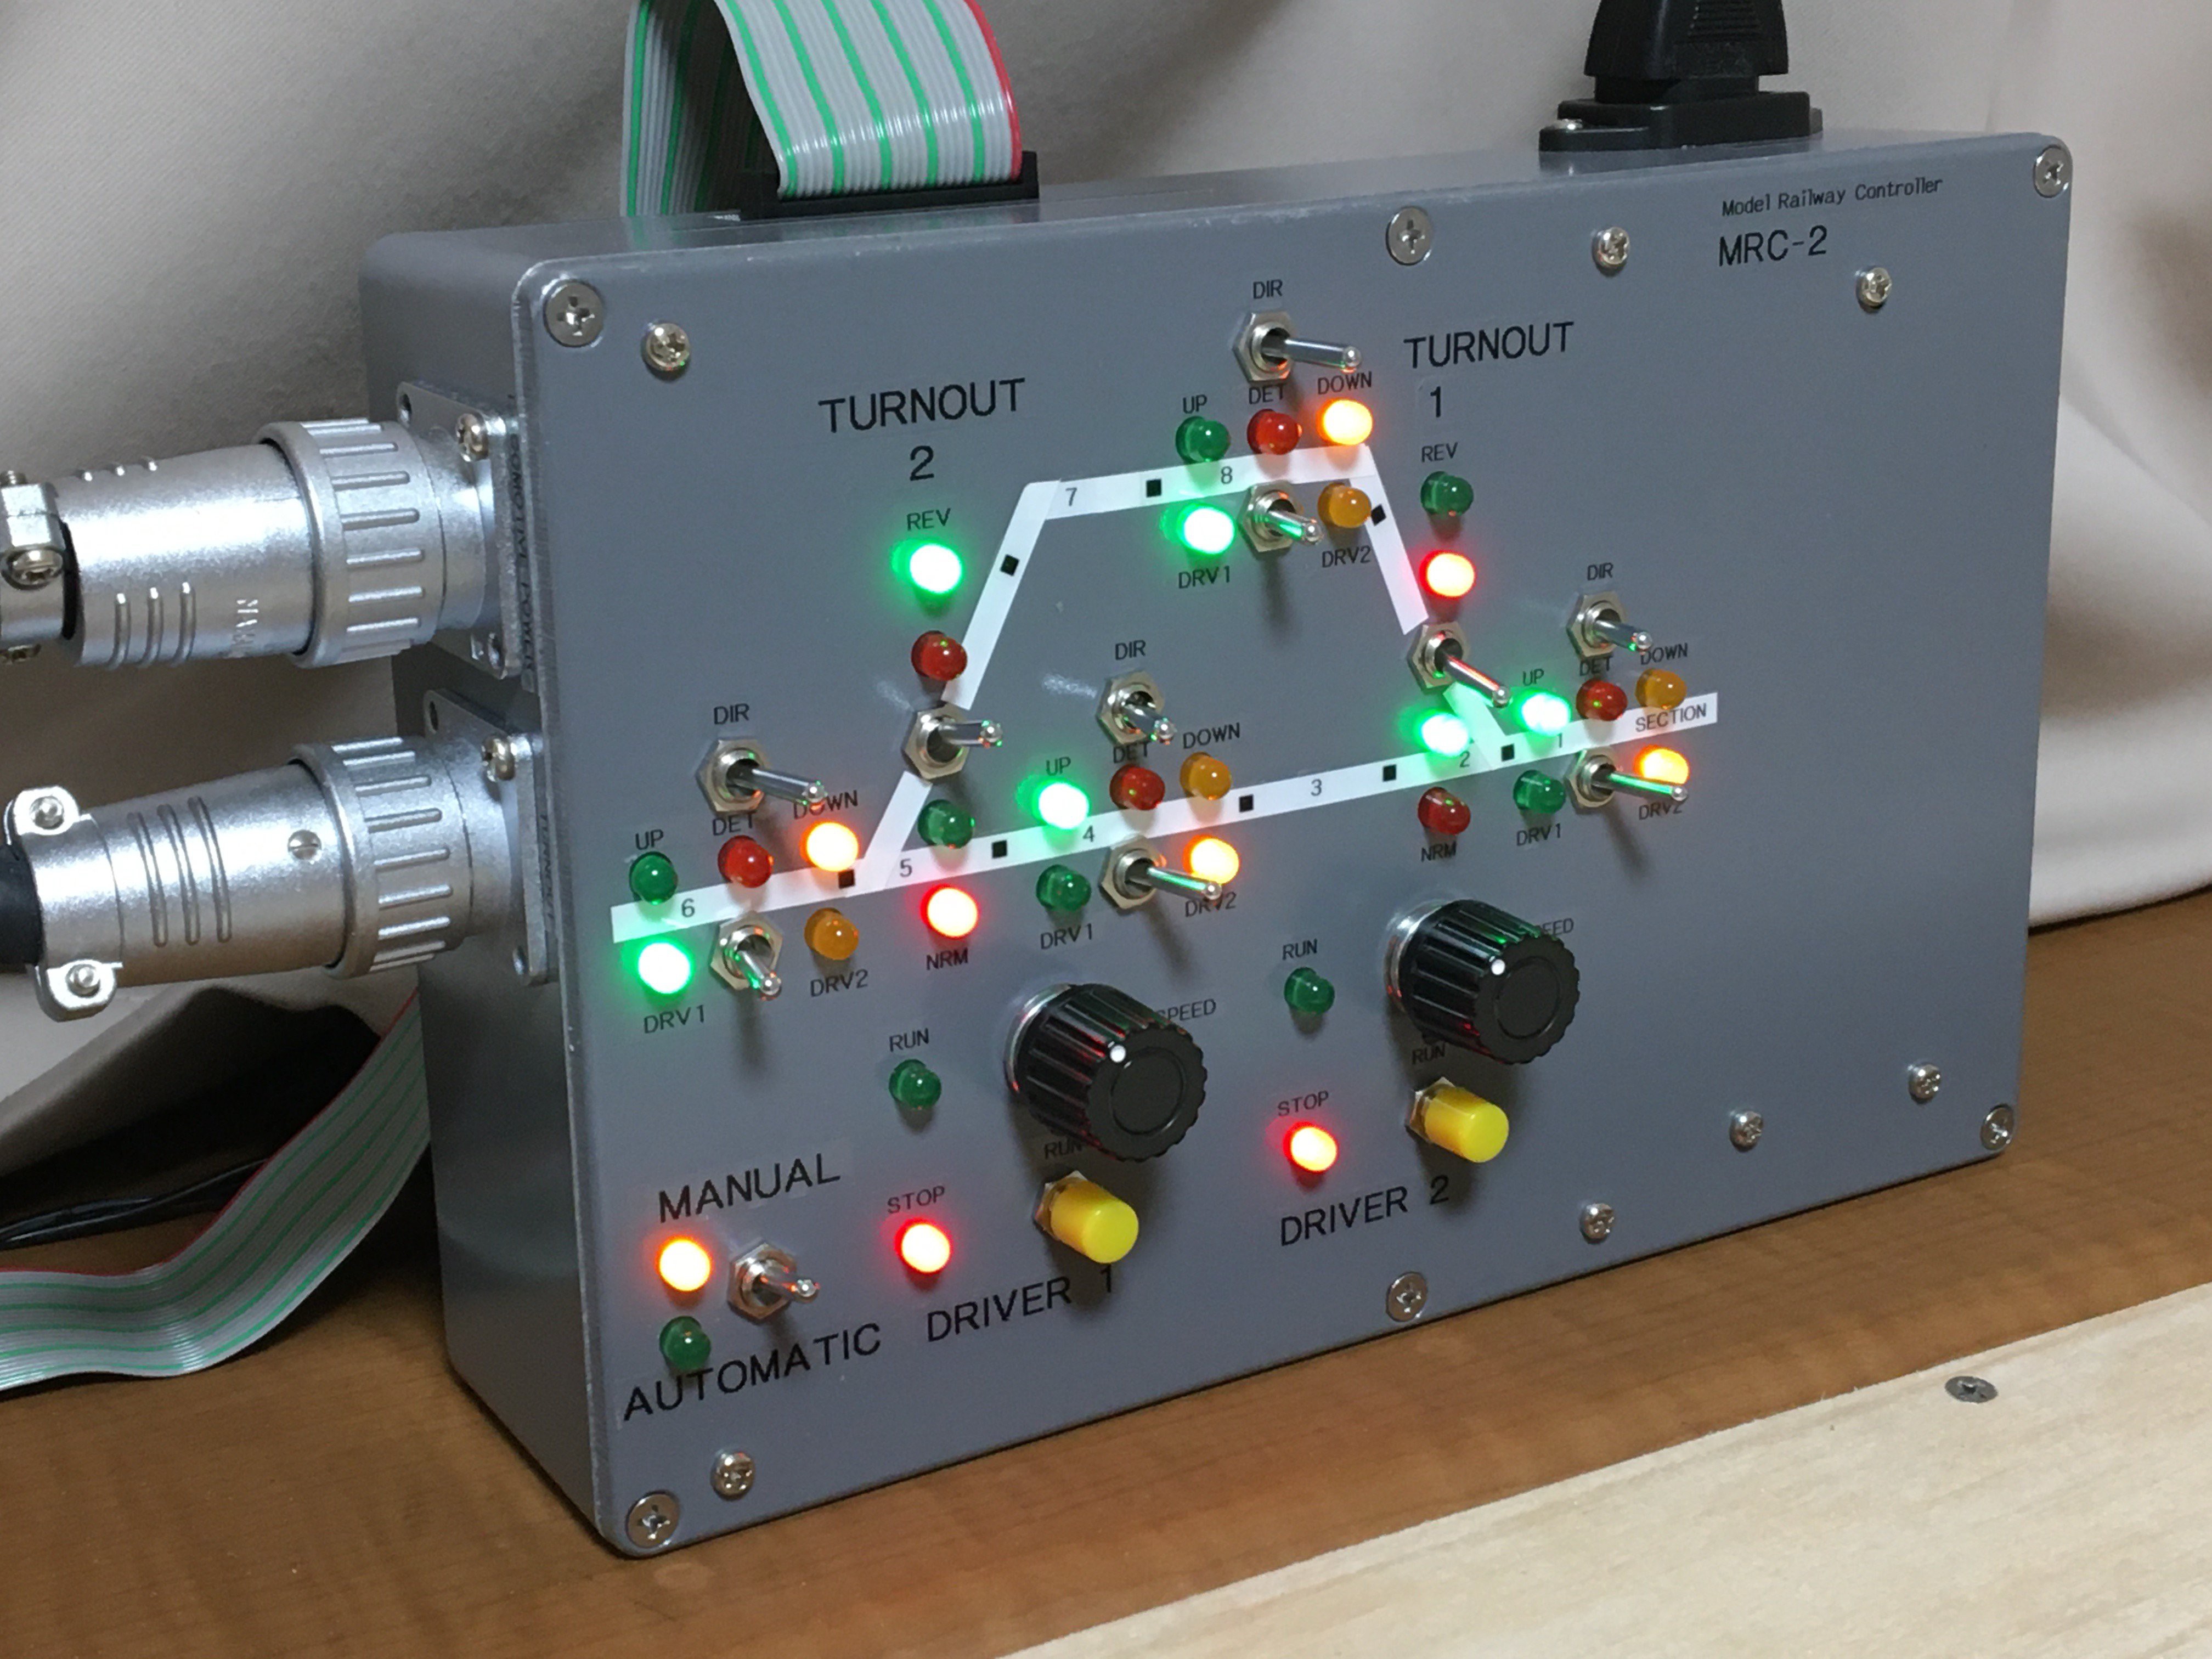
Fig. 3 Exterior of MRC-2.
2. MRC-2 circuit board
Figure 4 shows the MRC-2 circuit board. The rightmost section of the board contains the analog PWM driver circuits for the two channels. In the center of the board are 10 relays: 2 are used for acceleration and deceleration control of the PWM drivers, 4 are used to select the driver for each section, and 4 are used to select the direction of travel for each section. The leftmost section of the board contains the block detection circuits for the four channels. The toroidal transformer is used to detect pulse currents for block detection.
The bottom edge of the board contains a standard logic IC circuit for the 8-bit parallel interface connector, configuration registers, and data selector. The top edge of the board houses the turnout drive control circuit. The right side of the top edge of the board contains the local regulator circuit, while the right side outside the board houses the 16 V, 4 A main switching regulator. All of these circuits are housed in a HAMMOND 1550G die-cast aluminum case (222 mm x 146 mm x 55 mm). The full circuit diagram is in the attached file. The component layout figure and the wiring side of the circuit board photo are also in the attached file. In the following chapters, I will explain the PWM driver and the block detection.
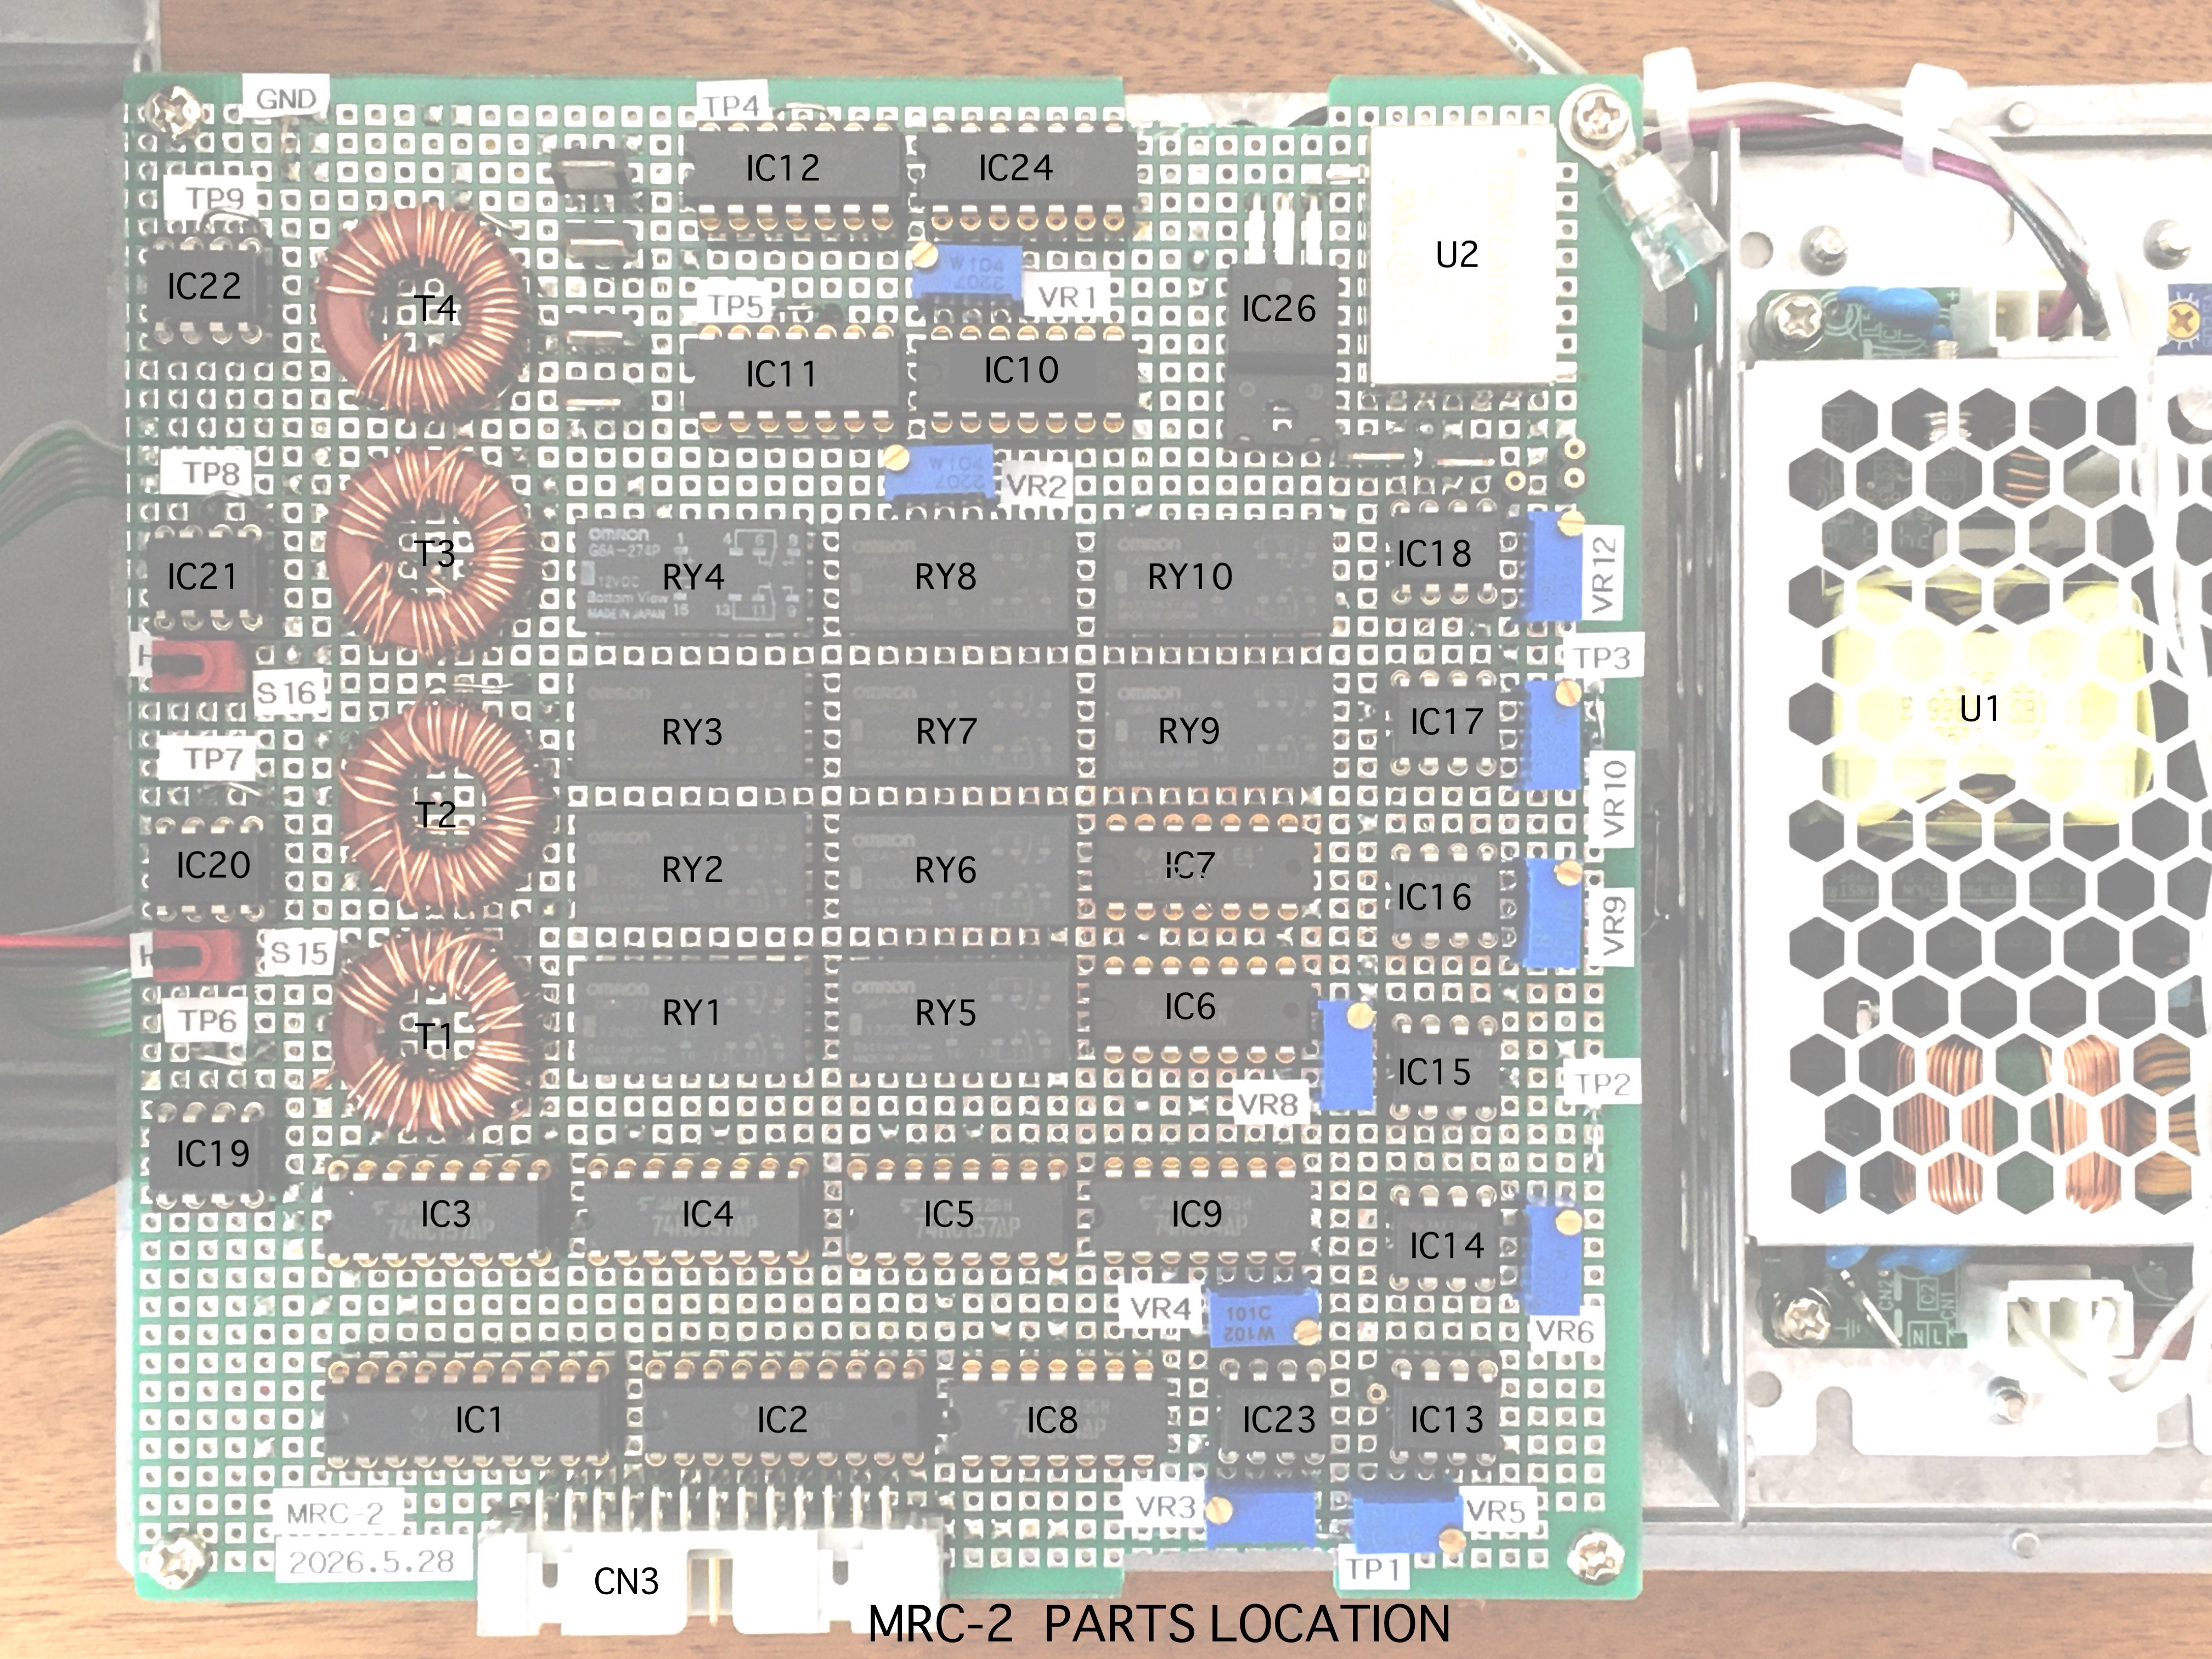
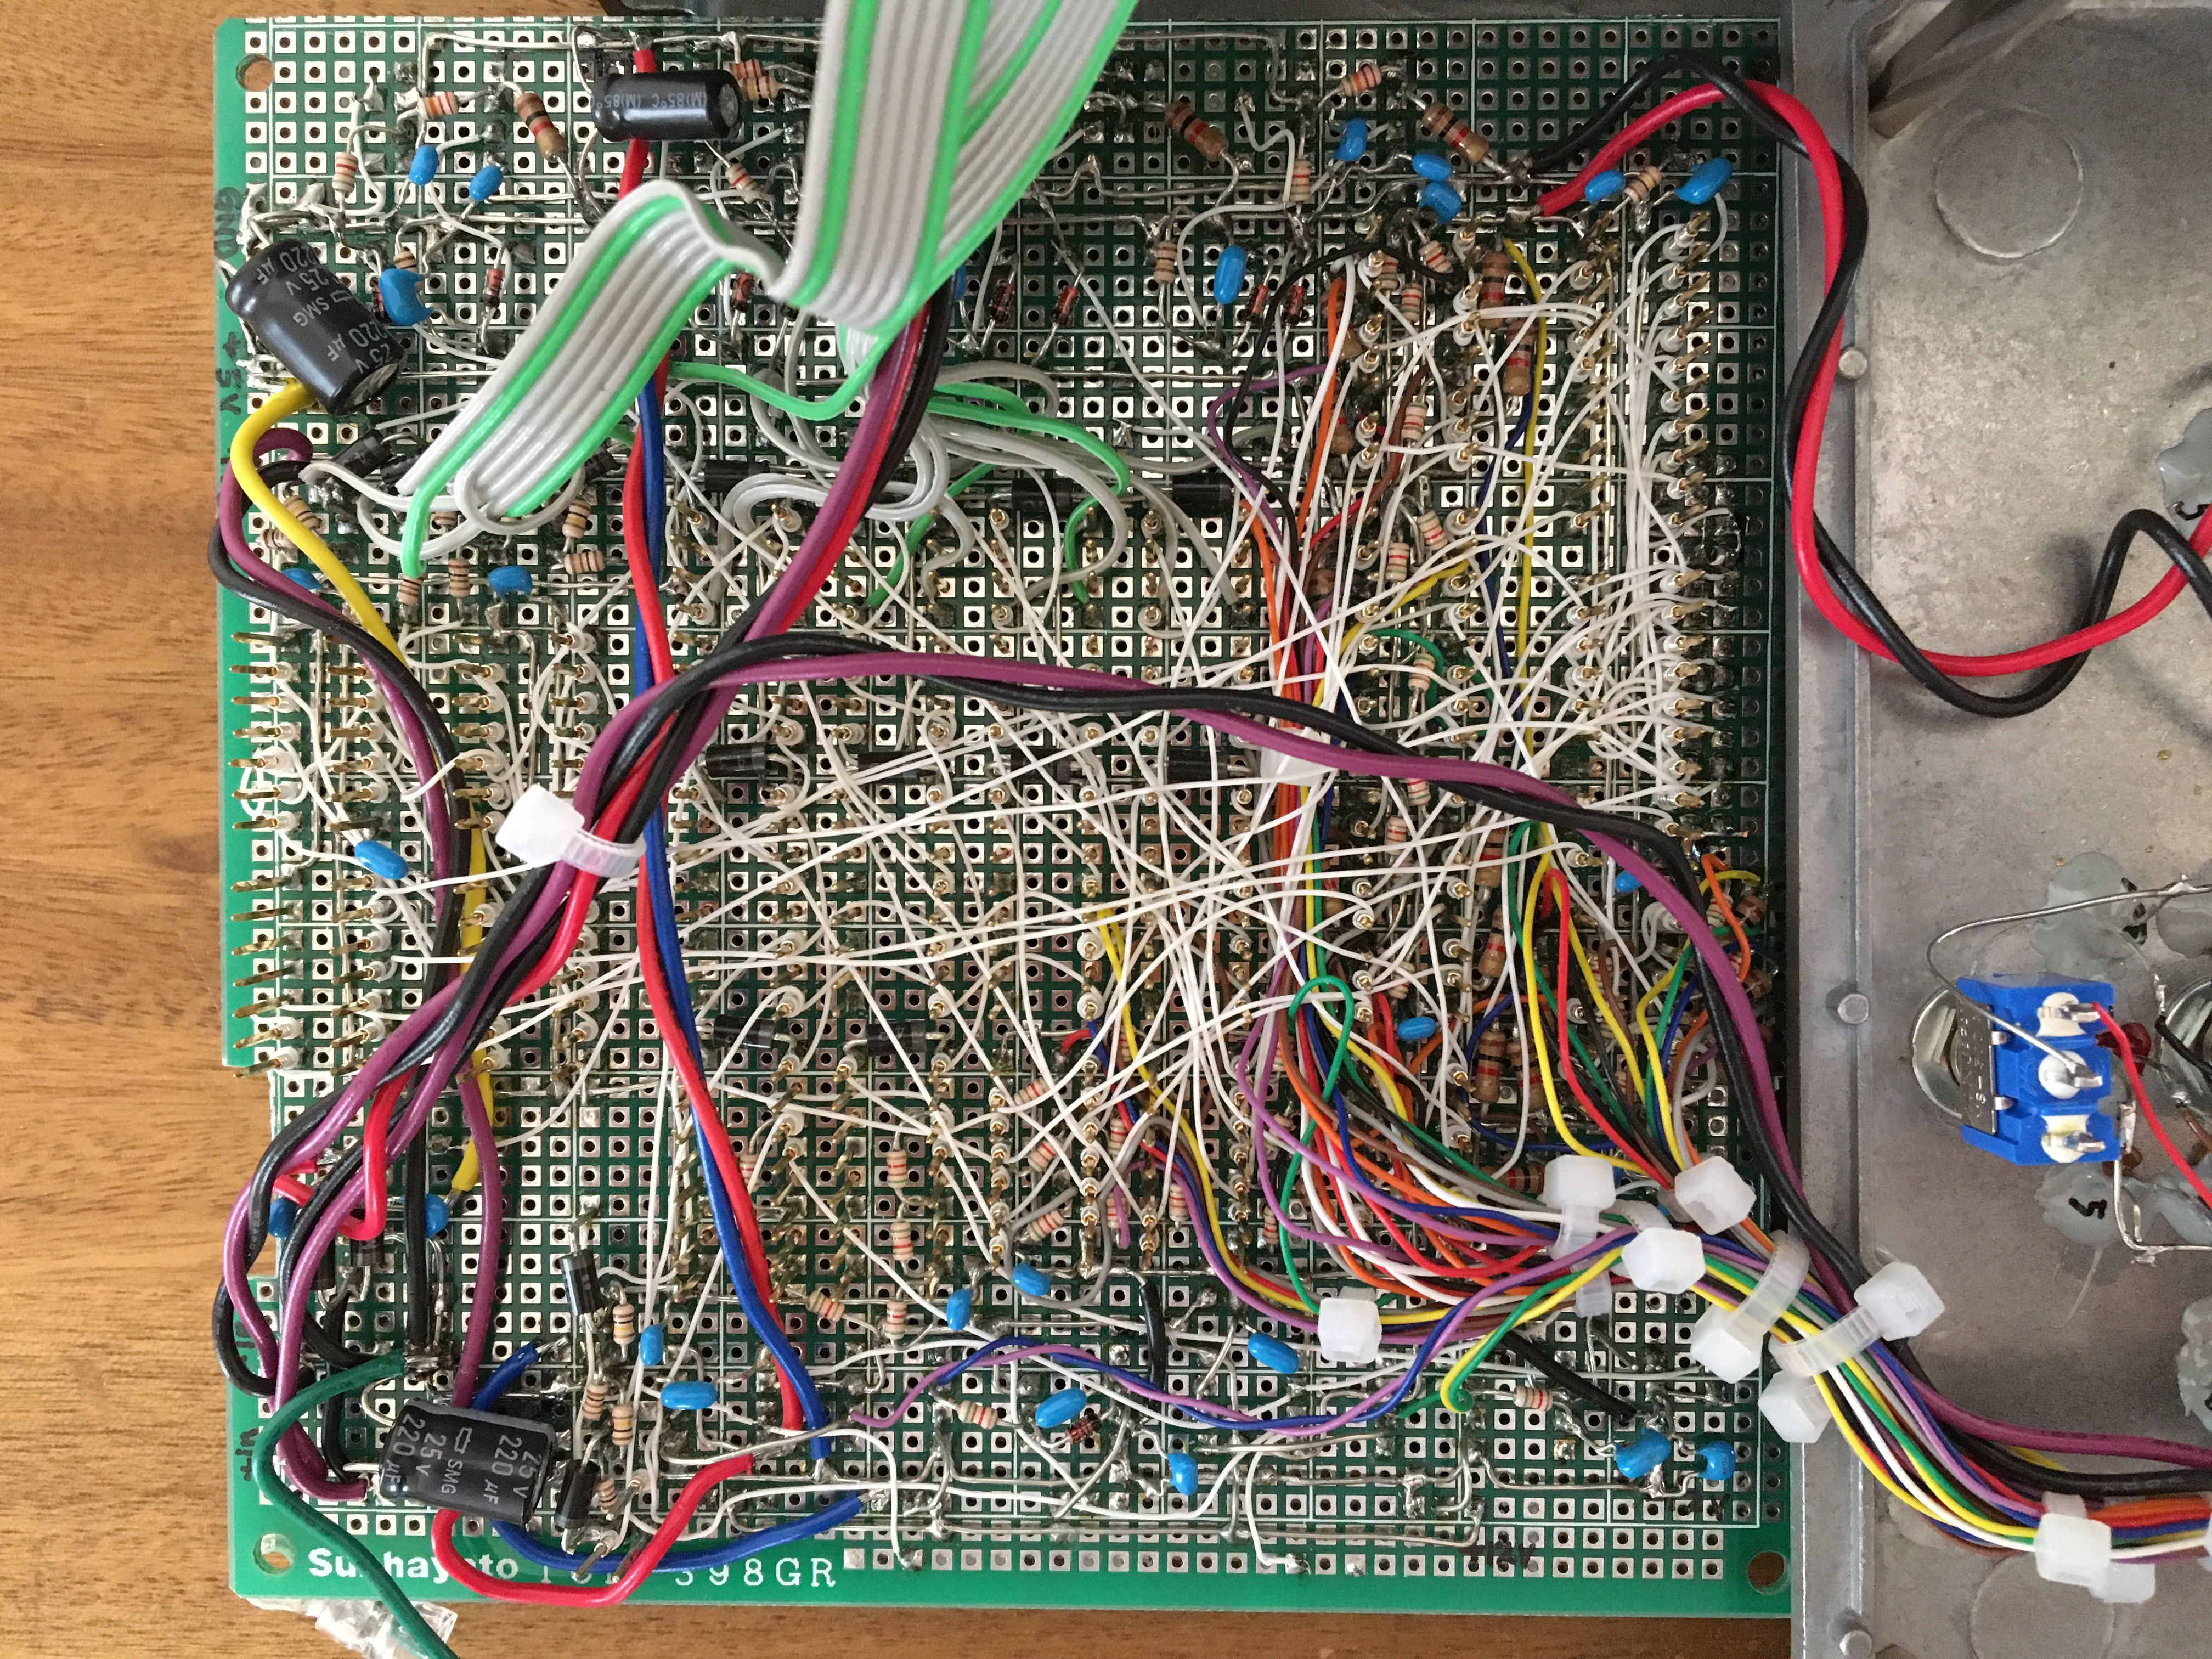
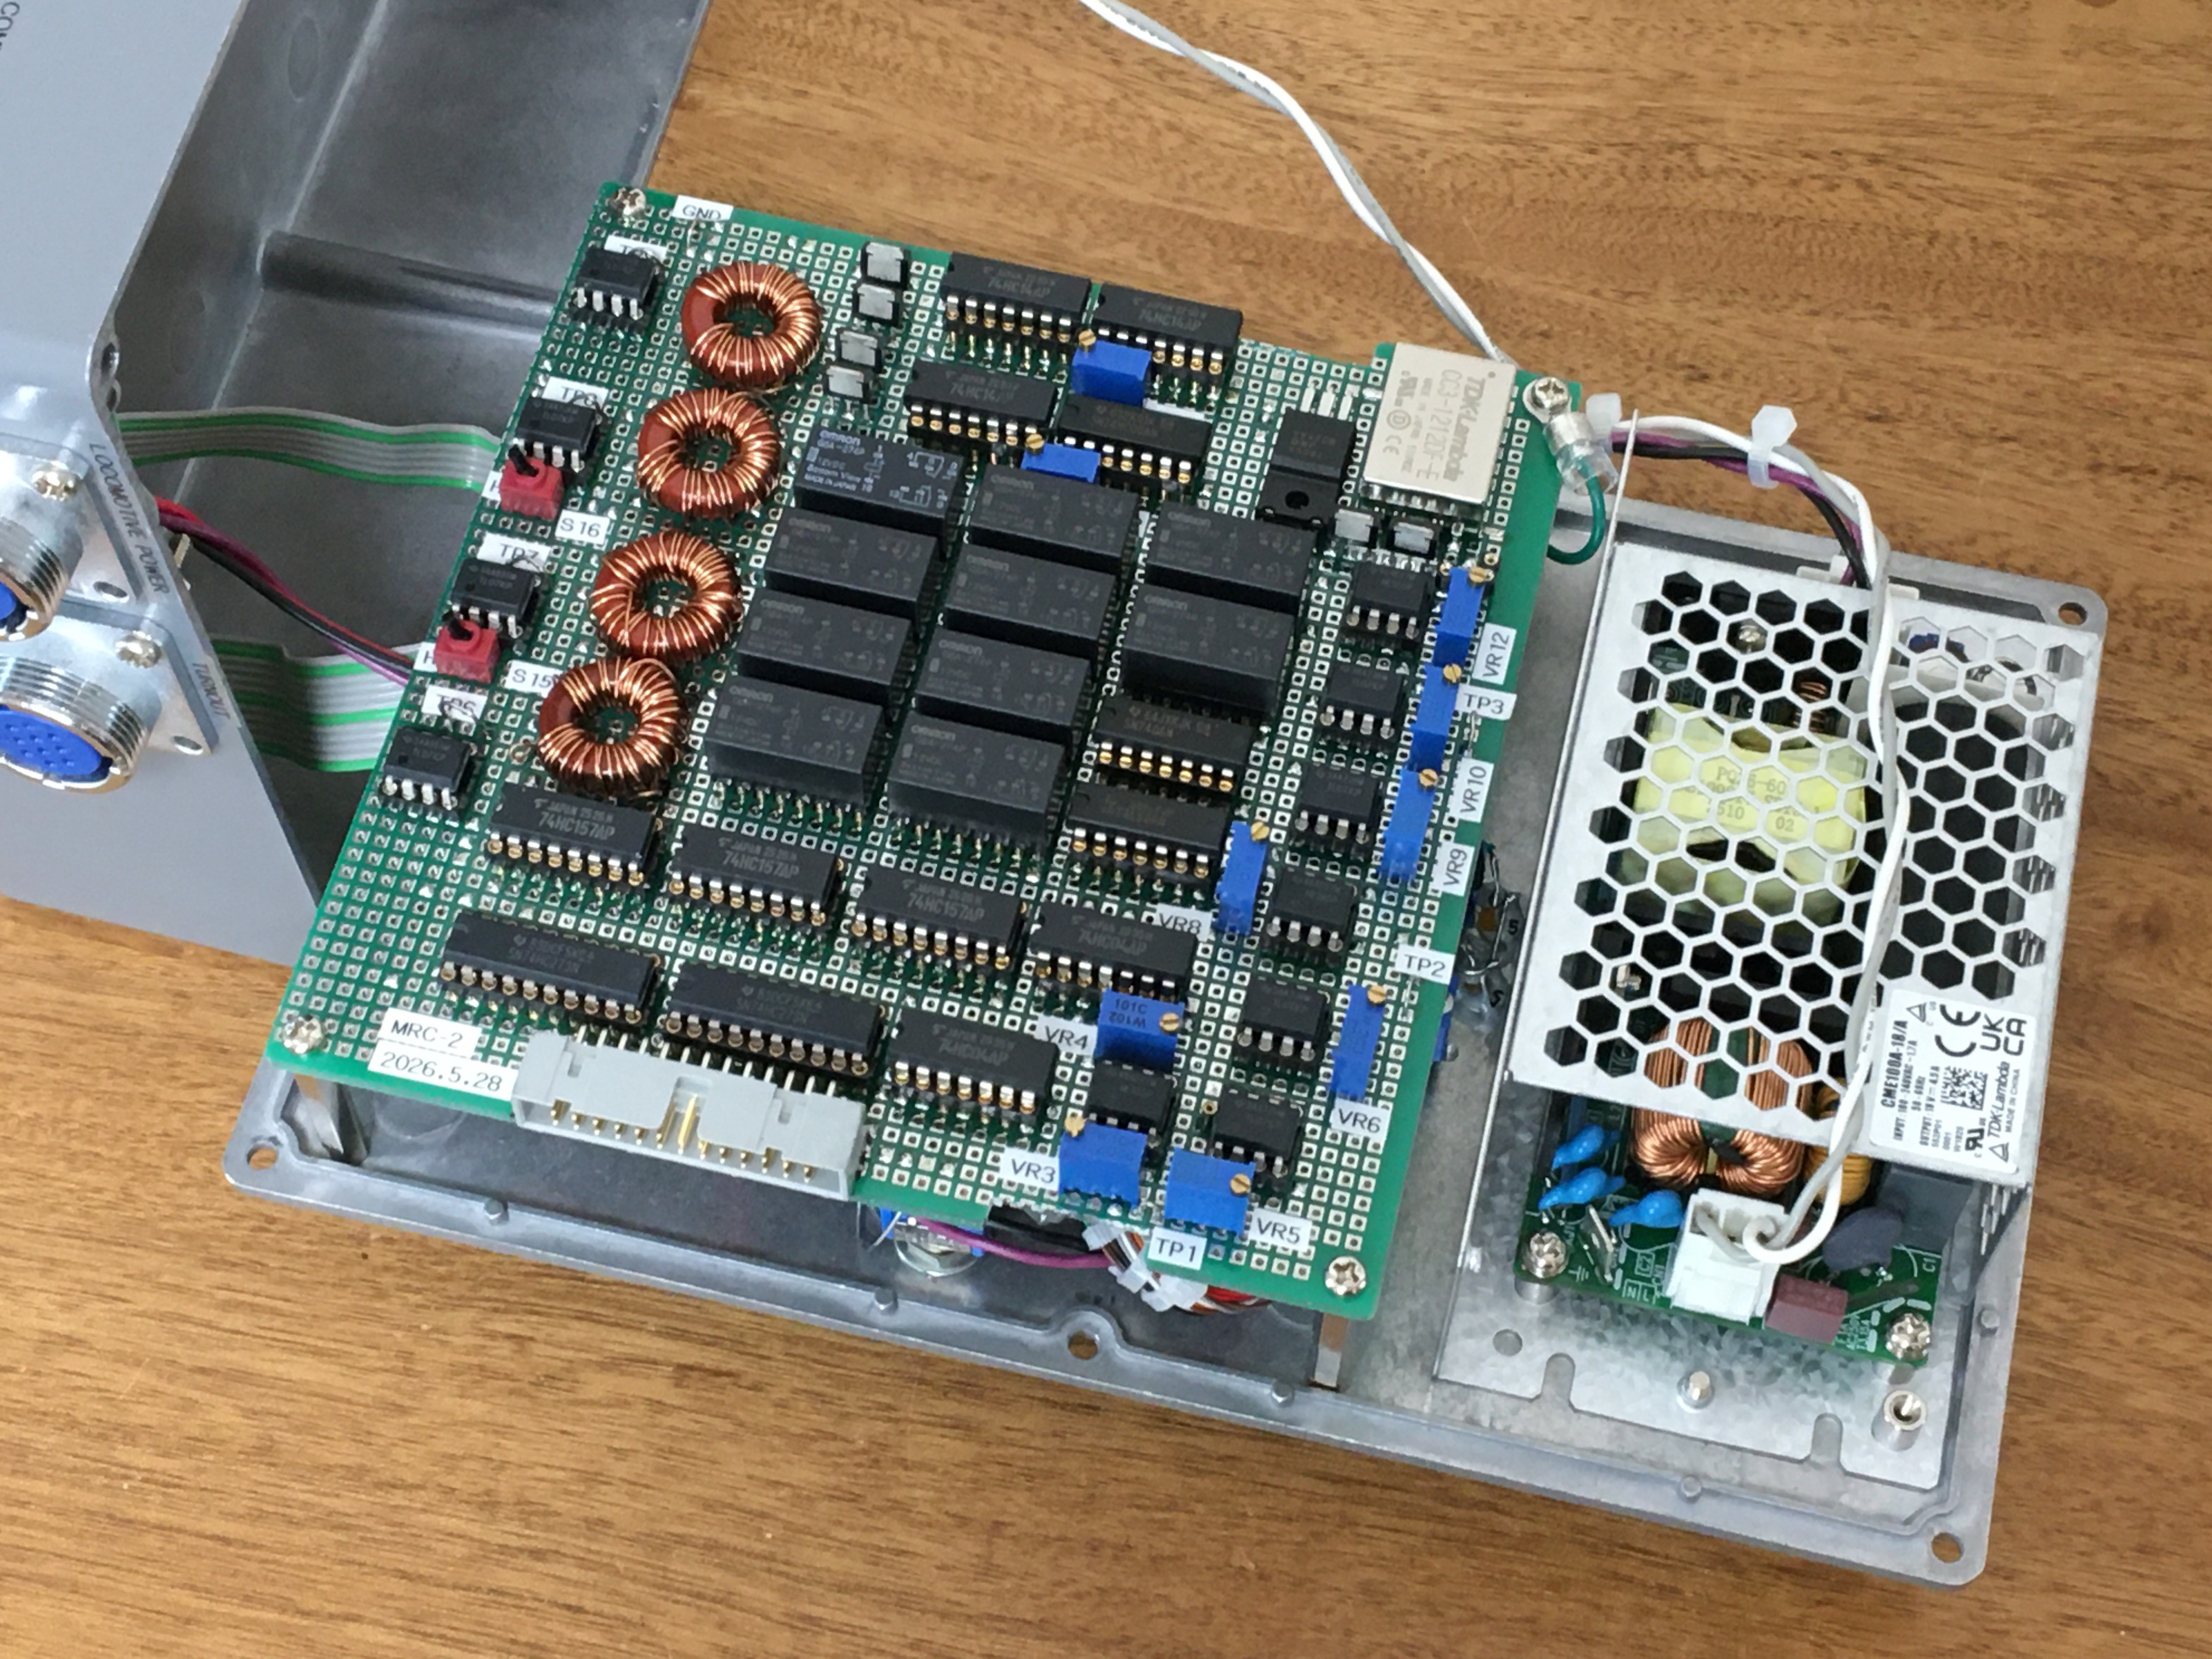
Fig. 4 MRC-2 circuit board.
3. Analog PWM driver
Figure 5 shows the analog PWM driver circuit. The Duty Control Integrator in the lower left of Fig. 5 is an analog integrator consisting of the operational amplifier IC13 and capacitor C5. In manual mode when the panel button is not pressed, or in automatic mode when the control bit is set to 0, relay RY9 is set to the Decel side, and the output is integrated in the positive direction but limited to around zero volts by a diode. When the panel button is pressed in manual mode, or when the control bit is changed from 0 to 1 in automatic mode, relay RY9 switches to the Acce side, and the output is integrated in the negative direction. The integration constant is adjusted by VR5. This ramp waveform, lasting from 1 second to several seconds, serves as the control signal that automatically accelerates and decelerates the motor smoothly. Figure 6 shows the actual waveform of the integrator output measured when the panel button was held down for 2.5 seconds in manual mode. The scale on the horizontal axis is 500 ms/div.
The following duty range setting uses an inverting amplifier based on IC14 to adjust the offset and gain, ensuring that the duty cycle of the driver output waveform is set to an appropriate value. The variable duty pulse generator is a one-shot multivibrator based on IC15 (NE555), and its pulse width is controlled by the output of IC14. The 33 ms periodic trigger signal for this one-shot multivibrator is continuously supplied by an oscillator based on IC23 (NE555). The pulse signal generated by IC15 controls the gate of the power FET. Figure 7 shows an example of the measured PWM waveform; A and B correspond to points A and B in Fig. 6, with A having a duty cycle of 3 % and B having a duty cycle of 36 %. The duty cycle changes smoothly from A to B.
The drain of this FET is connected to the Selector relays & Block detector circuit, which will be explained next. Note that while a single NE555 could be used to simply generate a pulse waveform, I choose this circuit configuration for specifically to vary only the duty cycle while keeping the pulse period constant.
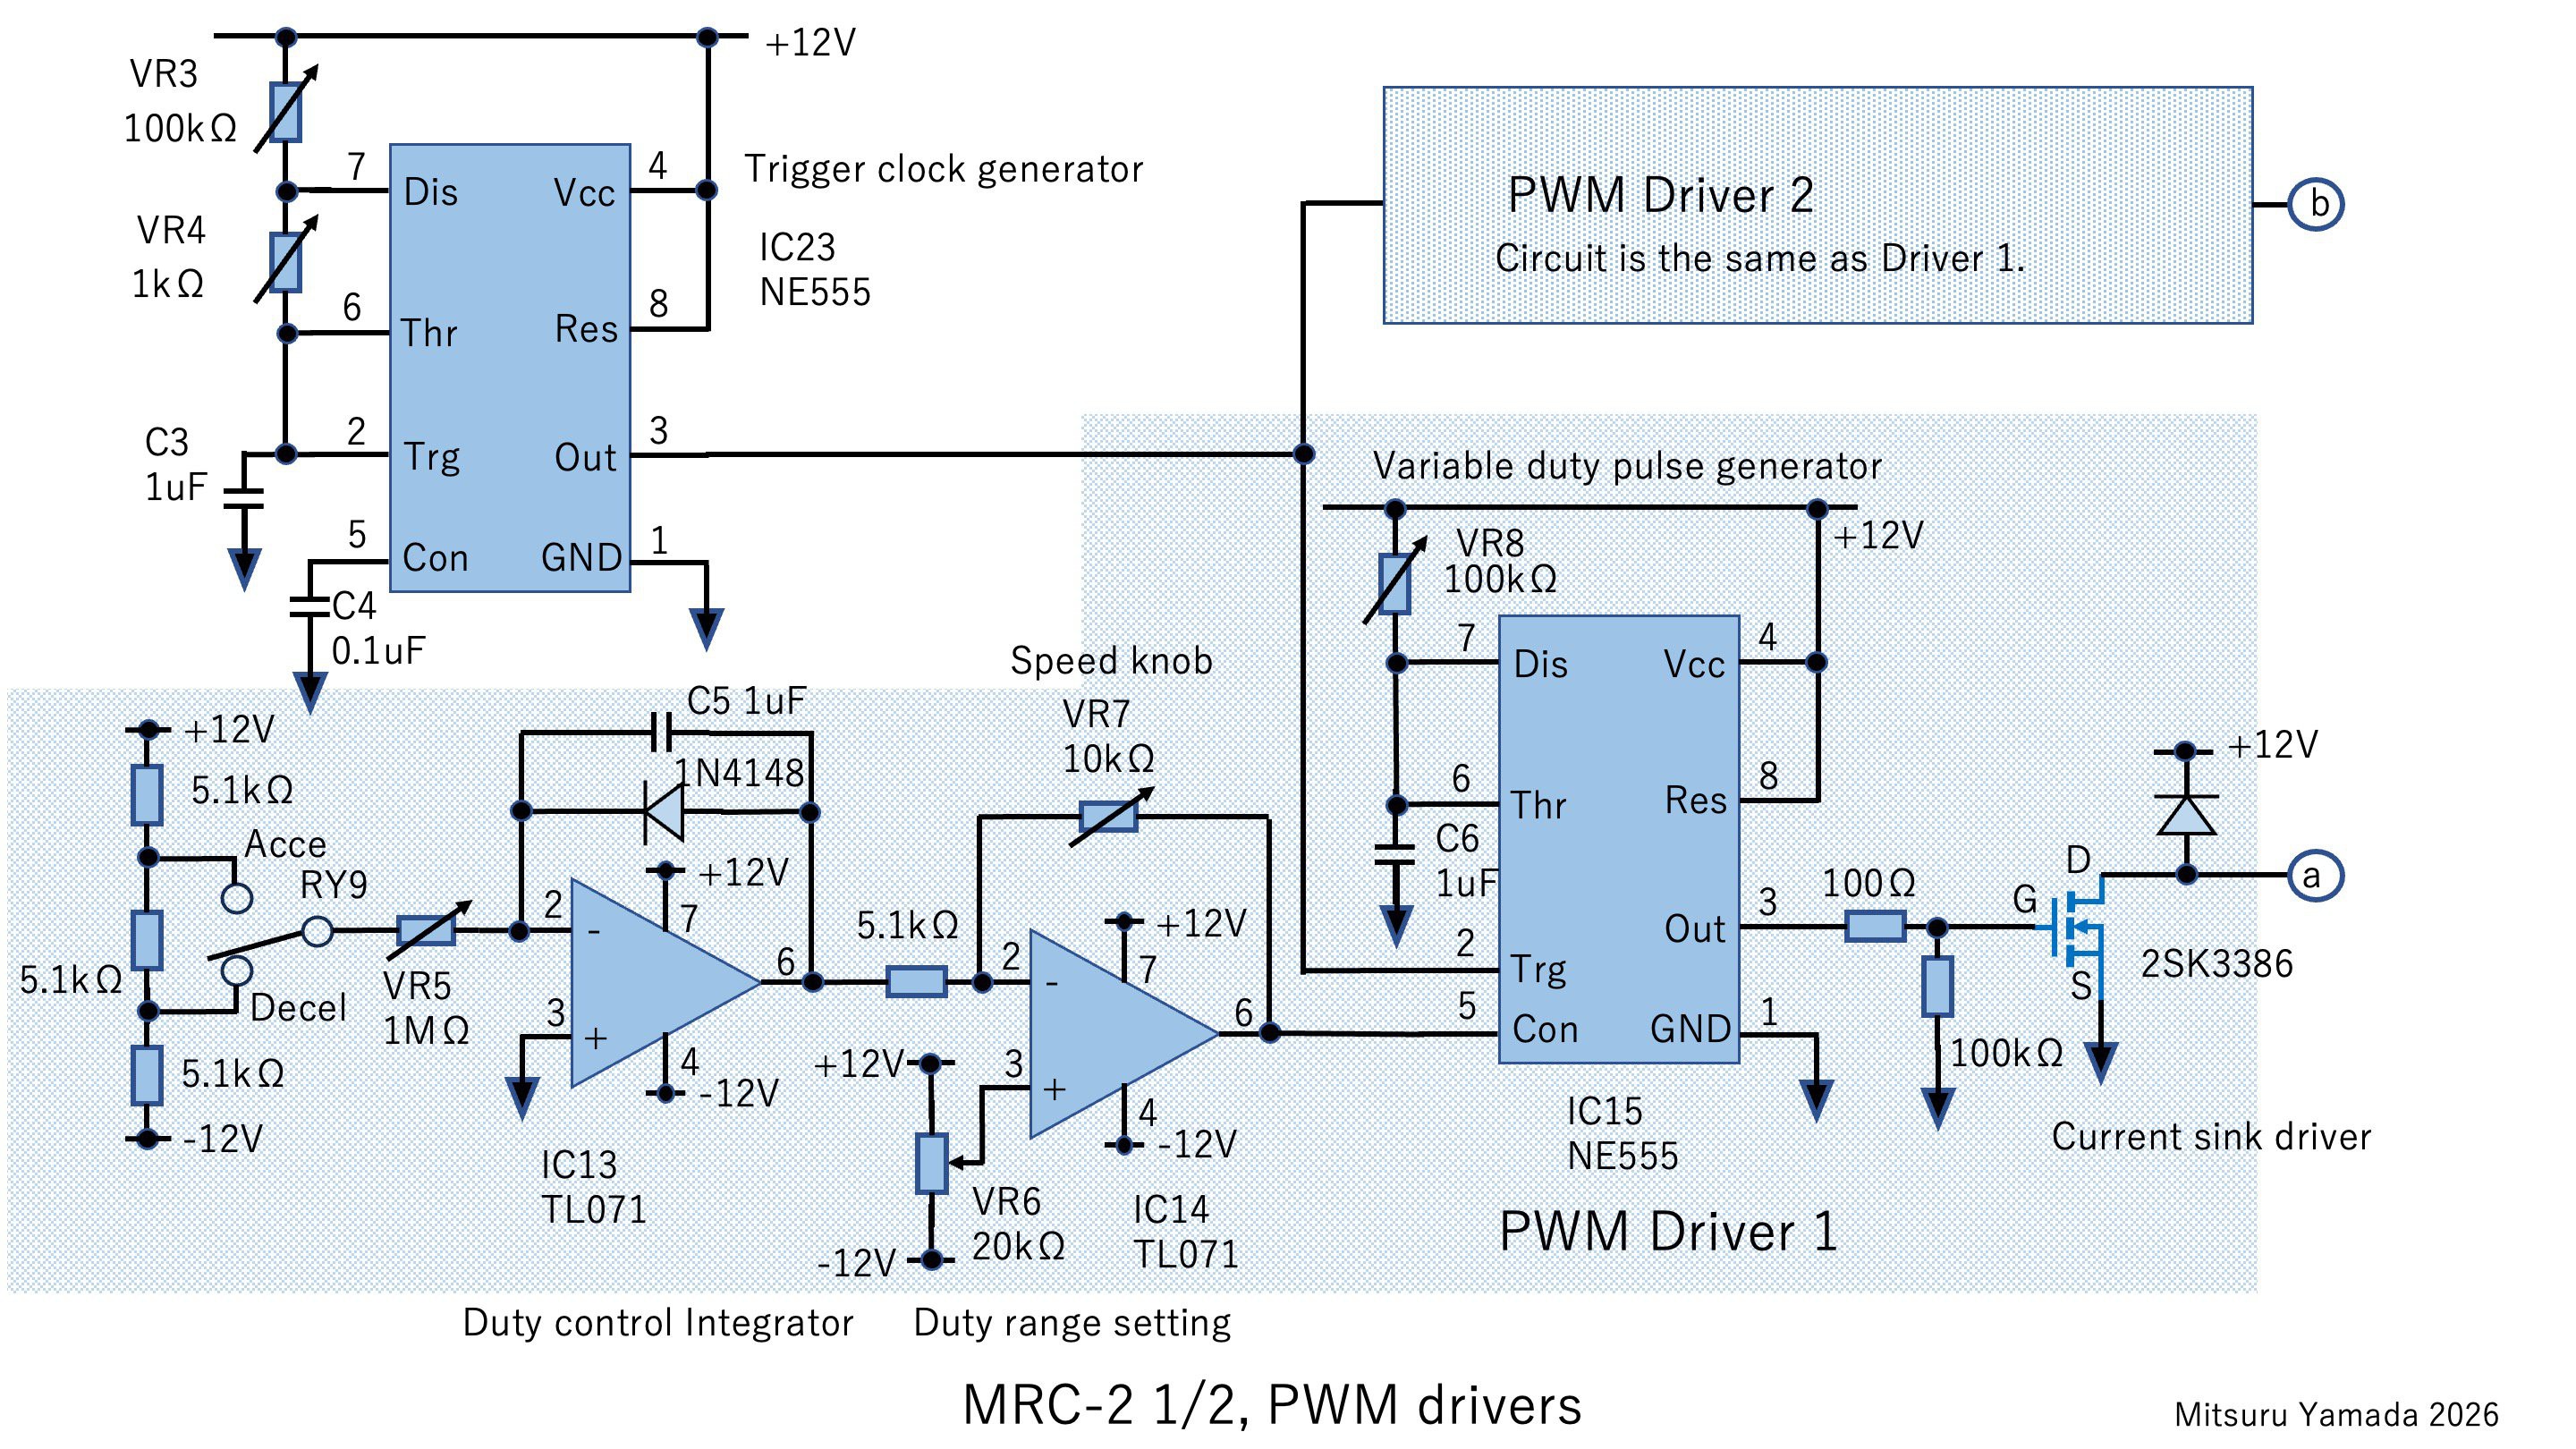
Fig. 5 Analog PWM driver circuit.
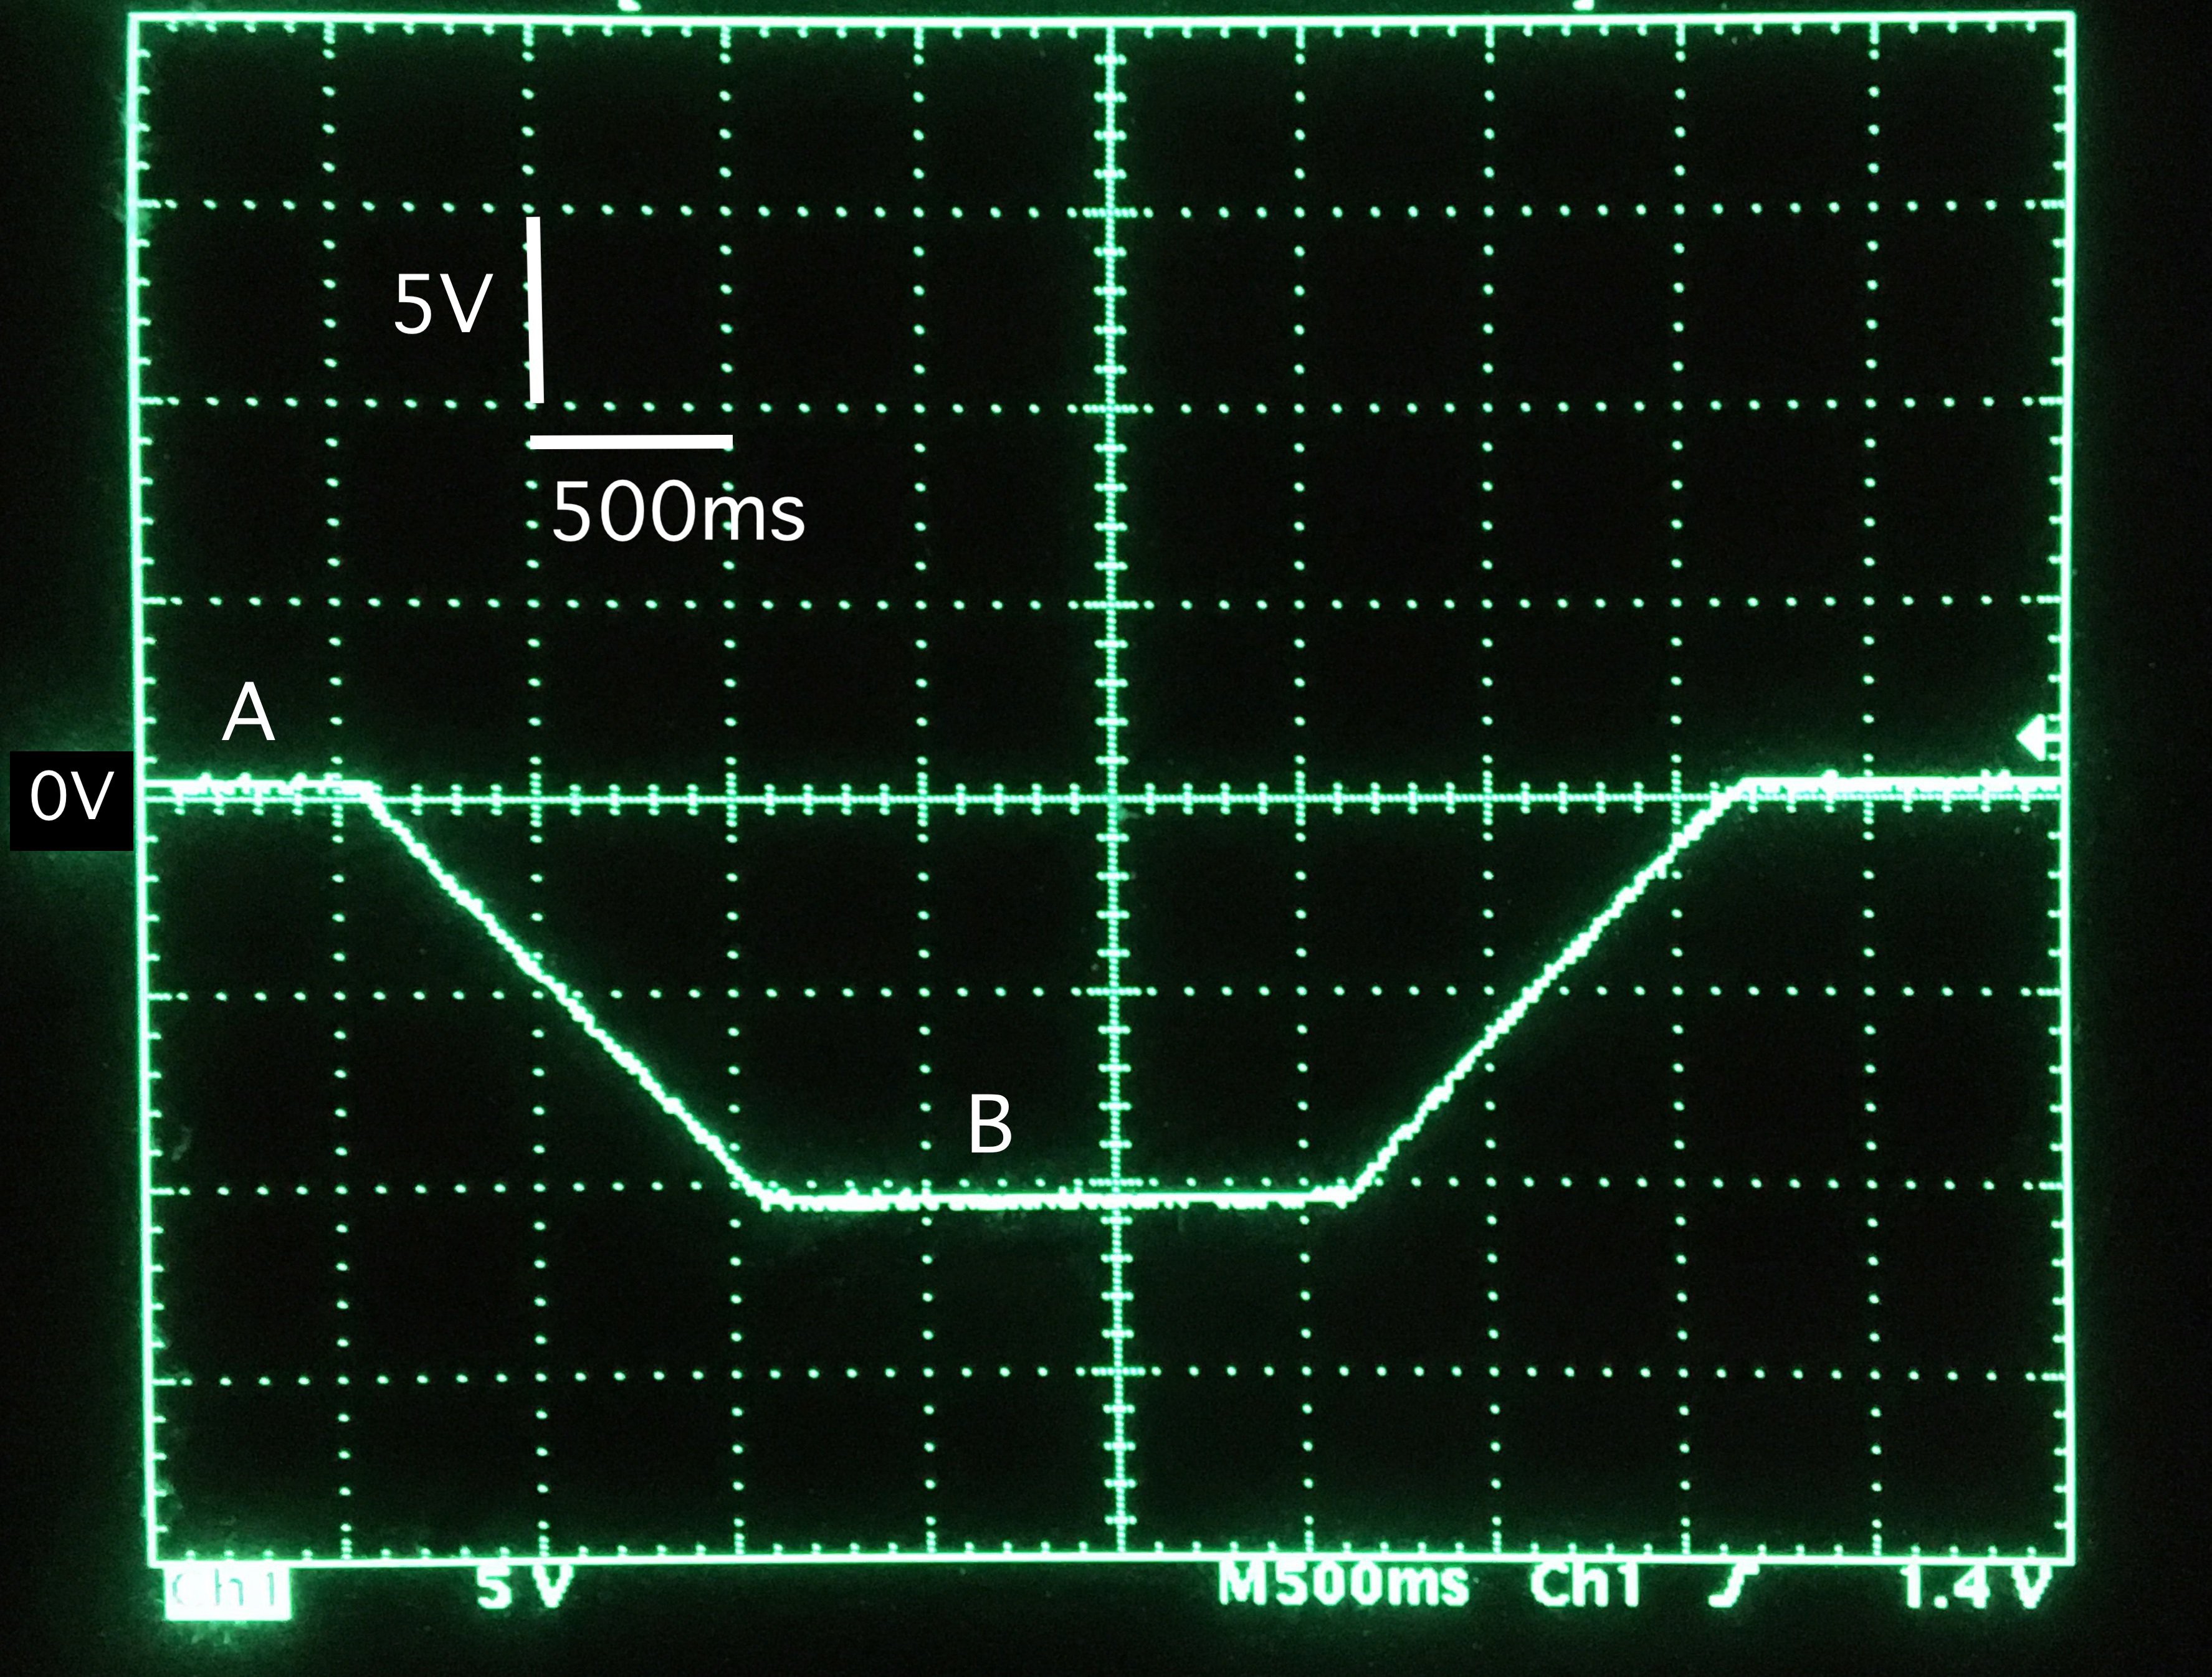
Fig. 6 Signal waveform of the integrator IC13 output.
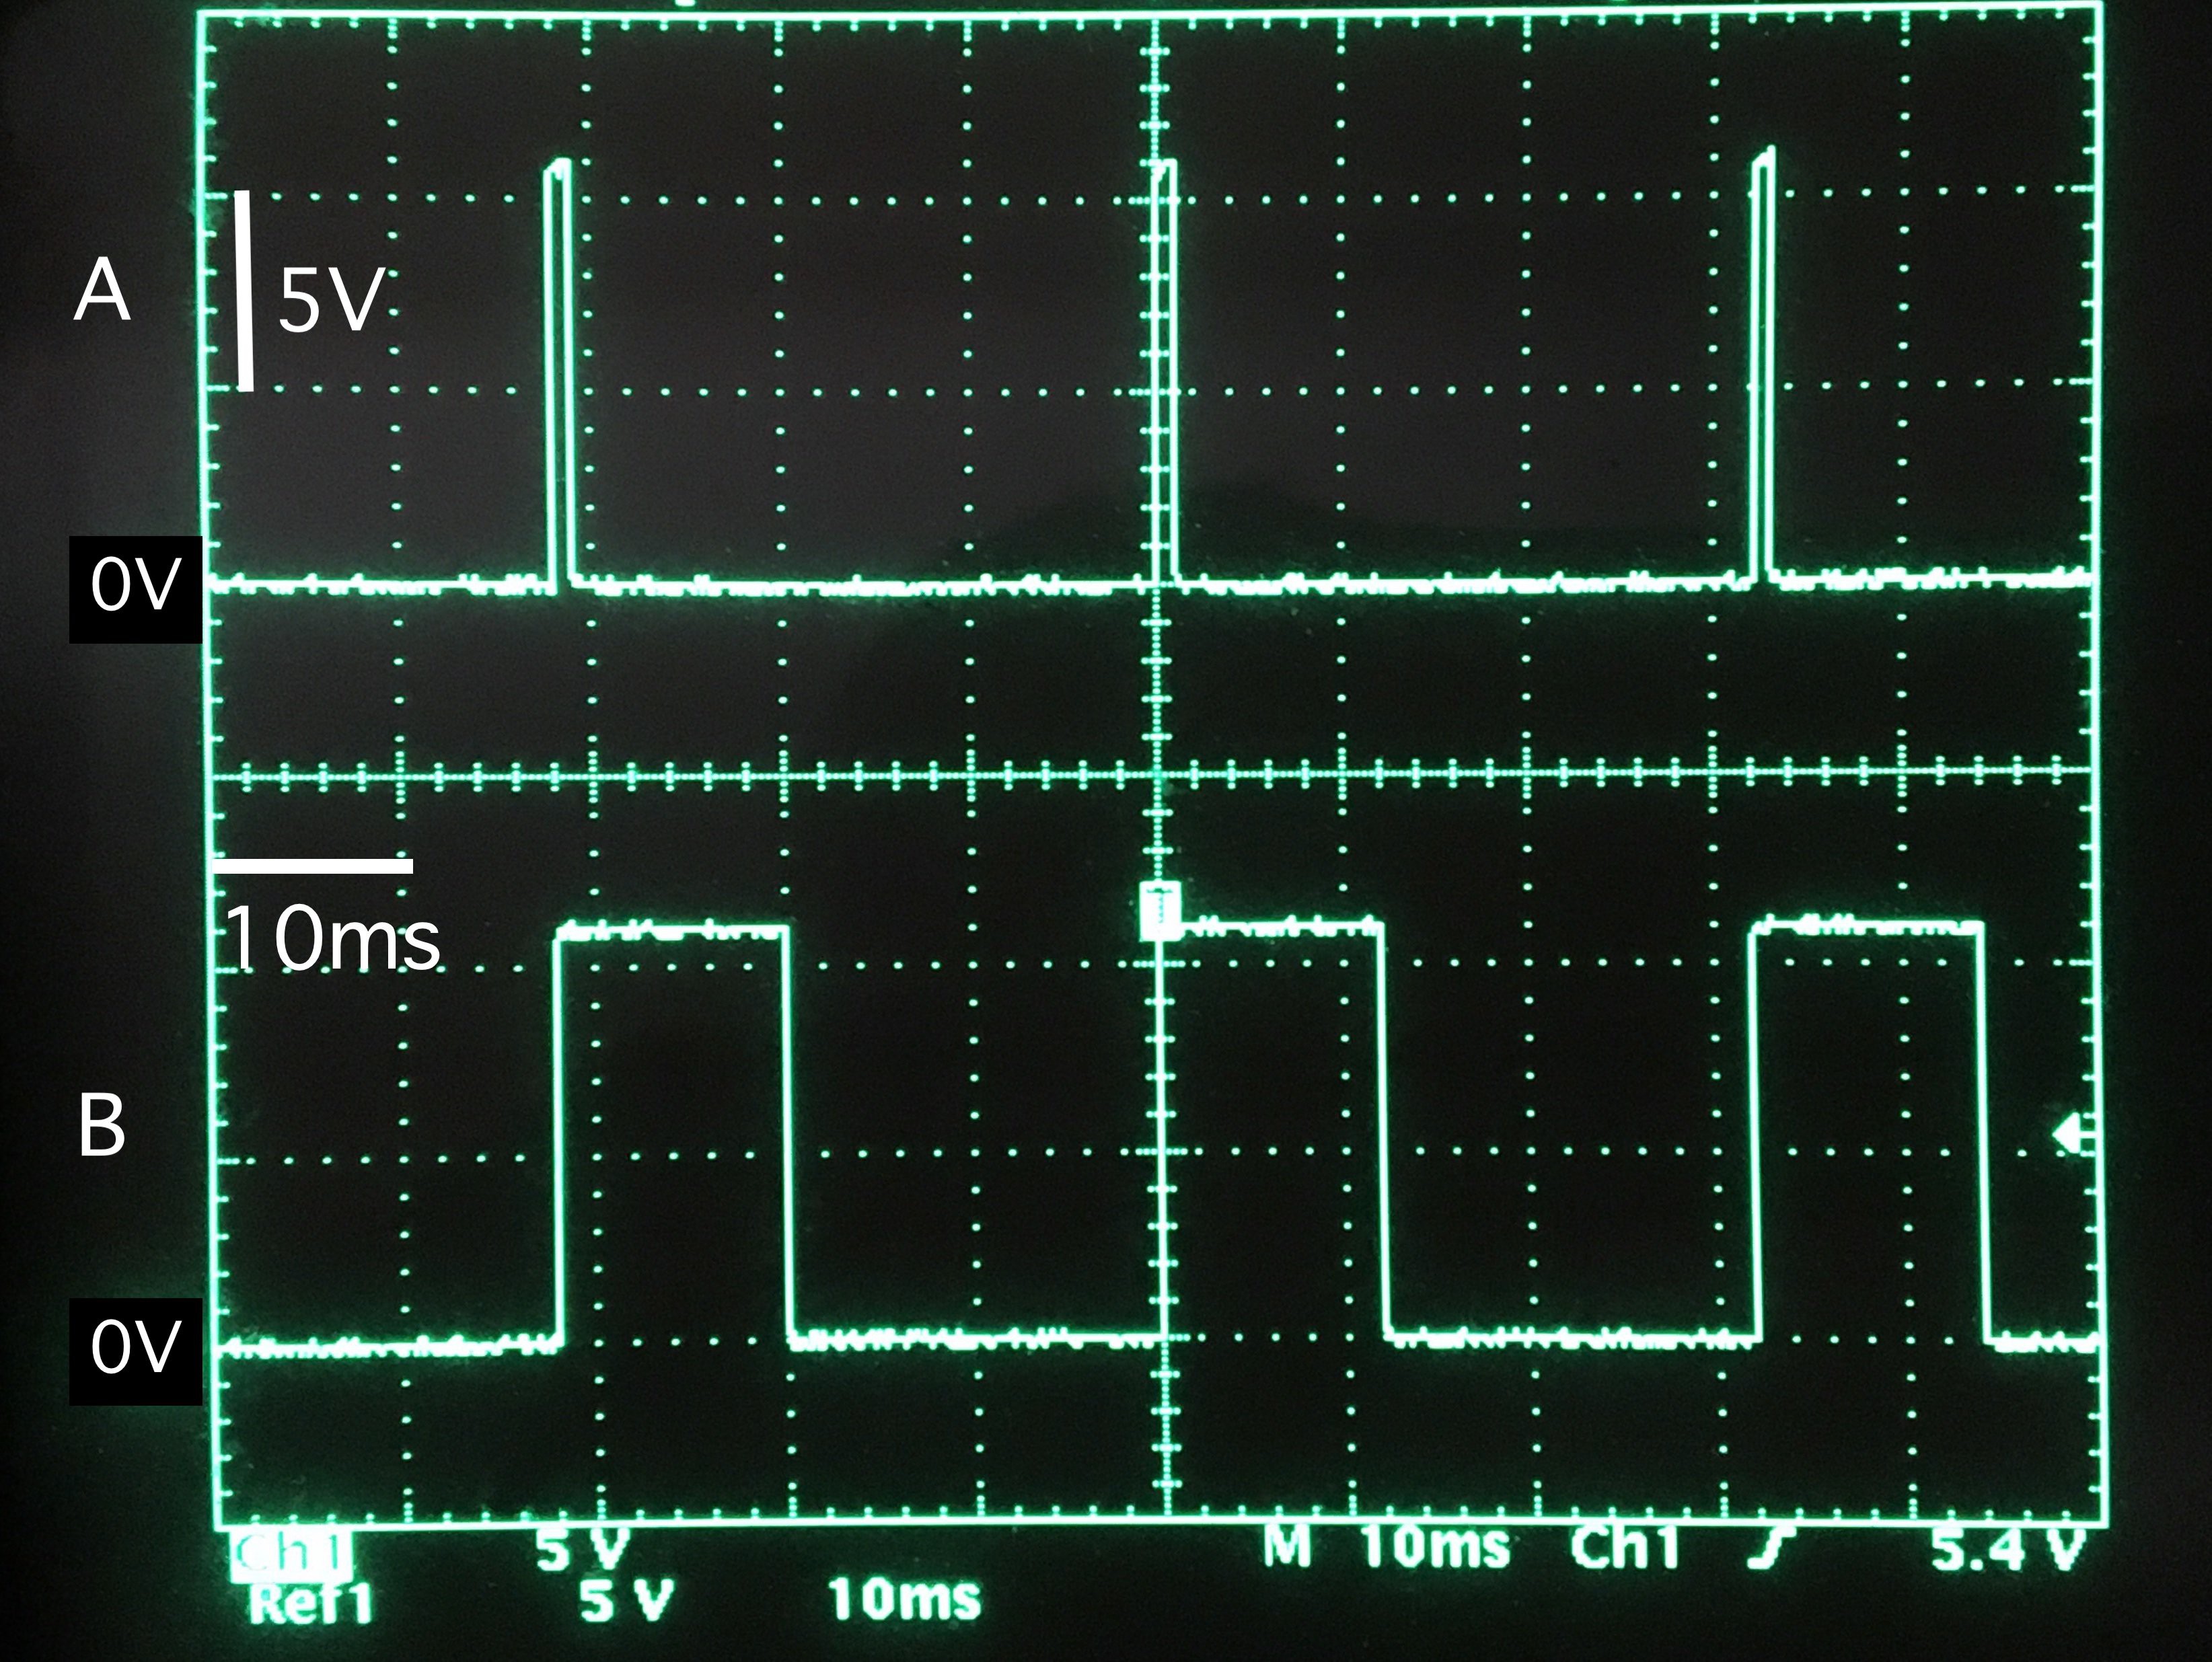
Fig. 7 PWM waveform of the IC15 output.
4. Block detection
Figure 8 shows the block detection circuit. The output “a” from the PWM driver first passes through relay RY8, which selects either Driver 1 or Driver 2, and then through relay RY4, which reverses the polarity to switch the direction of travel. Then, by passing the power feeder signal through the primary side of transformer T1, a pulse current detection signal is extracted from the secondary side of T1. I built this pulse current detection transformer myself using a toroidal core. The core is an Amidon Inc. T-68-2 (O.D. 17.5 mm, 2 MHz–30 MHz), and the winding is AWG 24 polyurethane-coated copper wire. The primary winding has 10 turns, and the secondary winding has 28 turns.
And then, signal is detected by a diode and passed through a low-pass filter with a time constant of 0.1 s (using a CR network) to produce a level detection signal. This signal is amplified by a non-inverting amplifier to produce a 5 V logic detection output signal. To stabilize the logic level, the gain must be sufficiently high. Since a 3% duty cycle drive signal is always present on the track even when the locomotive is stationary, the signal will always be detected if the locomotive is on the track in the section 1.
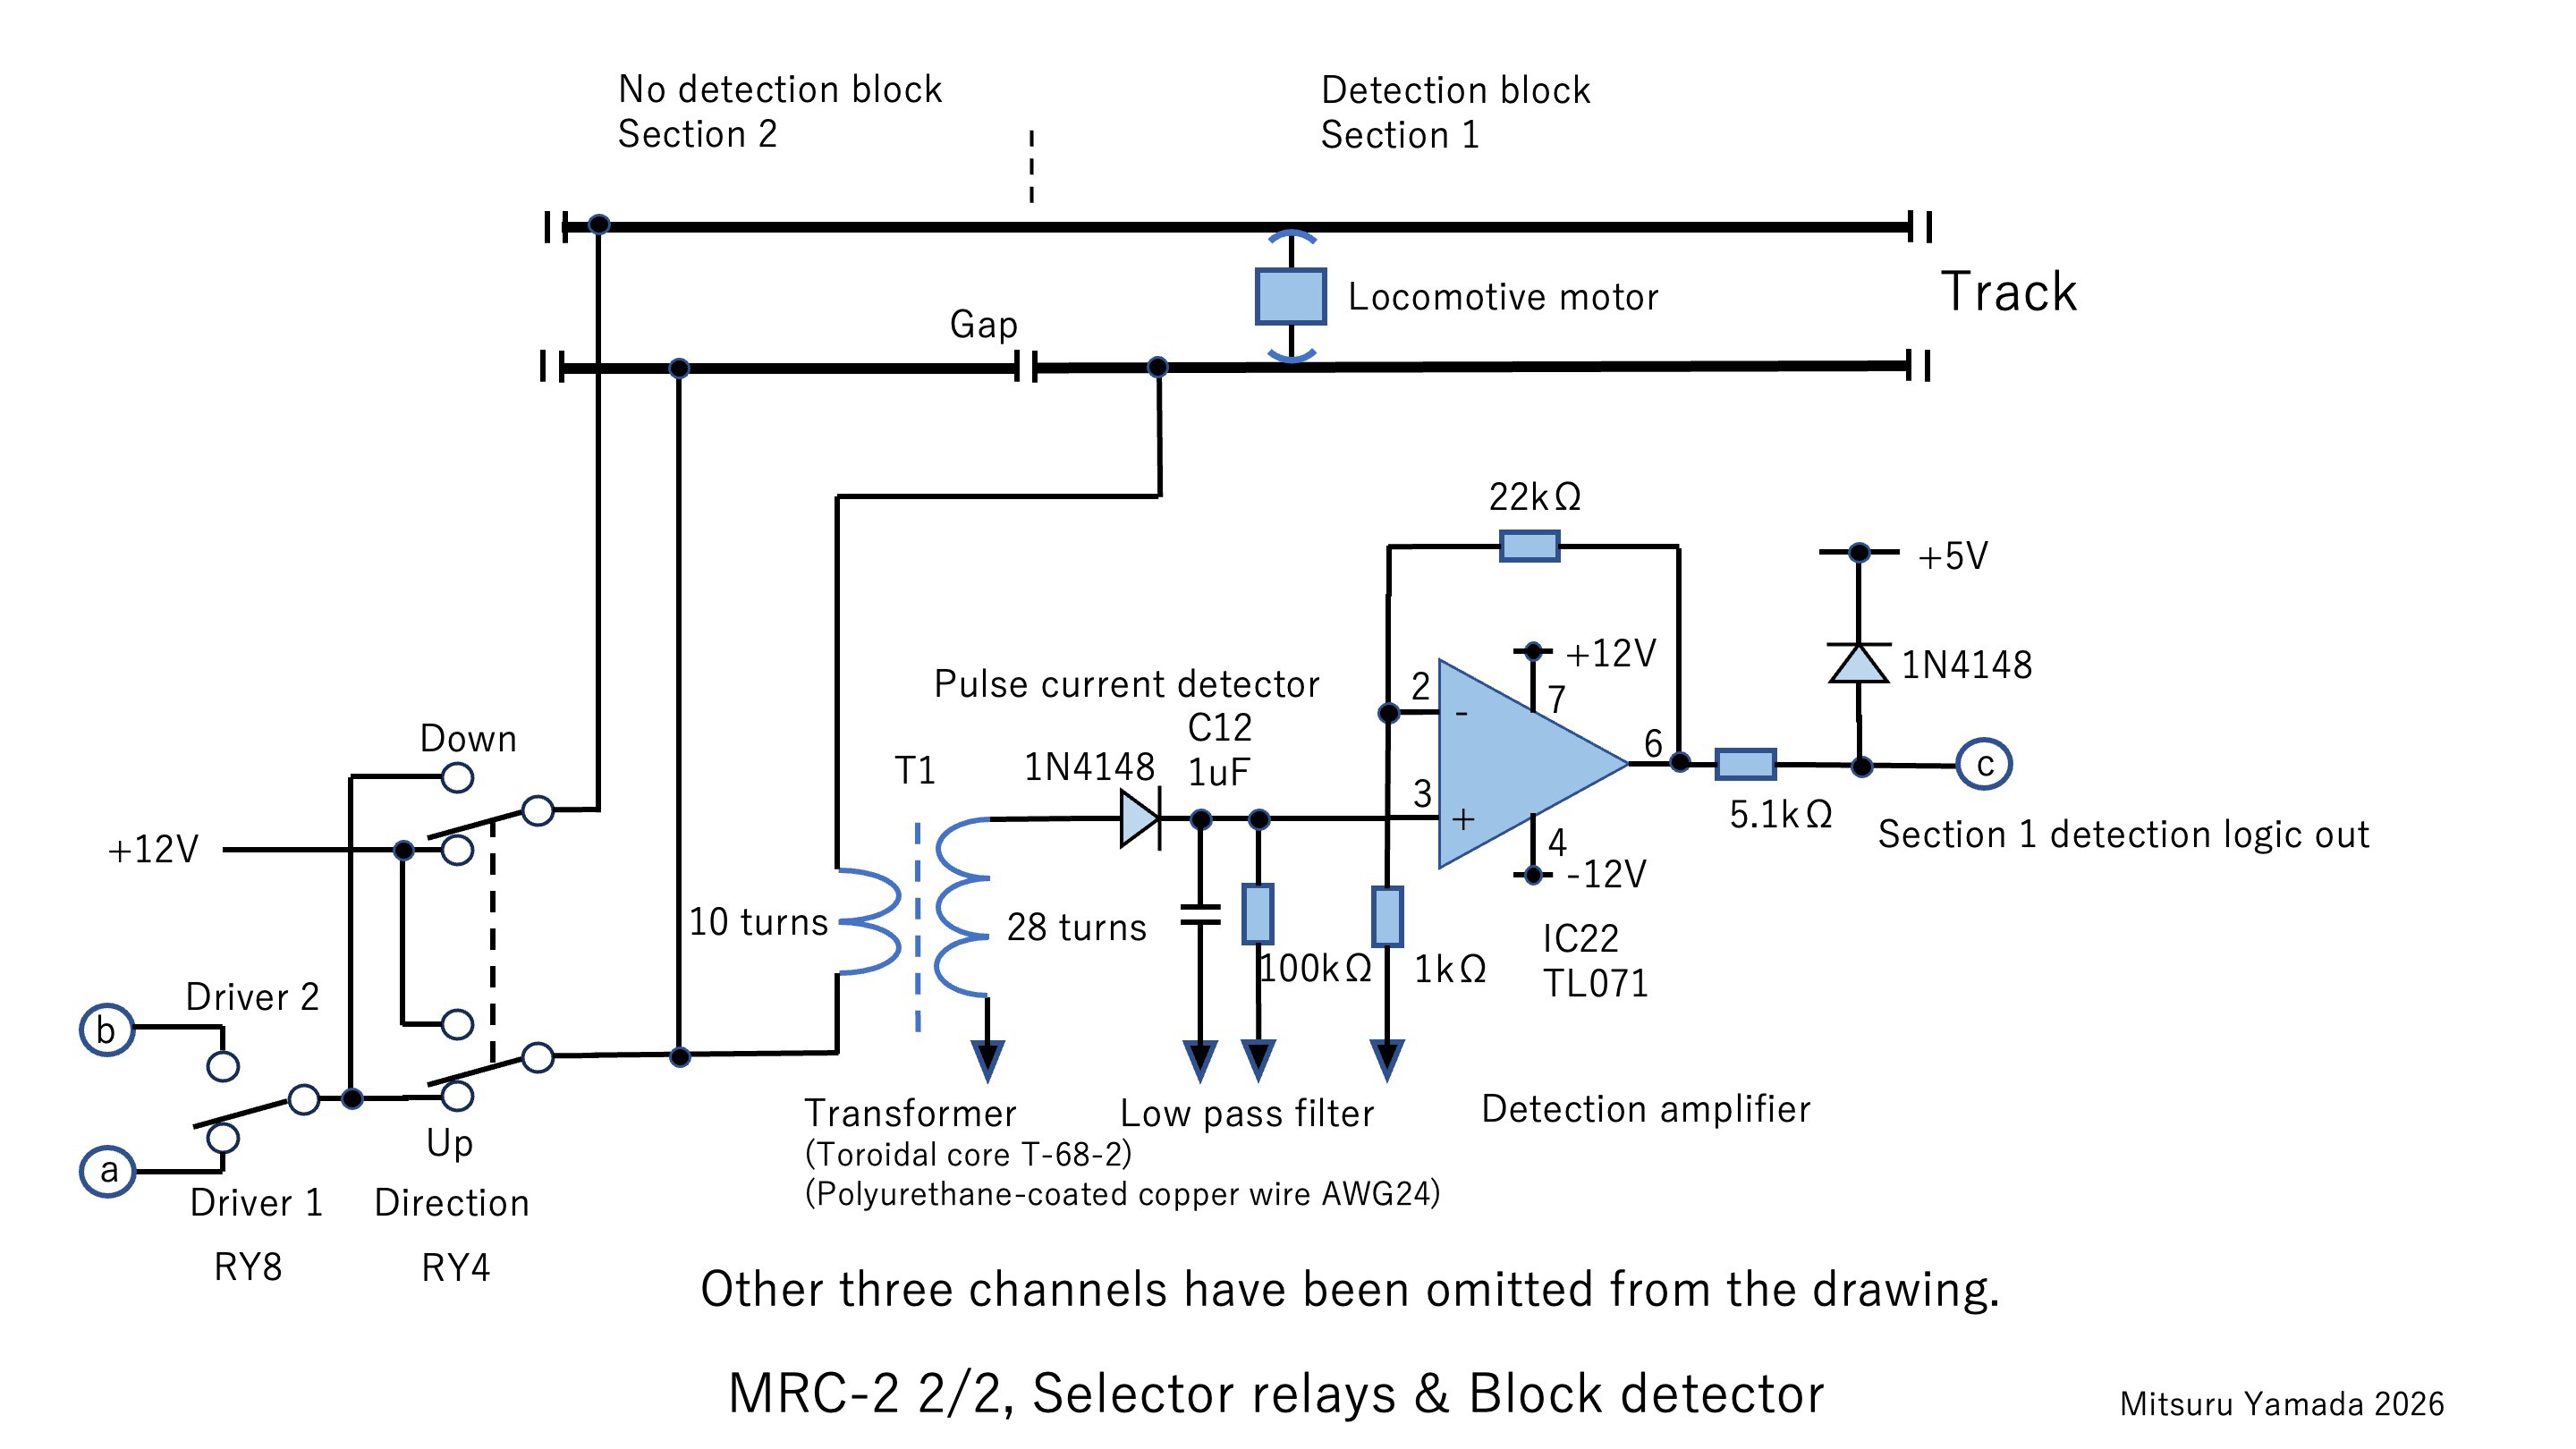
Fig. 8 Selector relays & Block detector.
Figure 9 shows an example of the actual waveform measured at an equivalent point "c" of the block detection circuit for the section 4. The horizontal axis of the figure is scaled at 500 ms/div. The gain of the detection amplifier is 23x. At time point E in Fig. 9, the first of the locomotive’s six sets of current collecting wheels enters the section, and at time point F, all of the locomotive’s current collecting wheels have left the section. Time E corresponds to a “not detected” state in terms of the logic output. It can be seen that a stable detection is established 300 ms after time E, when multiple sets of the locomotive’s current collecting wheels are present on the section. This is likely because the motor current is shunted by the current collecting mechanisms of the multiple wheels. It is believed that the detection voltage from the detection transformer is obtained in direct proportion to the magnitude of the shunted current.
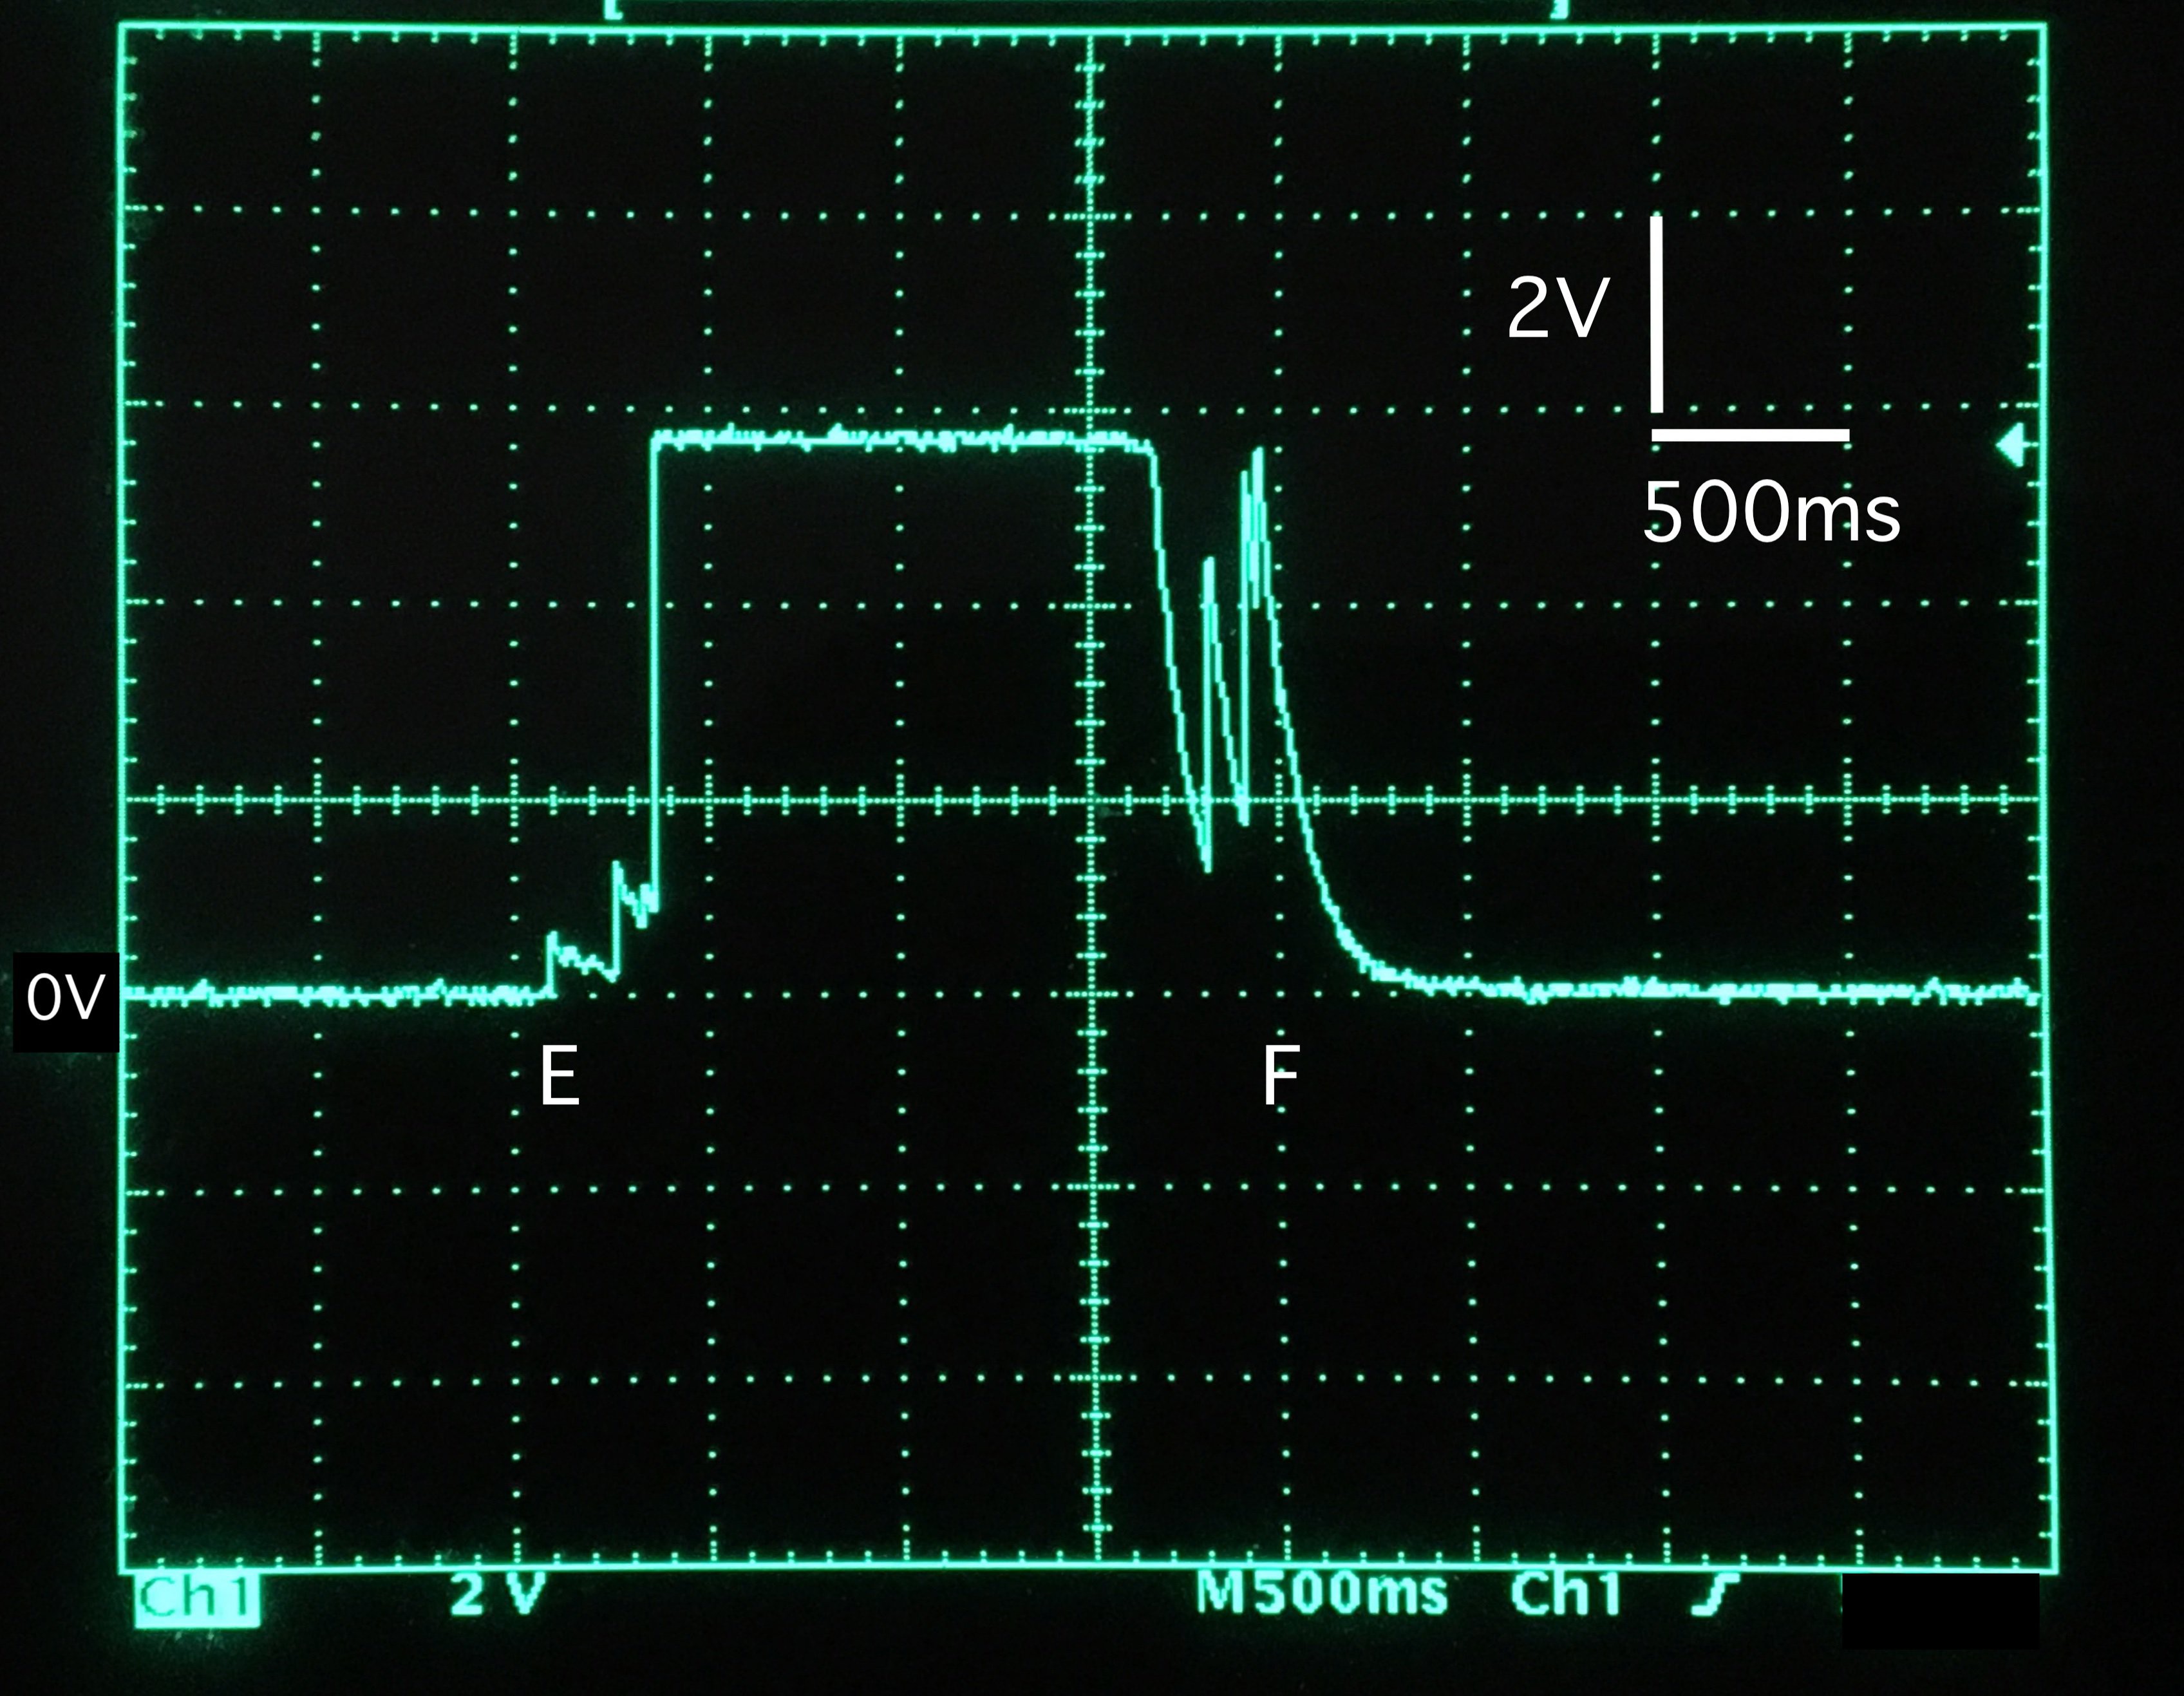
Fig. 9 Waveform example of the block detection signal output (amplifier gain 23x).
Figure 10 shows an example of an actual measured waveform obtained by setting the gain of the detection amplifier to 101x and having the locomotive pass through the section 4. Under these conditions, a stable detection voltage is obtained starting from time E, when the first of the locomotive’s six sets of current collecting wheels enters the section. This indicates that increasing the gain of the detection amplifier is more effective for detecting the locomotive’s entry into the section earlier. However, with my track layout, false detections due to noise sometime occur before the locomotive enters the section 6, and to prevent this, it was necessary to reduce the gain to 23x of the section 6 block detector. Therefore, I have made it possible to switch the gain of the detection amplifier via a switch to facilitate stable future operation and experimentation as shown the full circuit diagram 3/6.
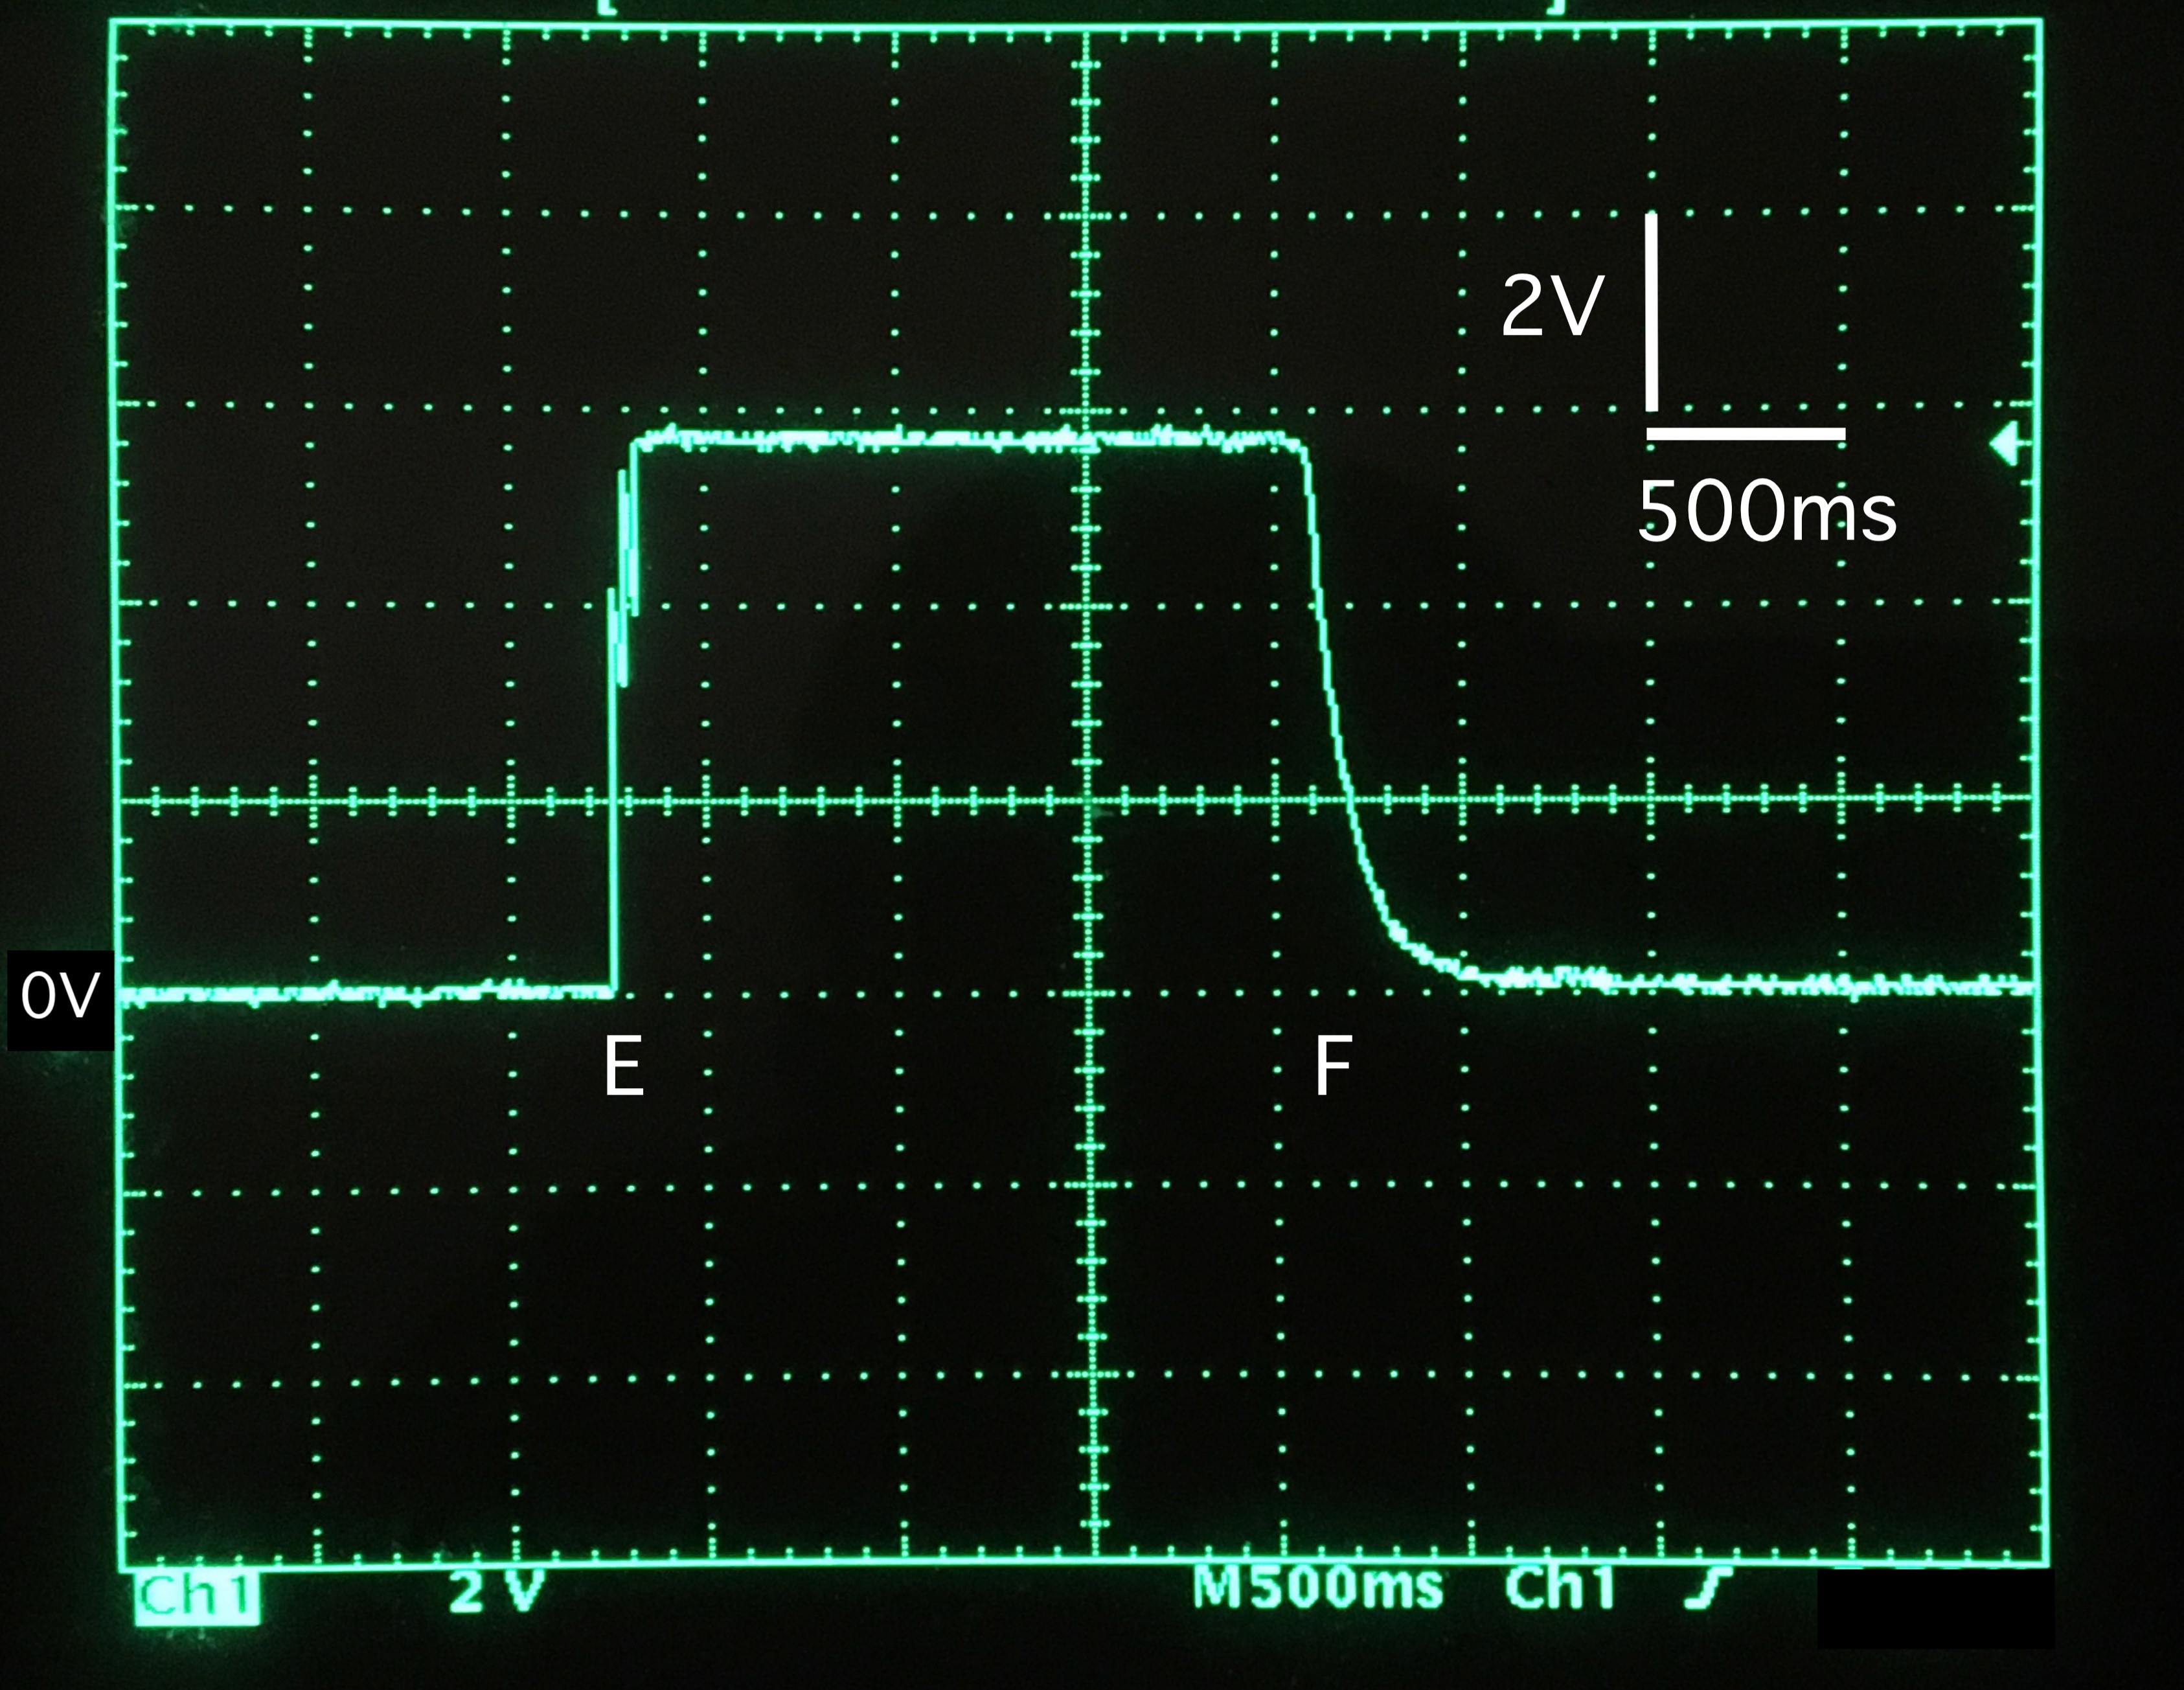
Fig. 10 Waveform example of the block detection signal output (amplifier gain 101x).
5. Evaluation Results
Video 1 shows the block detection testing, and the automatic operation of a passing siding performed by two opposing locomotives. Video 2 shows footage of the trains run in a scenery. The MRC-2 is connected to the parallel interface of the PERSEUS-9, a homemade 8-bit computer based on the 6502 CPU, and the automatic operation sequence is programmed using an application program for the homemade interpreter CI-2. The system is able to continue automatic operation, traveling back and forth along the 2.4-meter-long track in approximately 2 minutes.
Due to the short detection section length in the current track layout, when the locomotive’s speed is set too high, the computer would read the signal after detection and issue a stop command, but the locomotive would still mistakenly enter the next section, causing a short circuit on the track. Since this model locomotive is not equipped with an encoder to detect speed, even when driven with the same settings, the speed differs between forward and reverse motion, and the speed fluctuates significantly during prolonged operation. Therefore, it was necessary to fine-tune the speed as needed using the speed adjustment knob on the MRC-2 panel during automatic operation.
Video 1 Automatic operation of a passing siding using MRC-2 & PERSEUS-9.
Video 2 Model trains run in a scenery.
6. Summary
By building a model railway controller primarily using analog circuits, I was able to reevaluate classic analog circuit techniques such as integration and amplification using operational amplifiers. Furthermore, by implementing block detection using a pulse detection transformer and an operational amplifier-based amplifier, I achieved stable detection. Regarding automatic operation, I found that, as one of the applications for the PERSEUS series of my homemade computers and my homemade interpreter, it is sufficiently practical at this scale.
(Posted on Jun. 20, 2026)
(Latest revision on Jul. 10, 2026)