 Alireza Noferesti
Main Operating Screen
After the device is powered on, the main operating screen will appear after a short startup period.
The display is touch-enabled, allowing users to operate the device directly using their fingers. Alternatively, if a mouse is connected, all on-screen elements can also be selected and controlled using the mouse.
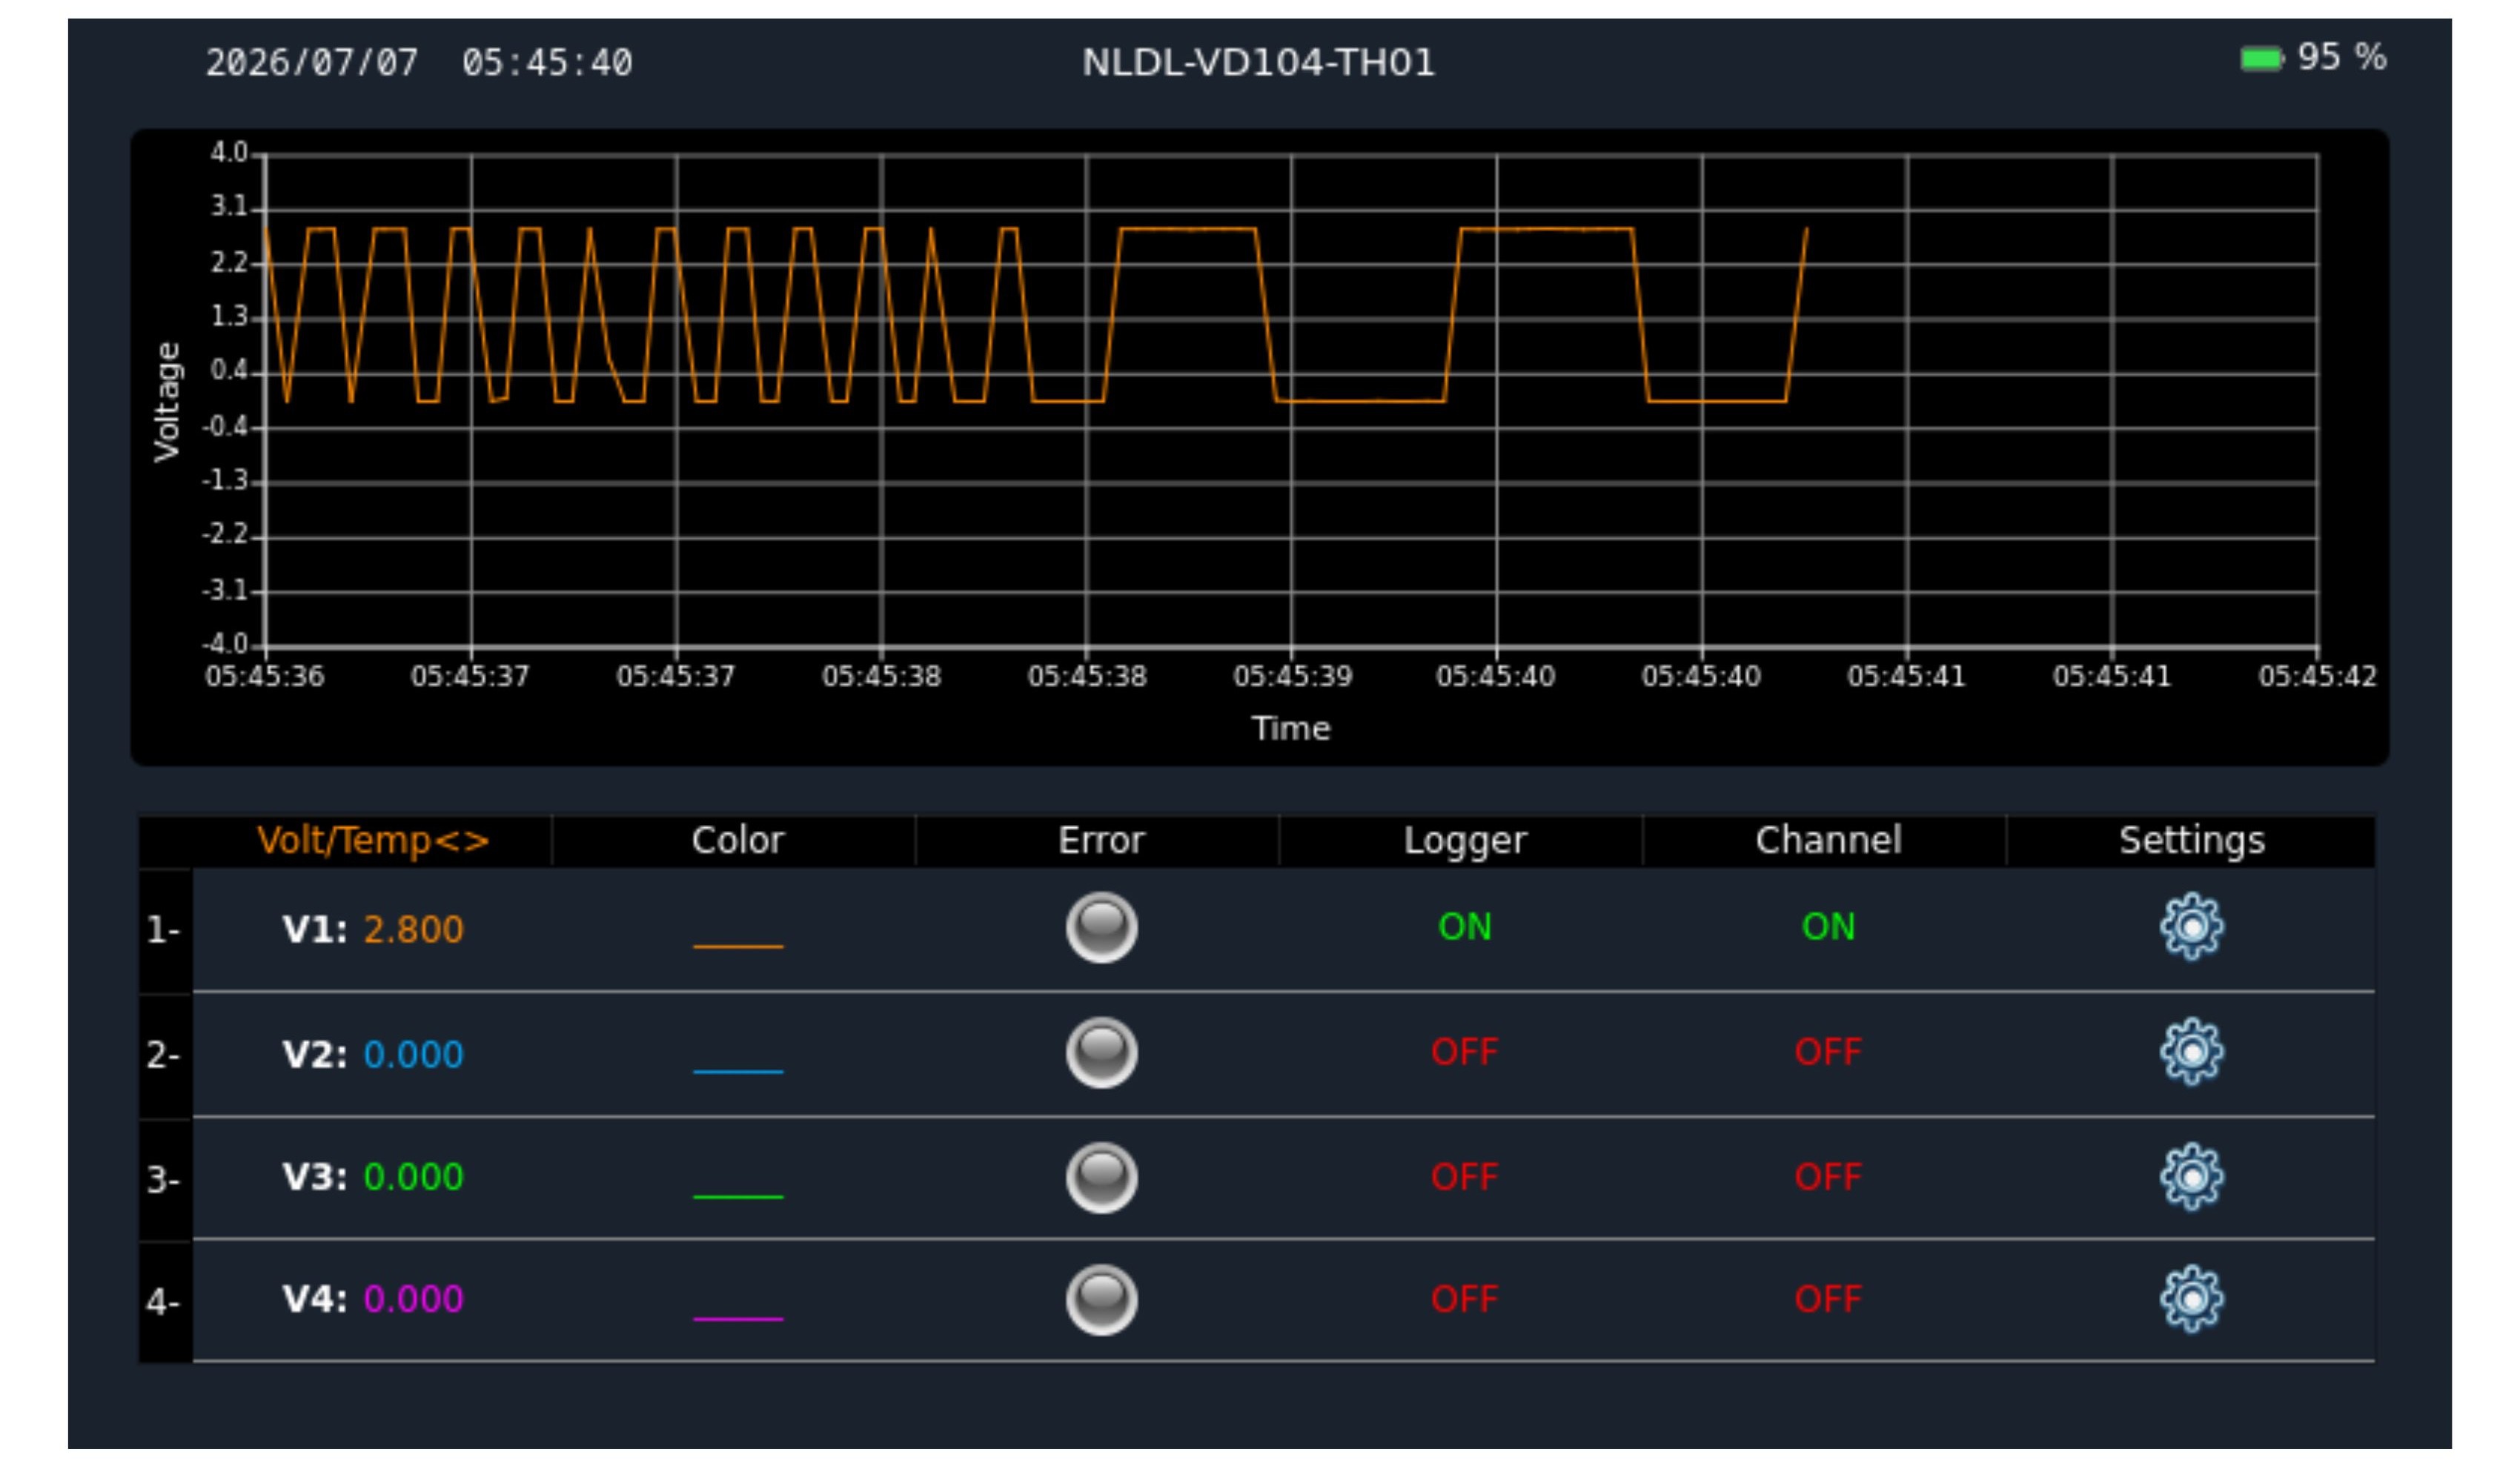
1. Voltage –Time Chart
The voltage–time chart on the main operating screen provides a real-time graphical representation of the measured voltage signals. The horizontal axis represents time, while the vertical axis displays the voltage level for each active channel.
Each differential voltage channel is plotted simultaneously using a distinct color, allowing clear visualization and comparison of signal behavior over time. This chart enables users to quickly monitor trends, detect fluctuations, and identify abnormal conditions or transient events during operation.
The chart is continuously updated based on the selected logging and sampling settings, providing immediate visual feedback of system performance and measurement stability.
2. Battery Status Indicator
The battery status indicator shows the current battery charge level. When the power adapter is connected, a yellow indicator appears on the battery display.
3. Date & Time Display
This display shows the current system date and time, which are used for time-stamping logged data and recorded events.
4. Volt/Temp Button
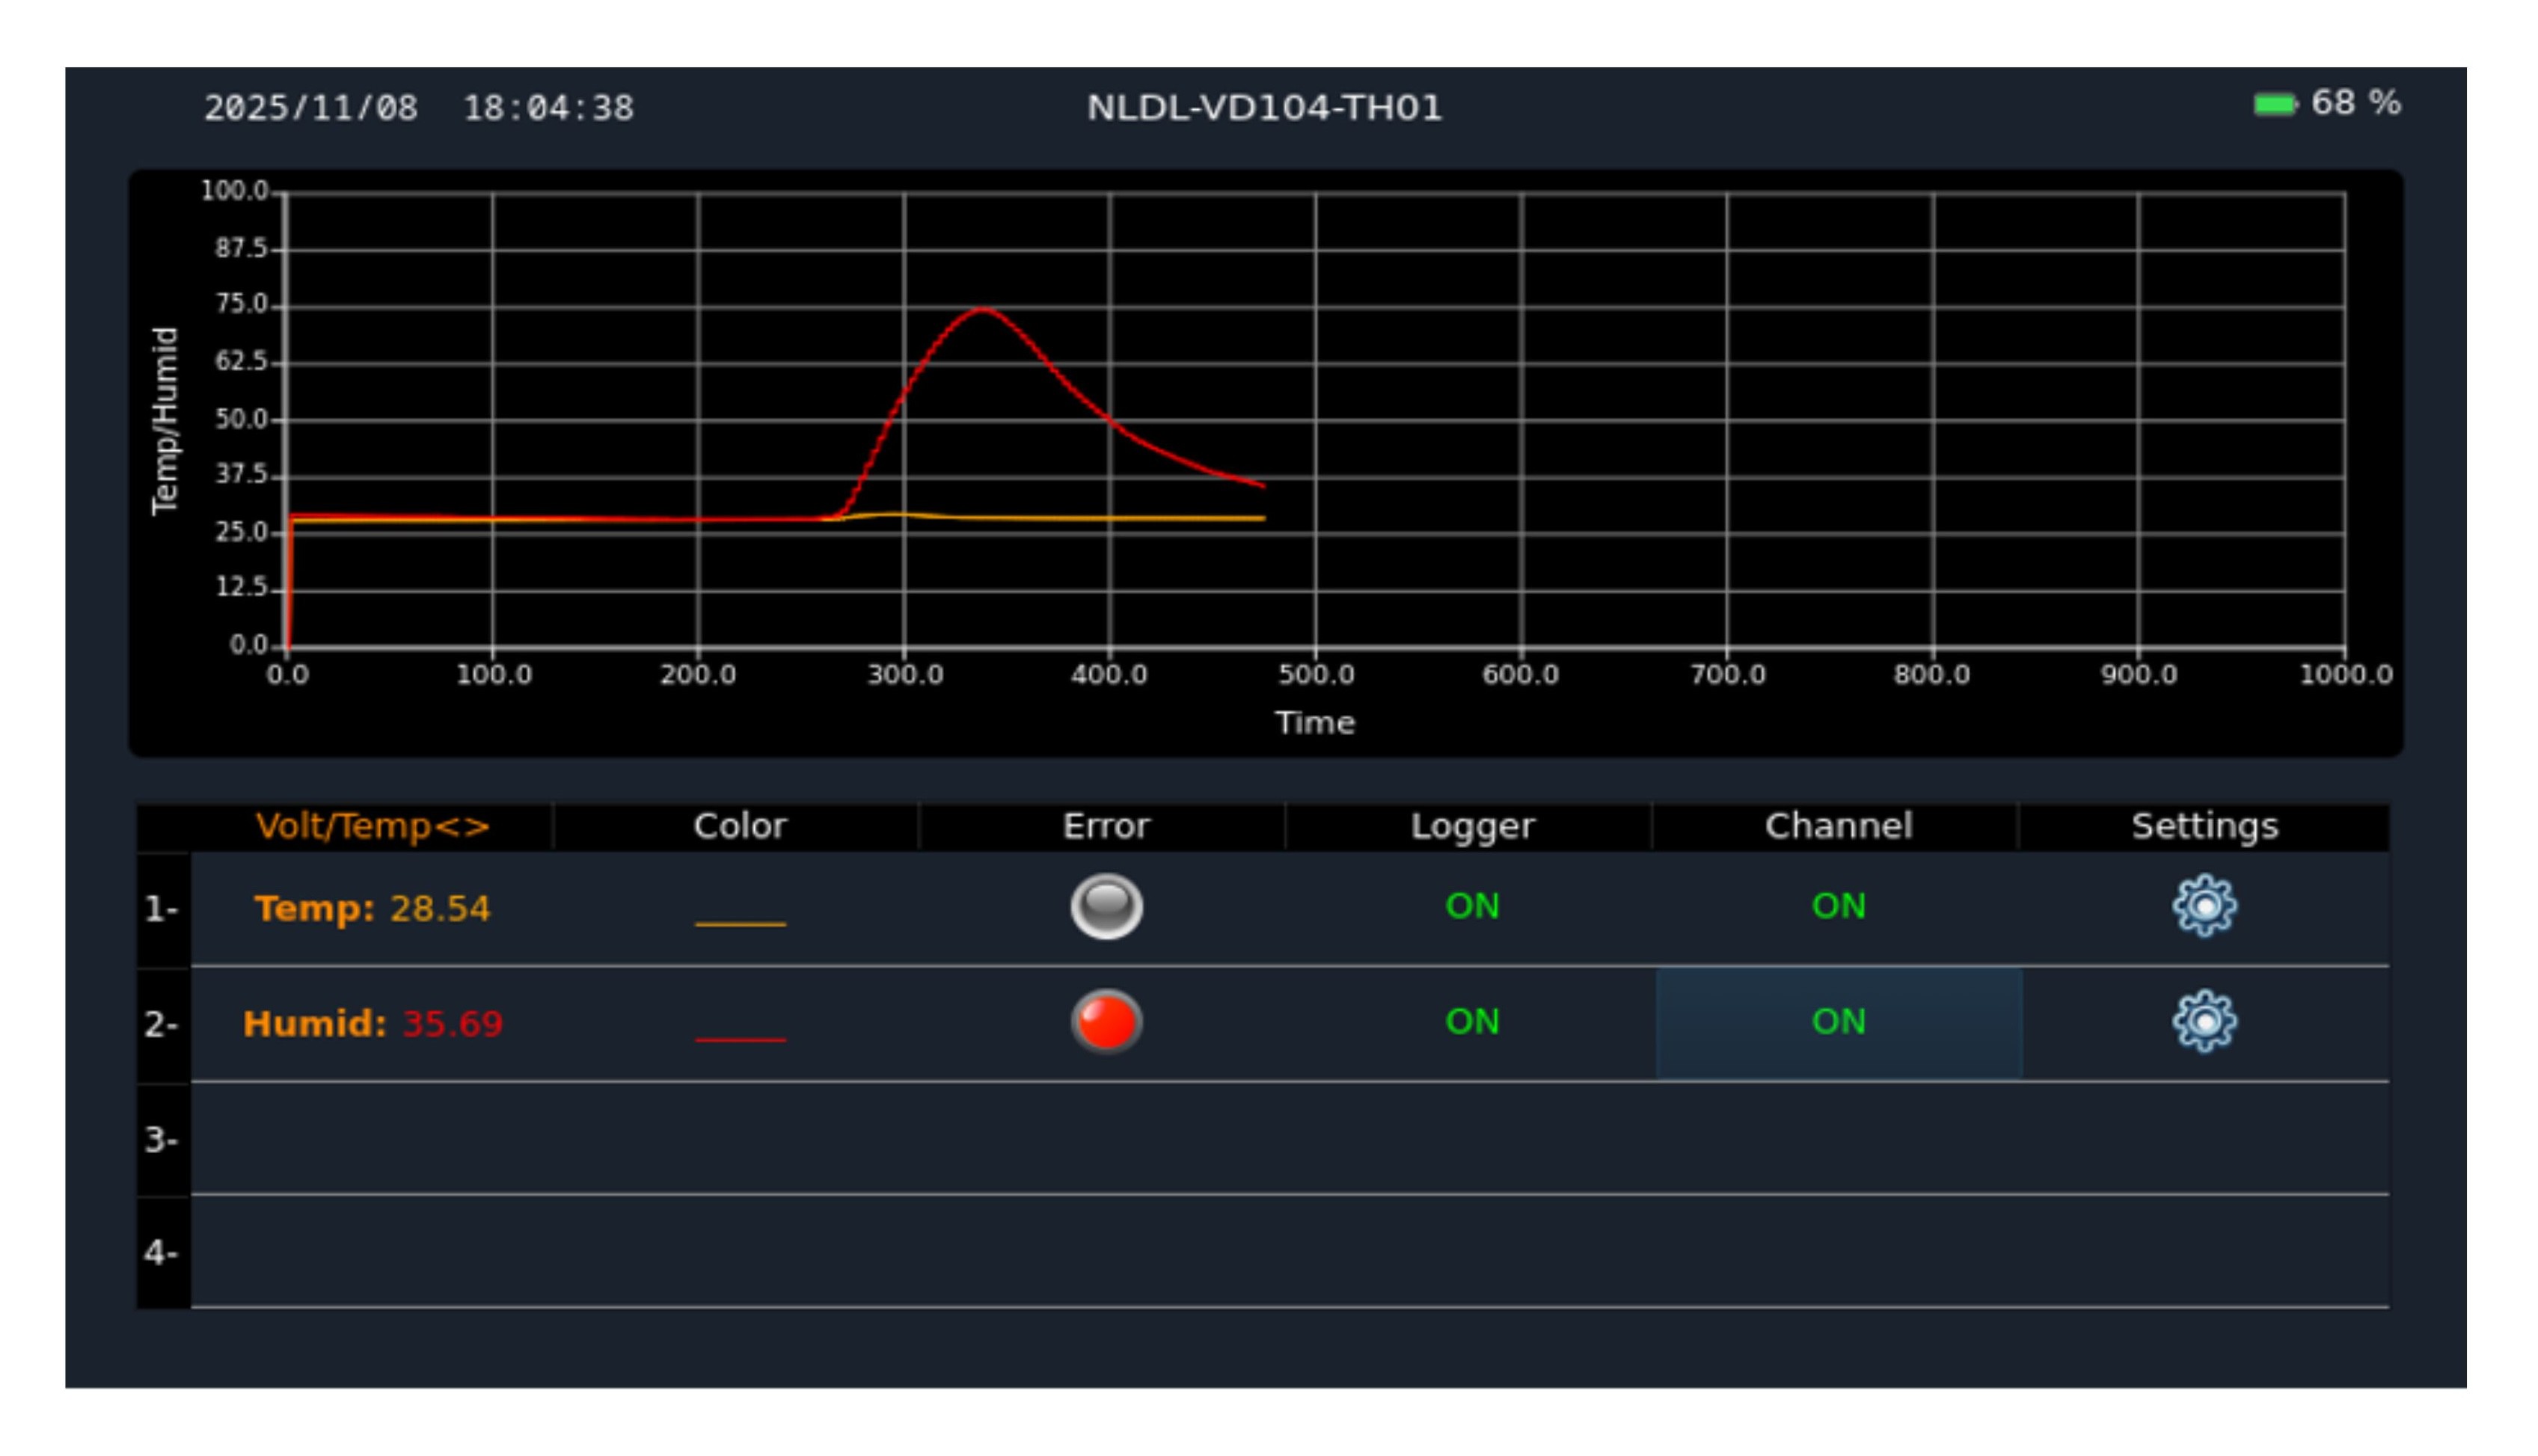
By default, the main screen shows voltage measurements. Pressing the Volt/Temp button toggles the display between the voltage view and the temperature & humidity view.
Color Button
The Color column shows the current chart color for each channel.
Selecting a row opens the color selection screen, where a new color can be assigned to the channel.
Error Indicators
The ERROR column shows the error status for each channel. When an error occurs, the indicator activates and can be cleared by selecting it. Errors remain stored in memory until manually cleared, even after power-off.
Logger Buttons
This control allows the user to turn data logging on or off for each individual channel.
Channel Buttons
This control allows the user to enable or disable the chart display for each individual channel.
Setting Buttons
Clicking the buttons in this column allows access to the configuration settings for each individual channel.
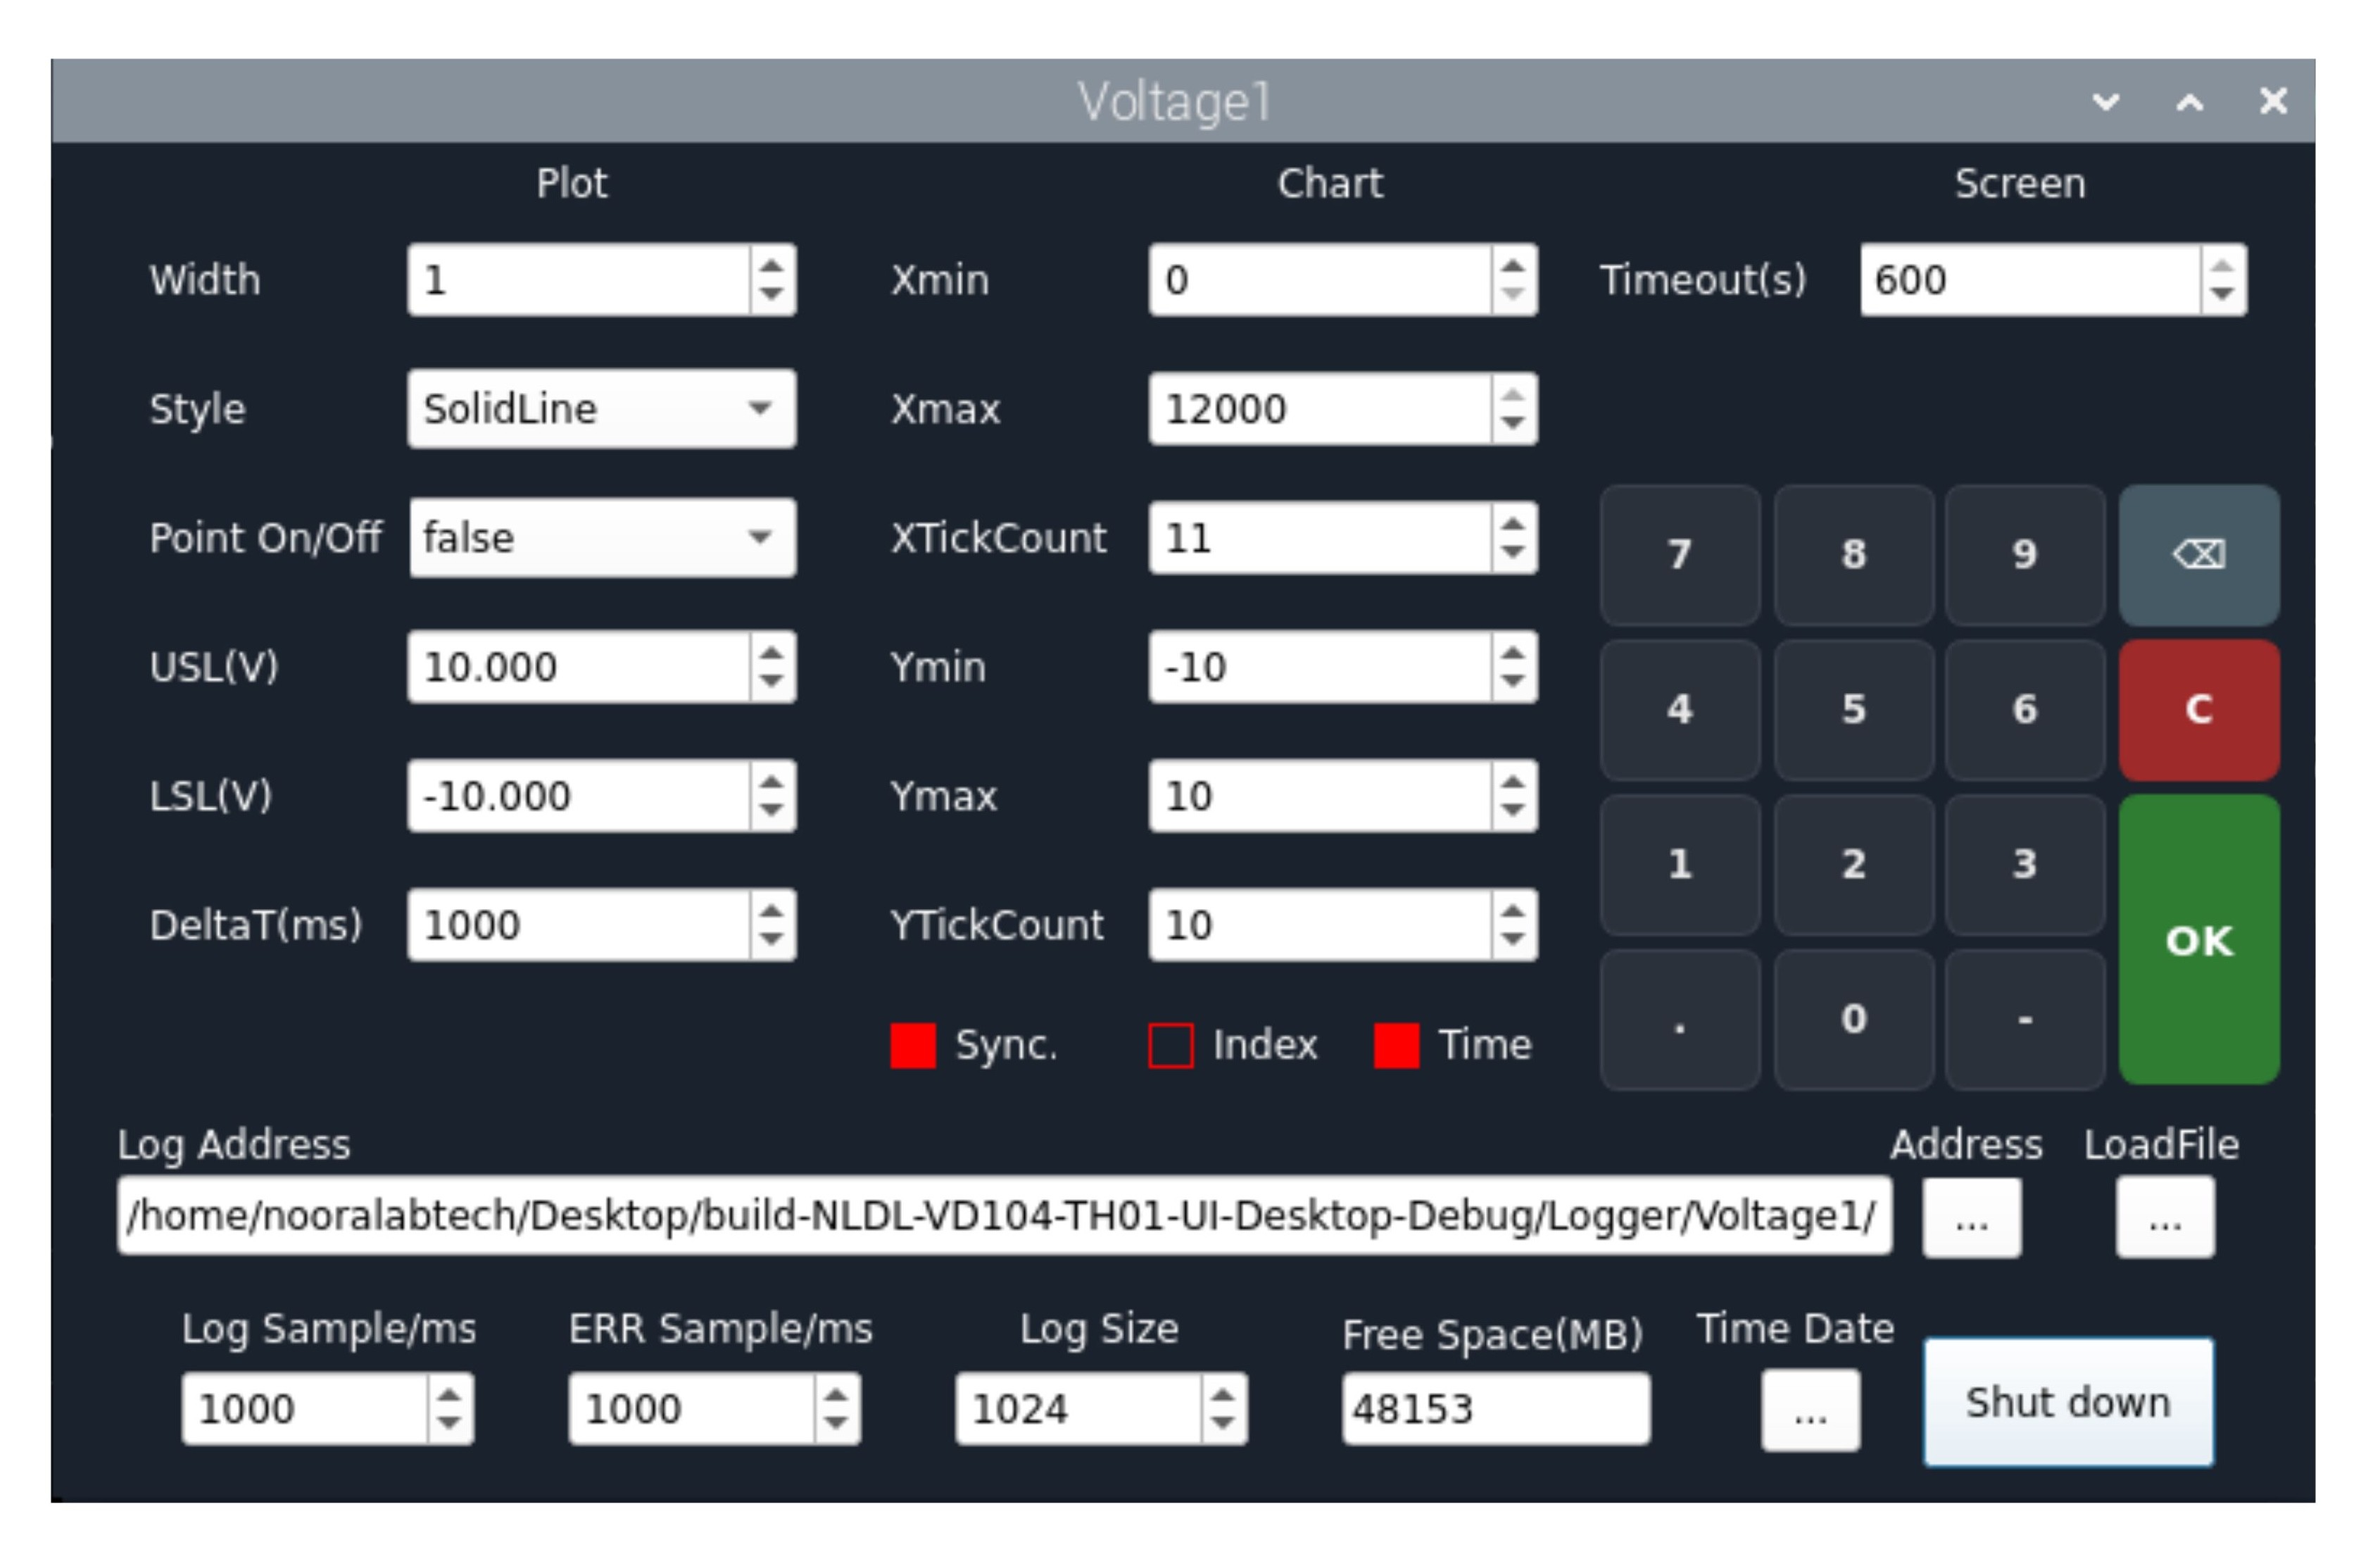
When the channel settings button is selected, the window shown below will open, allowing each channel to be configured individually and separately from the others.
Plot
This section allows you to adjust the chart display characteristics for each individual channel.
Width
Used to adjust the line thickness of the plotted chart.
Style
Used to select the display style of the plotted line on the chart.
NoPen: Enables point-only display mode. After selecting NoPen, set Point On/Off to True to make the points visible.
SolidLine: Displays the plotted line in a continuous solid style. (—)
DashLine: Displays the plotted line in a dashed style. (---)
DotLine: Displays the plotted line in a dotted style. (...)
DashDotLine: Displays the plotted line in a dash-dot pattern. (-.-.-)
DashDotDotLine: Displays the plotted line in a dash-dot-dot pattern. (-..-)
Point On/Off
When this option is set to True, the intersection point of each X and Y data sample will be displayed as dots on the chart. Set to False to hide the points.
USL(V) / (C)
Enter the upper threshold value for the error-detection system. The value is specified in volts (V) for voltage channels and in degrees Celsius (°C) for temperature measurements.
LSL(V) / (C)
Enter the lower threshold value for the error-detection system. The value is specified in volts (V) for voltage channels and in degrees Celsius (°C) for temperature measurements.
DeltaT(ms)
Specifies the sampling interval (time per data point) on the chart in milliseconds.
Chart
Here you can configure the X- and Y-axis settings of the chart for each channel.
Xmin
Minimum value of the X-axis.
Xmax
Maximum value of the X-axis.
XTickCount
Number of divisions (tick intervals) between Xmin and Xmax.
Ymin
Minimum value of the Y-axis.
Ymax
Maximum value of the Y-axis.
Shown according to the device’s internal clock.
YTickCount
Number of divisions (tick intervals) between Ymin and Ymax.
Screen
Timeout(s)
Defines the duration (in seconds) that the display remains active when the device is operating on battery power. When an external power adapter is connected, the display remains continuously on and the timeout function is disabled.
Keyboard
Used for manually entering numerical values via the pop-up keypad. After entering a value for a selected parameter, press the OK button to confirm and store the value in memory.
Sync (Index / Time)
Sync
When Sync is enabled, the values of Xmin, Xmax, XTickCount, and DeltaT are unified across all series. In this mode, changing any of these parameters in the selected series menu will automatically apply the same settings to all other series.
When Sync is disabled, each series operates independently, and changes made to one series do not affect the others.
When Sync is enabled, the X-axis can be configured in either Index or Time mode, allowing the X-axis to be displayed as a numerical index or as a time-based axis, respectively.
Index / Time
Selecting Index displays the X-axis as a numerical index. Selecting Time displays the X-axis as a time-based scale synchronized with the system time, allowing data to be shown according to the device’s internal clock.
Logger
Logger Address
Displays the file path where the logger stores the recorded data.
Address
Used to change or select a storage directory for data logging.
Load File
Opens the storage folder associated with the selected channel’s logger. Depending on the amount of stored data, opening the folder may take a few moments. Please wait while the system loads the directory contents.
Log Sample/ms
Defines the data logging interval in milliseconds.
ERR Sample/ms
Defines the error logging interval in milliseconds.
*Fast Error Logger System*:
The Fast Error Logger system allows transient faults to be detected and recorded even when they occur between regular logging intervals. By setting the error logging rate to a smaller value than the main logging interval, the device becomes capable of capturing short-duration anomalies that would otherwise be missed.
Log Size
Specifies the maximum number of recorded data points per file. To maintain smooth system performance, it is recommended not to exceed 5,000 data points per file. New log files are automatically named using the recording start date and time.
Free Space(MB)
Shows the remaining free space of the internal or external storage device according to the selected log file directory.
Shut Down
When this button is pressed, the system initiates a safe software shutdown to properly close all active processes and protect stored data. After the shutdown process is complete and the screen turns off, the user must switch the main ON/OFF power button to the OFF position to fully power down the device.
Time Date
This section allows configuration of the system date and time. To set the correct values, open the Localisation menu, select the country using Set Locale, and then choose the timezone through Set Timezone (Area and Location).
Discussions
Become a Hackaday.io Member
Create an account to leave a comment. Already have an account? Log In.