 Aditya56h
Work date:15–16 September 2026
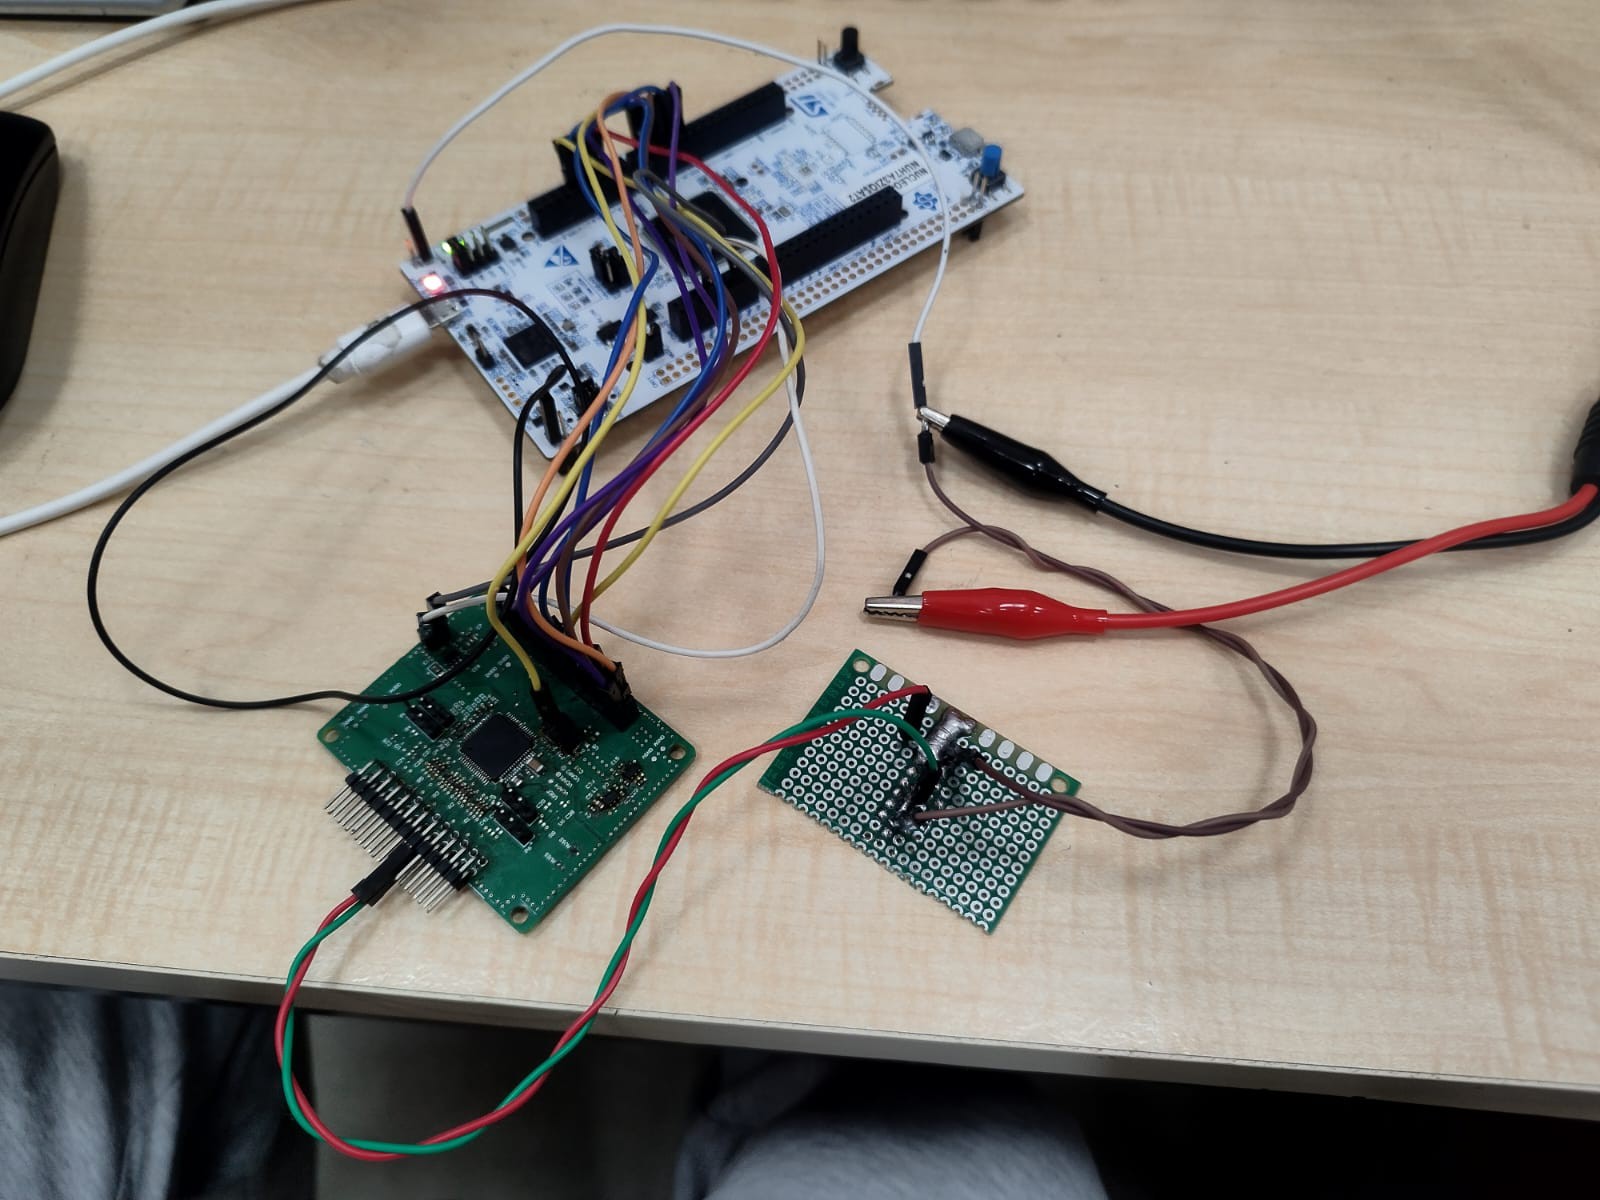
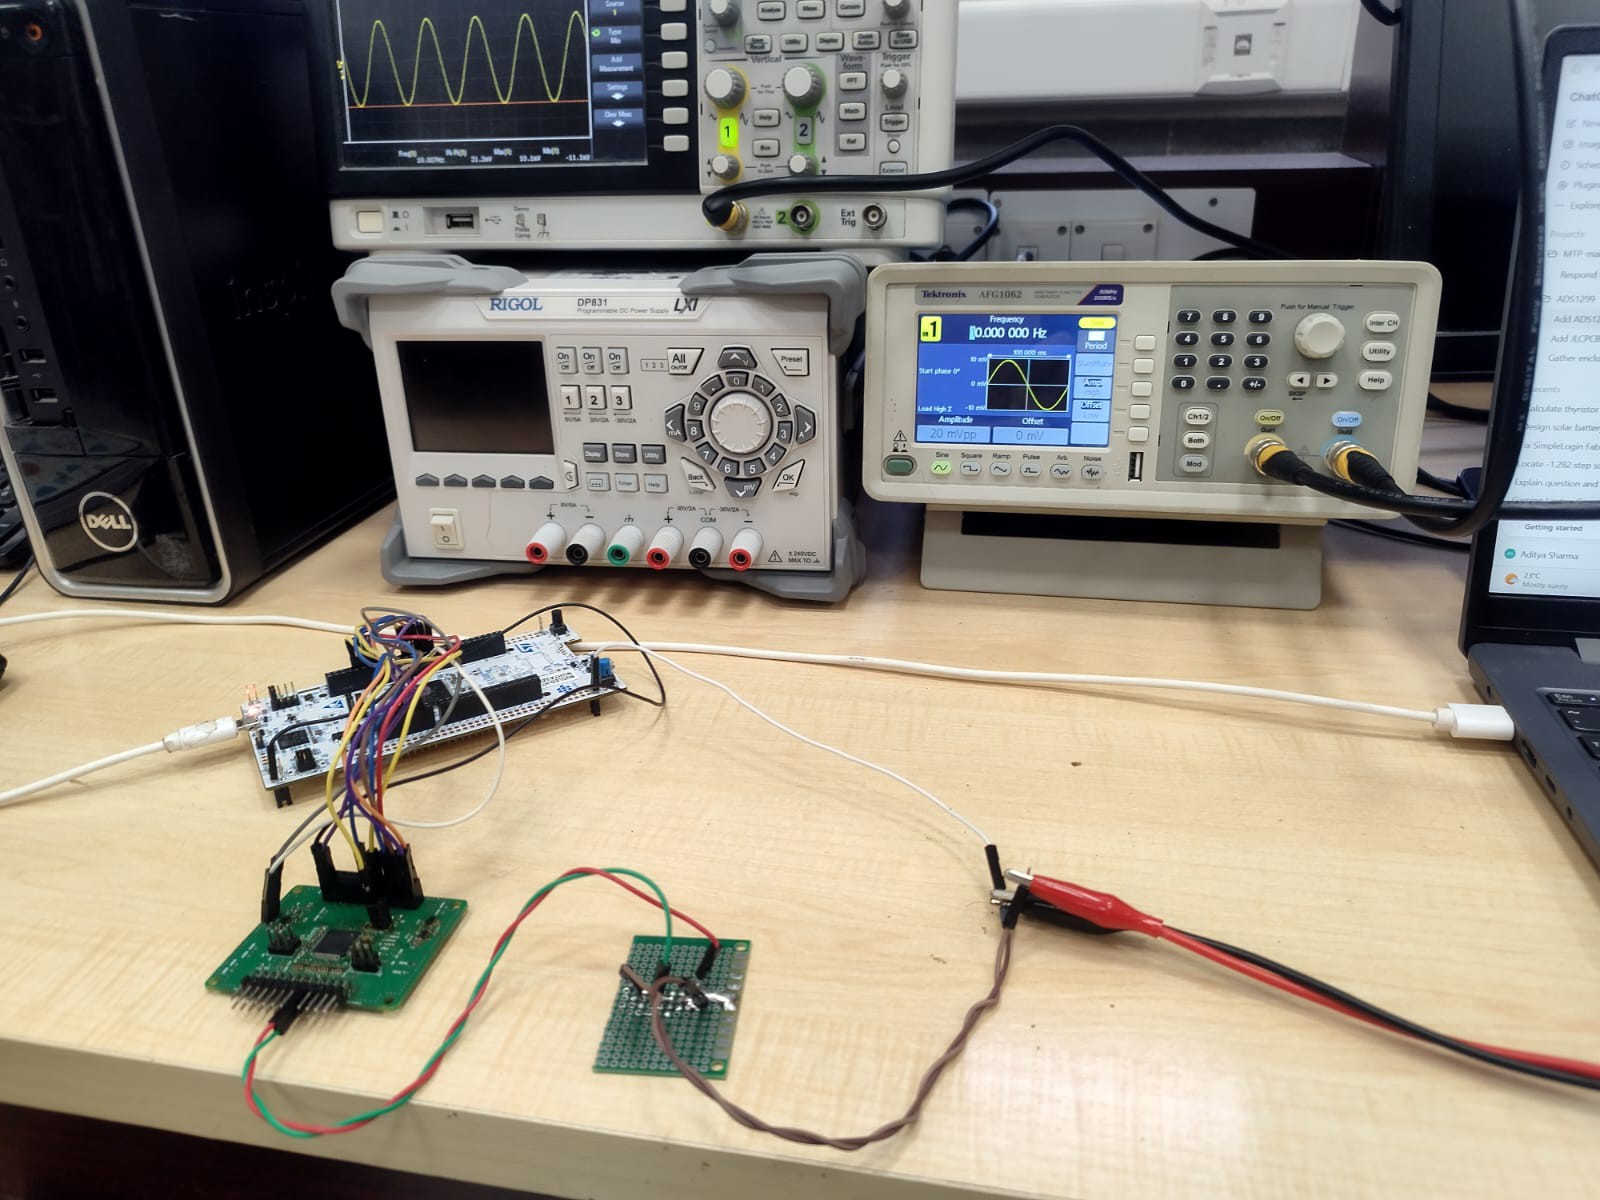
While the custom Analog Board is prepared for its first ADS1299, we have been building the acquisition and measurement workflow around a separate ADS1296 test board.
The original ADS1299 test device failed, so the ADS1296 currently provides a practical way to debug startup timing, SPI transactions, DRDY handling, sample framing, serial transfer and analysis tools. It has six channels instead of eight, and its converter frame is 21 bytes instead of the ADS1299's 27-byte frame. ADS1299 register settings, scaling and noise results will therefore be repeated on the real target hardware.
The test board connects to an STM32 NUCLEO-H7A3ZI-Q. Current controlled captures use a 2.048 MHz external clock, 2 kSPS data rate and the converter's internal 4 V reference. A 47 kΩ/49.9 Ω divider reduces the function-generator output to a microvolt-level differential input.
The firmware verifies the device identity and configuration registers before capture. Saved samples retain the channel number, sequence, status, gain, reference, raw code and calculated input voltage. We are recording both internally shorted channels and known sine inputs, including 5 Hz, 10 Hz and 40 Hz tests.
The all-channel internal-short captures give a useful comparison between gain settings. At gain 12, the six mean-centered traces measured approximately 0.842–0.912 µV AC RMS during this capture. At gain 1, the six values were approximately 4.093–4.296 µV AC RMS. These are ADS1296 test-platform results under the recorded bench conditions, not final ADS1299 or complete-system noise figures.
Known-input tests used the resistor divider to translate generator settings into microvolt-level differential signals. With a 4 mVpp generator setting, the ideal divider output is approximately 4.24 µVpp. The gain-12 Channel 3 capture shows the injected tone near 9.9 Hz together with an observed 49.8 Hz mains component. A zero-phase 15 Hz low-pass view retains the test tone while reducing the 50 Hz region for analysis.
A second test used 10 mVpp at a nominal 10 Hz, corresponding to approximately 10.6 µVpp ideally at the converter input. The raw plot keeps the approximately −610.9 µV DC baseline separate from the mean-centered AC view. The filtered time trace and Welch PSD make the 10 Hz response visible while showing the effect of the 15 Hz analysis filter.
The raw captures remain the measurement record. The filtered traces are analysis views and are not being presented as a change to the converter data.
Discussions
Become a Hackaday.io Member
Create an account to leave a comment. Already have an account? Log In.