 Miles Carter
geomcheck: a mesh validity check in Python for AI-generated models
By Miles Carter · I work on modelfy.art. The six test models below were generated with Modelfy. Logged 3 October 2026.
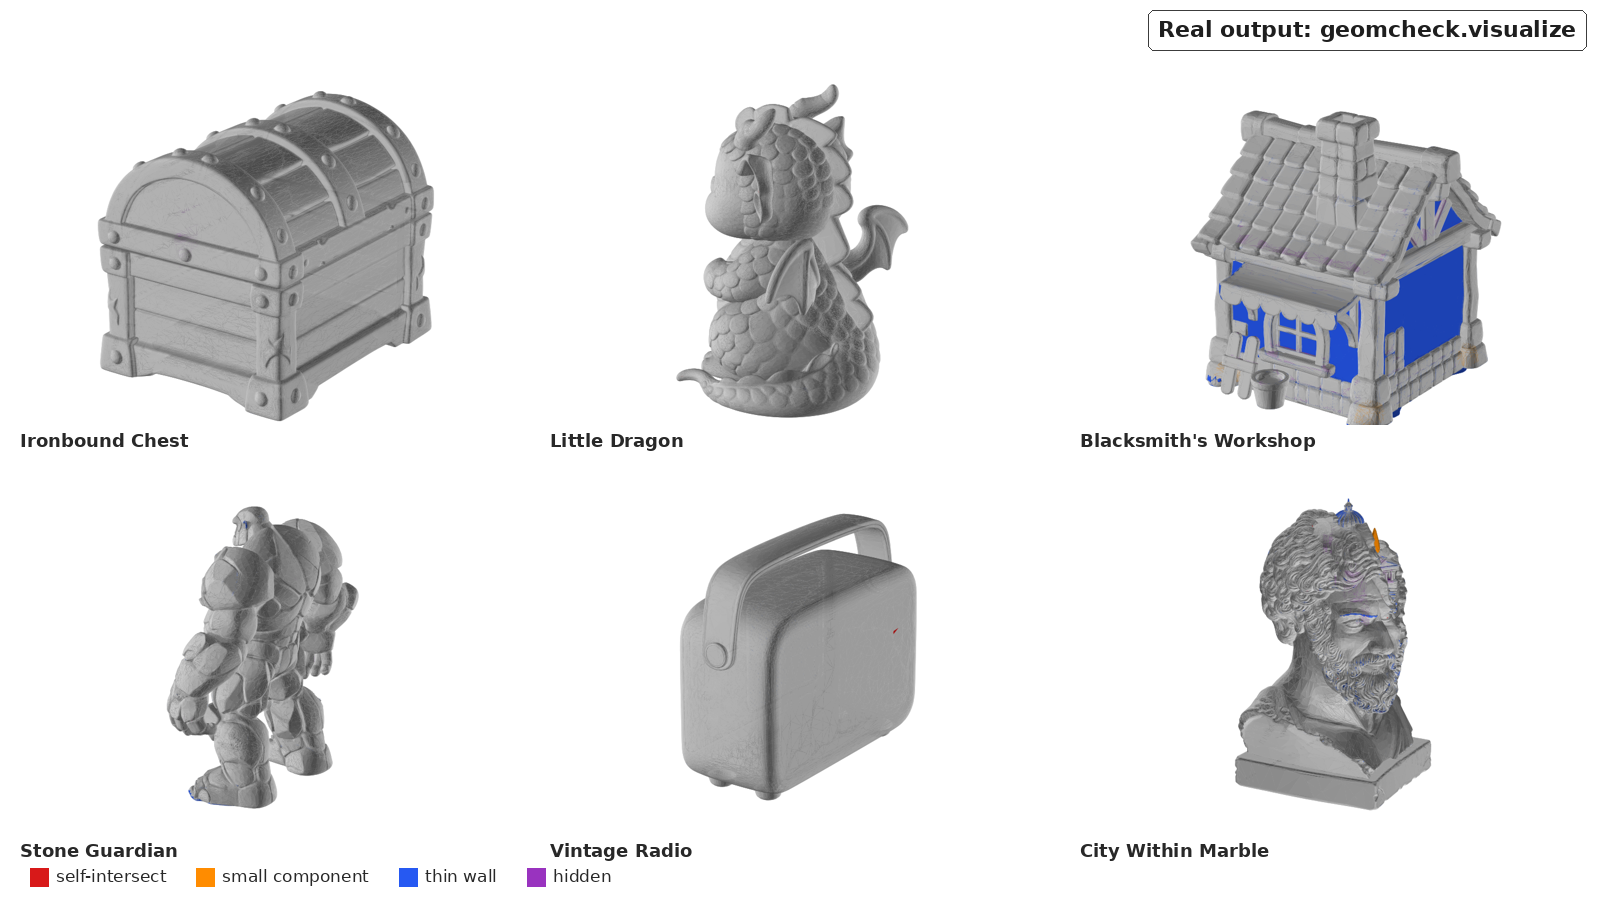
Real output: geomcheck's per-face flags on the six test models. Blue = thin wall, purple = hidden, orange = small separate piece, red = self-intersection.
What it is, in one paragraph
geomcheck answers concrete questions about mesh geometry: does it have holes, extra pieces, crossing faces, surface nobody can see, or walls too thin to print? Everything is computed on a copy scaled so the bounding-box diagonal is 1, so thresholds work at any model size. Random sampling uses a fixed seed. There is no learned model, no training and no GPU. It does not tell you whether a mesh looks good. The study it came from was built to measure exactly that gap (see "What it can't measure").
Log 1: install from a clean environment
The docs show pip install geomcheck, but when I checked on 3 October 2026 the package was not on PyPI yet (the PyPI simple index returned 404). Installing straight from GitHub works:
python3 -m venv .venv
.venv/bin/pip install "geomcheck[viz] @ git+https://github.com/Stark-Will/geometric-probes-3d"
In a fresh Python 3.13.5 venv this pulled in trimesh 5.1.1, PyMeshLab 2025.7.post1 and embreex 4.4.0, plus NumPy 2.5.3, SciPy 1.18.1 and Matplotlib (for the [viz] renderer). On a clone of the repository, pytest -q tests/ passed all 16 synthetic-mesh tests.
One Linux gotcha: PyMeshLab's decimation filter needs the system library libOpenGL.so.0 (sudo apt-get install libopengl0 on Debian/Ubuntu). No display or GPU is needed. geomcheck.decimation_available() returned True on my box. Without that library every probe still runs, but the optional decimation step raises a clear error.
Log 2: run it on six AI-generated models
Test set: six showcase models generated with Modelfy (its backend is Tencent Hunyuan 3D). All six are public on Sketchfab, so you can download the same files: the chest, the dragon, the workshop, the guardian, the radio and the marble bust. I used the Sketchfab-compatible copies, which have meshopt compression removed and PNG textures. Each is about 150k triangles.
The whole script:
import sys, time
from geomcheck import compute_all

for p in sys.argv[1:]:
    t = time.perf_counter()
    r = compute_all(p)                      # full resolution, default thresholds
    nm = round(r["nonmanifold_edge_frac"] * r["n_edges"])
    print(p, r["n_faces"], r["watertight"], nm, r["n_components"], r["n_small_components"],
          f'{100*r["self_intersect_face_frac"]:.3f}', f'{100*r["hidden_surface_frac"]:.2f}',
          f'{100*r["thin_frac_0.005"]:.2f}', f"{time.perf_counter()-t:.1f}s")
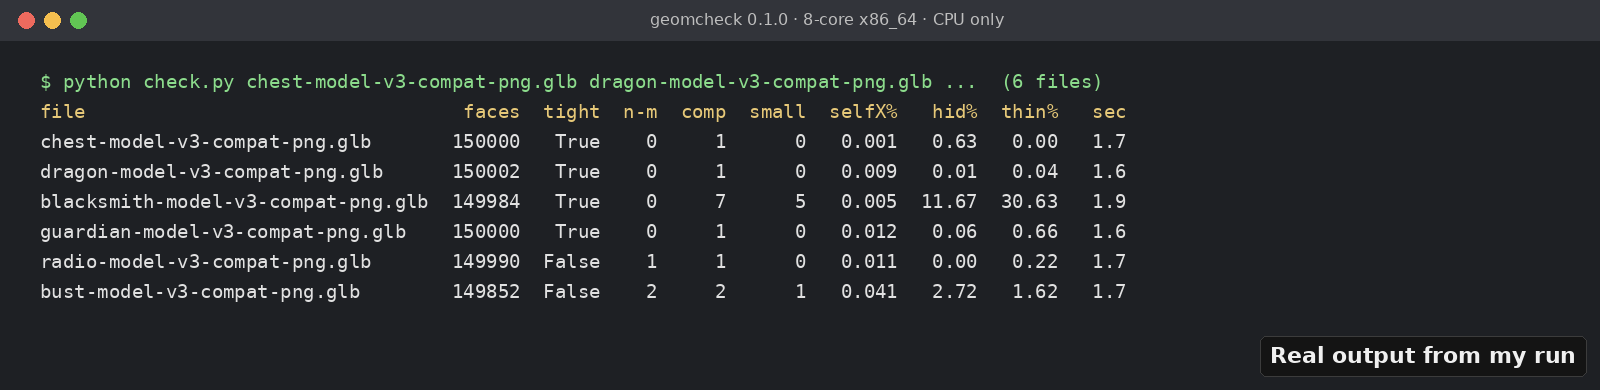
Real output from my run (formatted version of the script above), 8-core x86_64, CPU only.
| File | Closed solid? | Edges with 3+ faces | Parts / under 1% area | Crossing faces, full res → decimated | Never-visible surface | Surface under 0.005 diag |
|---|---|---|---|---|---|---|
| chest | yes | 0 | 1 / 0 | 0.001% → 0.000% | 0.63% | 0.00% |
| dragon | yes | 0 | 1 / 0 | 0.009% → 0.000% | 0.01% | 0.04% |
| workshop | yes | 0 | 7 / 5 | 0.005% → 1.170% | 11.67% | 30.63% |
| guardian | yes | 0 | 1 / 0 | 0.012% → 0.030% | 0.06% | 0.66% |
| radio | no | 1 | 1 / 0 | 0.011% → 0.020% | 0.00% | 0.22% |
| marble bust | no | 2 | 2 / 1 | 0.041% → 0.190% | 2.72% | 1.62% |
"Decimated" is the same run with decimate_to=10000 (Log 4). None had an open boundary loop. compute_all took 1.5–1.9 s per model in this first pass (Log 7 has cleaner timings). Running it a second time on the bust returned an identical dictionary.
Log 3: what it actually caught
A buried set of blocks in the workshop. "7 pieces, 5 small" sounds like floating debris, so I coloured each connected component. Piece #2 is the anvil: separate but intentional, 4,740 faces. Pieces #3–#7 are five small pad blocks at floor level under the wall corners. Then I crossed the component labels with the per-face visibility flags from geomcheck.visualize.face_flags. All 2,412 faces of those five blocks are hidden, and none of them self-intersects. They sit completely inside the walls. You could delete them and nobody would see a difference, but a slicer would get five extra solids nested inside the walls.
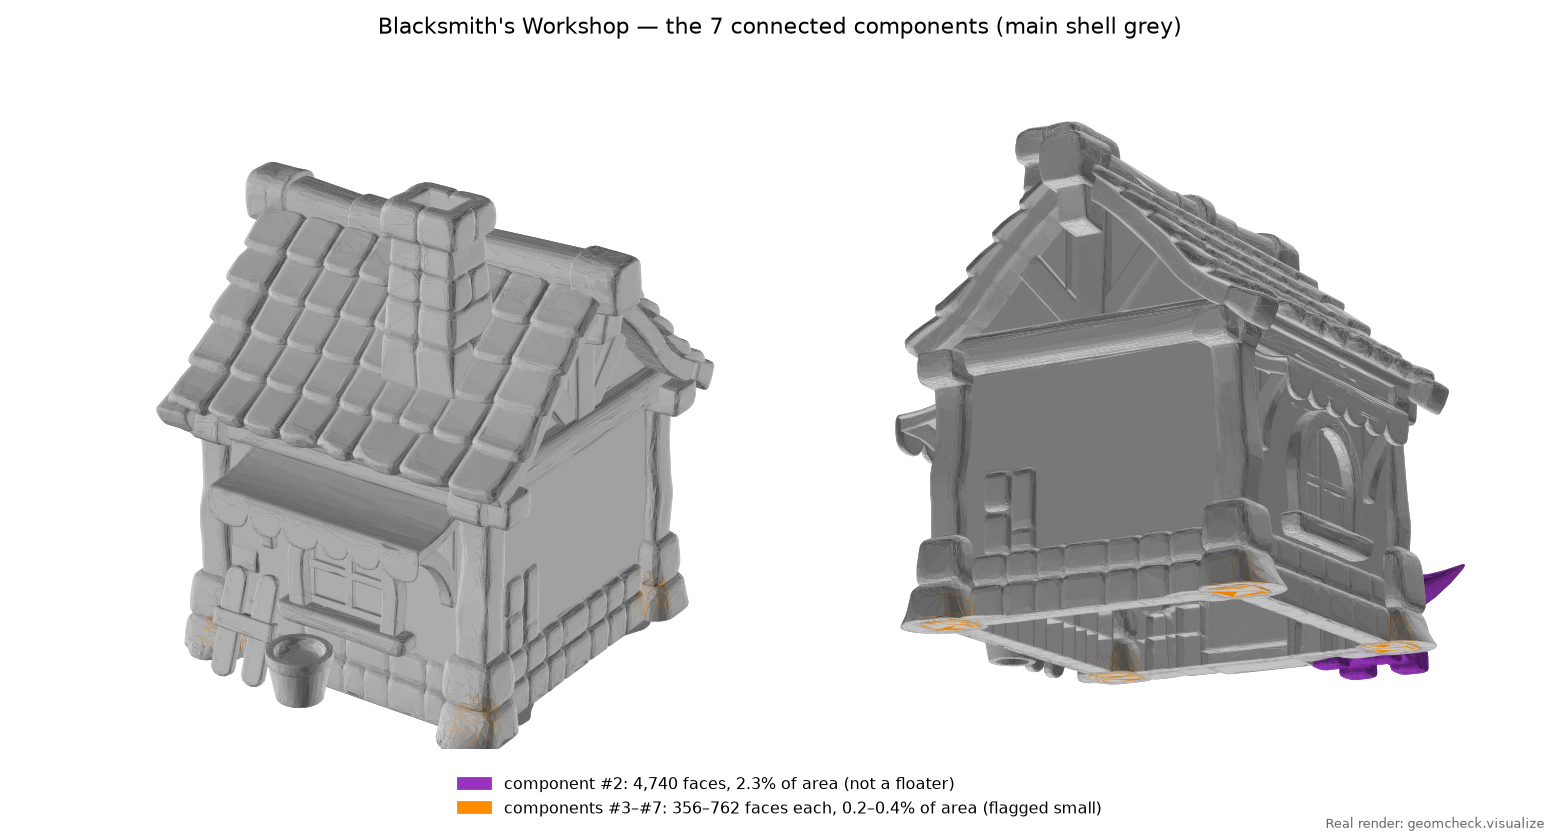
Real render (geomcheck.visualize). Orange = the five small pieces, purple = the anvil, grey = main shell.
Non-manifold edges you can't see. The radio and the bust are the two "not watertight" results, with zero holes. The cause is 1 and 2 edges where four faces meet: one near the radio's lower knob, two in the bust's hair. I located them by listing edges used by more than two faces and projecting their midpoints onto the render.
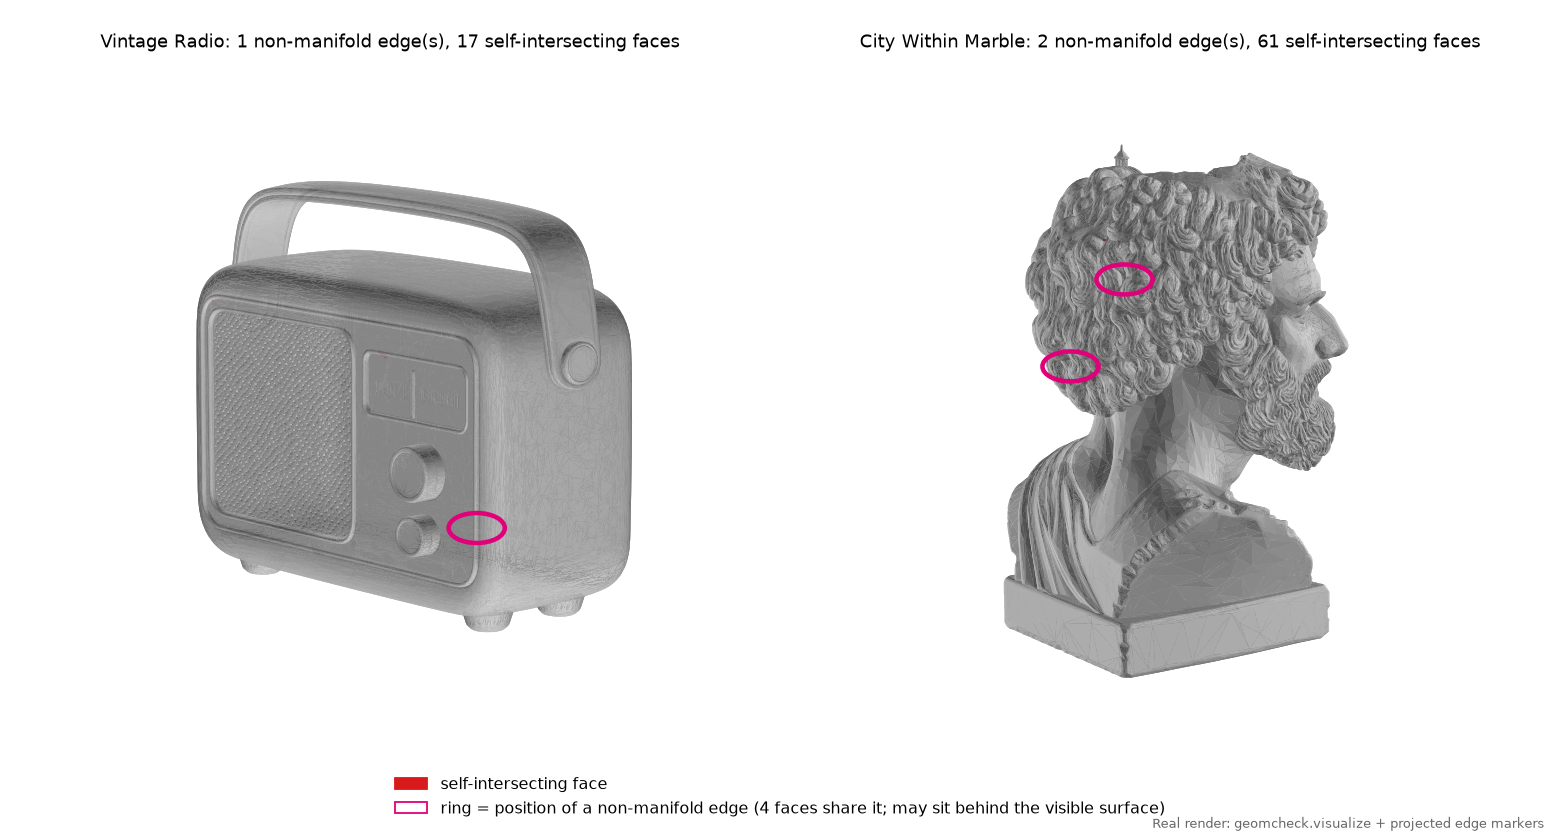
Real render with projected markers. The rings mark positions; the edges themselves are too small to see at this size.
A "floater" that is a tree. The tiny extra part on the bust, a 180-face shell covering a quarter of a percent of the surface, turned out to be a cypress inside the open head. A blanket "delete small components" step would remove something the model is supposed to have. geomcheck counts pieces; deciding what they are is still your job.
Thin walls with a scale problem. 30.63% of the workshop's surface is thinner than 0.005 of its diagonal. Scaled so its longest side is 100 mm, that threshold is 0.83 mm. Thickness is a ratio until you pick a print size.
Log 4: the numbers move if you decimate first
compute_all has a decimate_to option (the paper used 10,000 faces for most of its datasets). I ran all six both ways:
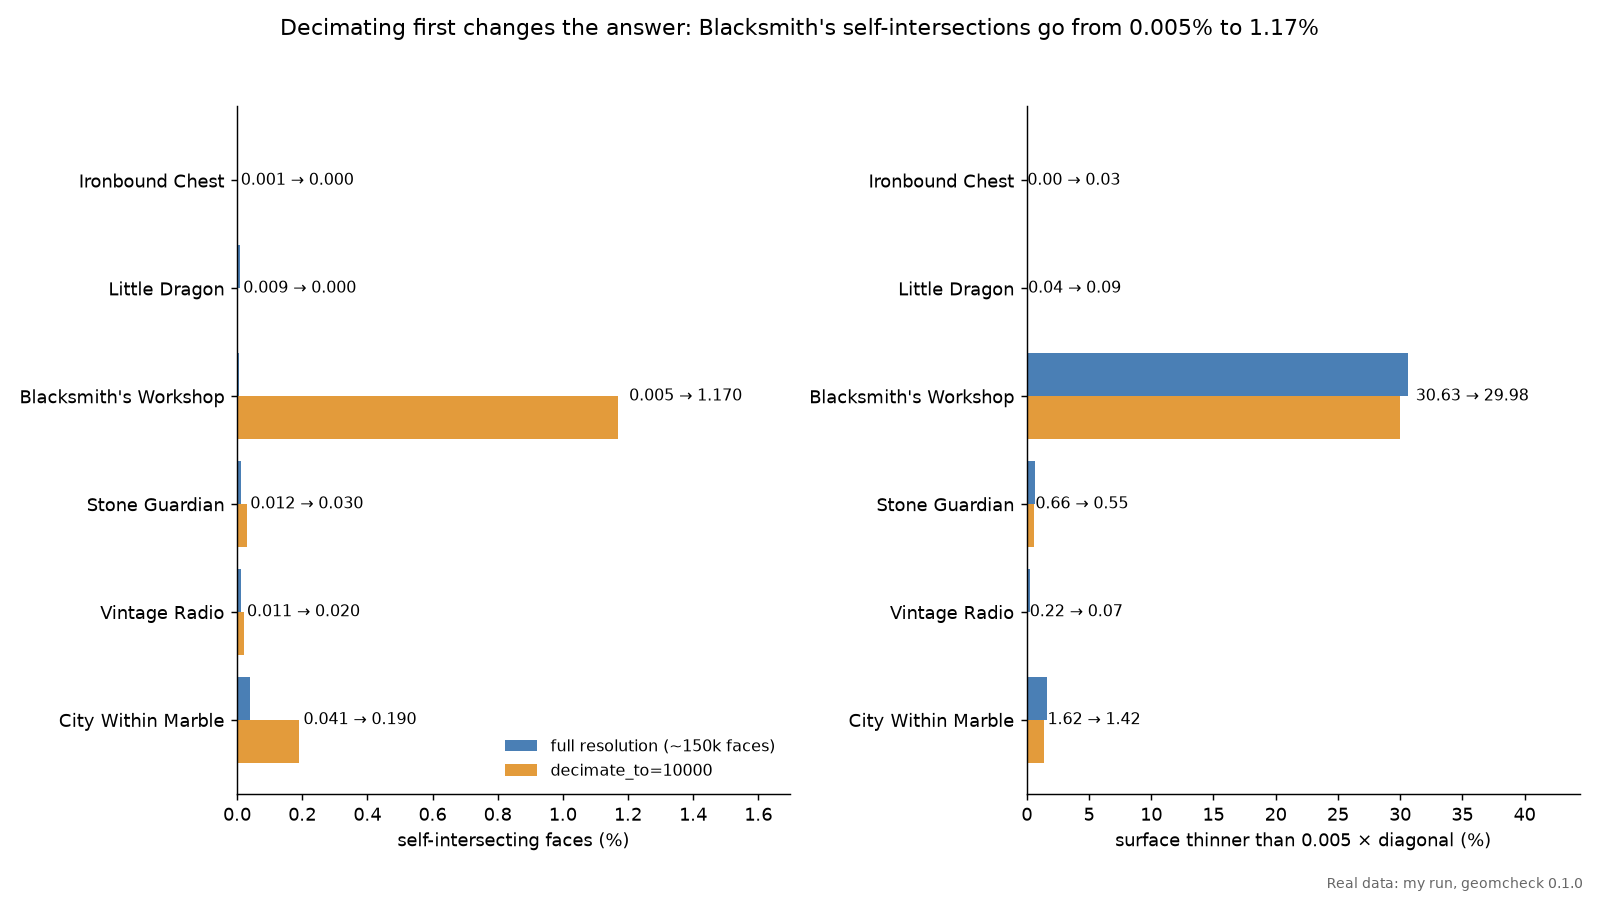
Real data from my run.
Thin-wall and hidden shares barely moved (workshop 30.63% → 29.98% thin, 11.67% → 11.53% hidden). Self-intersection did move: workshop 0.005% → 1.17%, bust 0.041% → 0.19%. Decimating created crossing faces that the original mesh did not have. Pick one setting and keep it, and never compare a decimated number with a full-resolution one. The docs warn about this too, and now I have a concrete case.
Log 5: how much do the thresholds matter?
Every flag in geomcheck is a number compared with a cut-off, and the cut-offs live in one module-level dict, geomcheck.CONFIG. The defaults are reasonable guesses, not laws: thin below 0.005 of the diagonal, "small" below 1% of area, 64 view directions for visibility. I wanted to see how far each verdict slides if you pick a different cut-off, so I re-ran the three ray and component steps with the package's own internal functions at six settings each. Same welded mesh, same 20,000 samples, same seed. Only the threshold changes.
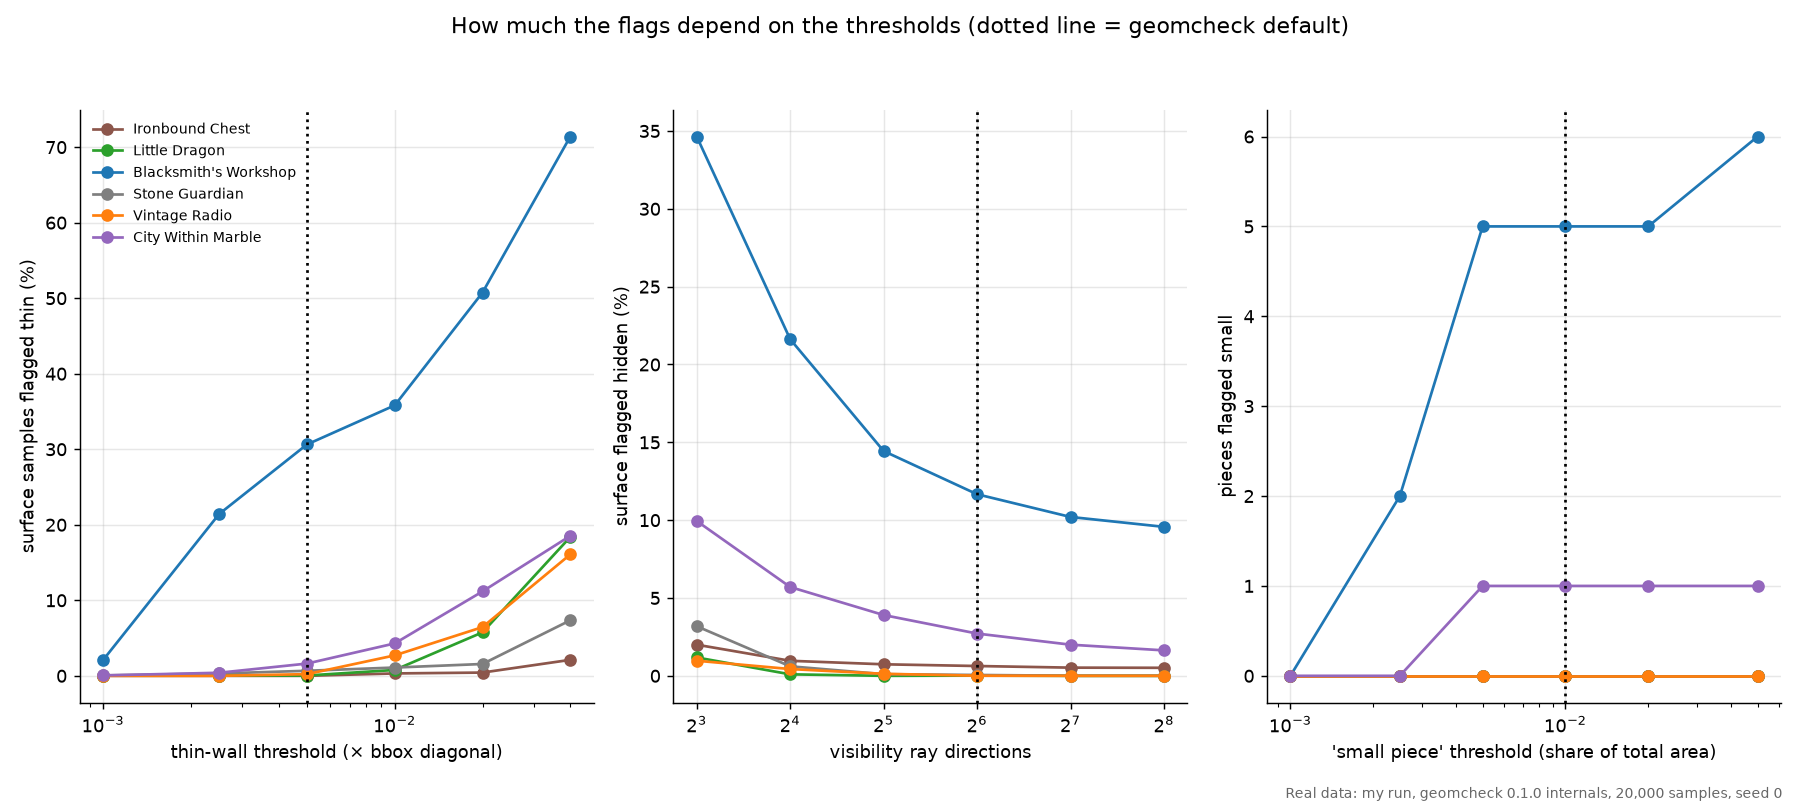
Real data from my sweep. Dotted lines mark the defaults.
Thin-wall threshold. Share of surface samples flagged thin:
| Threshold (× diagonal) | 0.001 | 0.0025 | 0.005 (default) | 0.01 | 0.02 | 0.04 |
|---|---|---|---|---|---|---|
| chest | 0 | 0 | 0 | 0.32% | 0.43% | 2.12% |
| dragon | 0.04% | 0.04% | 0.04% | 0.78% | 5.76% | 18.39% |
| workshop | 2.09% | 21.42% | 30.63% | 35.81% | 50.75% | 71.41% |
| guardian | 0.06% | 0.31% | 0.67% | 1.10% | 1.57% | 7.35% |
| radio | 0 | 0 | 0.22% | 2.71% | 6.45% | 16.08% |
| marble bust | 0.05% | 0.41% | 1.62% | 4.29% | 11.18% | 18.54% |
The workshop jumps from 2% to 21% between 0.001 and 0.0025 of the diagonal. That cliff is the wall plates. Among the samples where the ray found the far side of a wall, the workshop's 25th-percentile thickness is 0.0027 of the diagonal. Scaled to 100 mm on the longest side, the diagonal is 165.5 mm, so that is 0.45 mm. When I later cut the same model with a plane and measured the back wall directly, I got 0.46–0.47 mm. So the probe's number is a real wall, not a sampling artefact.
The other models behave differently. Dragon and radio sit near zero until 0.01 and then climb fast, because they have fins, knobs and grille bars that are thin only at a coarse cut-off. The ordering of the six also changes with the threshold. At the default, the bust (1.62%) is second; at 0.04, the bust, dragon and radio are within half a point of each other (18.54%, 18.39%, 16.08%). If you sort a batch by "thinness", the threshold you pick decides the order.
Ray direction count. Share of surface samples flagged as never visible:
| Directions | 8 | 16 | 32 | 64 (default) | 128 | 256 |
|---|---|---|---|---|---|---|
| chest | 2.00% | 0.97% | 0.74% | 0.63% | 0.53% | 0.52% |
| dragon | 1.18% | 0.10% | 0 | 0.02% | 0 | 0 |
| workshop | 34.65% | 21.63% | 14.44% | 11.67% | 10.21% | 9.57% |
| guardian | 3.19% | 0.61% | 0.11% | 0.06% | 0.01% | 0.01% |
| radio | 0.97% | 0.44% | 0.13% | 0.01% | 0 | 0 |
| marble bust | 9.95% | 5.71% | 3.91% | 2.72% | 2.00% | 1.64% |
A sample counts as hidden when none of the tested directions escapes, so with nested direction sets more directions could only lower the figure. The dragon shows that geomcheck's sets are not nested: 0 at 32 directions, 0.015% at 64, 0 again at 128. The Fibonacci direction sets are generated fresh for each count, so 64 directions are not a superset of 32. A handful of samples in deep crevices escape along one of the 32 directions and none of the 64. Small effect, but it means the curve is not strictly monotonic.
Cost scales with the count, as expected. On the workshop the visibility step took 0.075 s at 8 directions, 0.35 s at 64 and 1.21 s at 256. Going from 64 to 256 directions cuts the workshop's figure by about 2 points for 3.4× the time. The default looks like a fair trade, but do not compare a hidden-surface figure across tools that use different counts.
Small-piece threshold. Count of pieces below the area cut-off:
| Area cut-off | 0.1% | 0.25% | 0.5% | 1% (default) | 2% | 5% |
|---|---|---|---|---|---|---|
| workshop | 0 | 2 | 5 | 5 | 5 | 6 |
| marble bust | 0 | 0 | 1 | 1 | 1 | 1 |
| other four | 0 | 0 | 0 | 0 | 0 | 0 |
This one is the most stable of the three. Between 0.5% and 2% nothing changes. At 5% the anvil (2.32% of the workshop's area) joins the "small" list, which is wrong for anyone treating "small" as "junk". Below 0.5% the bust's tree (0.25%) drops out. Neither threshold separates "buried junk" from "small but wanted". The visibility cross-reference from Log 3 does that, and size alone does not.
Log 6: cross-checking against other tools
A checker you cannot cross-check is a checker you have to trust. I installed four other tools on the same Debian box and ran each on the same six files: Blender 4.3.2 with the 3D-Print Toolbox extension 1.4.1, driven headless with blender --background --python; PyMeshLab's get_topological_measures; ADMesh 0.98.5; and the part count from PrusaSlicer 2.9.2's --info. For Blender I scaled each model to 100 mm and called the toolbox's own check functions from a script, with its default 0.1 mm zero-area threshold and 1 mm thickness.
The first lesson came before any comparison. Run on the file exactly as Blender's glTF importer delivers it, the toolbox reported 47,560–110,048 non-manifold edges, 1,544–9,396 shells and 10,499–22,460 intersecting faces per model. Those are the UV seams again (Log 2's welding note), the same numbers PyMeshLab gives on the raw mesh. After a Merge by Distance at 1e-6 m, the comparison became meaningful:
| Quantity | geomcheck | Blender toolbox (after merge) | PyMeshLab (welded) | ADMesh / PrusaSlicer | Agree? |
|---|---|---|---|---|---|
| Pieces, chest / dragon / workshop / guardian | 1 / 1 / 7 / 1 | 1 / 1 / 7 / 1 | 1 / 1 / 7 / 1 | 1 / 1 / 7 / 1 | yes, all five |
| Pieces, radio / bust | 1 / 2 | 1 / 2 | 1 / 2 | 2 / 4 | STL tools split at non-manifold edges |
| Non-manifold, radio / bust | 1 / 2 edges | 3 / 6 | 4 / 8 | not reported | same models, different counting |
| Non-manifold, other four | 0 | 0 | 0 | not reported | yes |
| Self-intersecting faces (6 models) | 2 / 13 / 7 / 18 / 17 / 61 | 2 / 10 / 7 / 15 / 10 / 34 | not run | not run | same ranking, toolbox lower |
| Degenerate faces | 0–3 | 4,979–34,694 "zero faces" | not run | 0 degenerate | toolbox threshold is absolute |
| Thin, share of faces under 1 mm (toolbox) / of surface under 0.005 diag (geomcheck) | 0 / 0.04 / 30.6 / 0.7 / 0.2 / 1.6% | 0.2 / 0.7 / 33.9 / 3.3 / 18.7 / 11.9% | — | — | workshop yes, radio no |
Where they agree: pieces and the location of the problems. Every tool that welds found the same component counts, and every tool that counts non-manifold edges pointed at the radio and the bust and nothing else. PyMeshLab's count is exactly four times geomcheck's: 4 vs 1 and 8 vs 2. I have not traced Blender's 3 and 6 back to the code, so I will not guess.
Where they disagree, three reasons came out of the data:
- Counting units. For non-manifold edges, geomcheck counts unique edges, while the other tools apparently count something per incident face or per half-edge. The PyMeshLab ratio of exactly 4 hints at that, but it is an inference. Compare "is it zero?" across tools, not the count.
- Absolute vs relative thresholds. The toolbox's degenerate check uses 0.1 mm as the zero threshold. At a 100 mm print size, many perfectly valid small triangles are under that, hence thousands of "zero faces" on meshes where geomcheck and ADMesh found 0–3 real degenerates. Scale the model to 1 m and the toolbox count would drop. geomcheck normalises everything to the diagonal, so it has the opposite problem: its thresholds mean nothing in millimetres until you supply a size.
- Different definitions of "thin". The radio is the clearest case: the toolbox flagged 28,121 faces (18.7%) at 1 mm, geomcheck flagged 0.22% of its surface below 0.69 mm and 2.71% below 1.37 mm. In the toolbox source (
bmesh_check_thick_objectin lib.py), the thickness test casts a ray backwards from points on each face and counts any hit within the distance. geomcheck only counts a hit if the ray leaves through a surface facing away from it, meaning a real exit through the opposite wall. Grille slots and stacked knob details produce near hits that are not walls. I would trust the slicer over either number for print decisions. The workshop, where both agree, really did slice to single-extrusion walls.
What only one tool covered: hidden surface. None of the other four reports never-visible area, so the workshop's 11.67% has no cross-check beyond my own per-component test in Log 3. The toolbox's thickness pass took about 5–6 s per model on its own, roughly 3–4× geomcheck's whole run.
Log 7: runtime vs face count
For batch use the question is how this scales. I decimated each model with geomcheck's own PyMeshLab path to 5k, 10k, 25k, 50k and 100k faces, kept the full ~150k file as the last point, and timed every probe family. One run per point on the same 8-core CPU, so read these as rough.
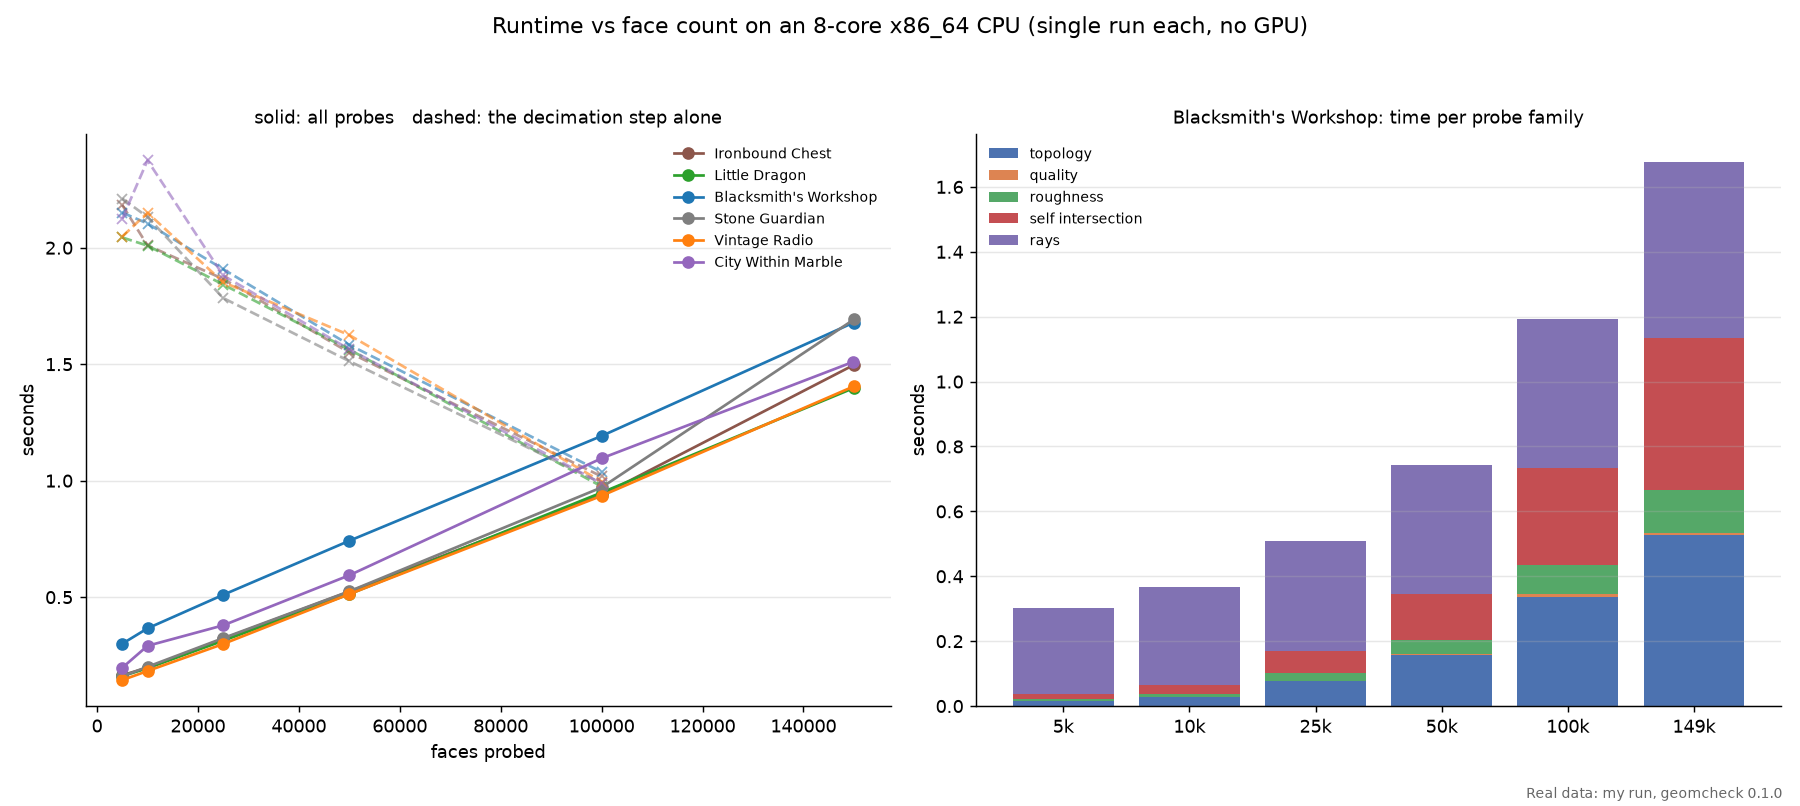
Real timings from my run, geomcheck 0.1.0, CPU only.
| Faces | All probes (range over six models) | Decimation step alone |
|---|---|---|
| 5k | 0.14–0.30 s | 2.04–2.21 s |
| 10k | 0.18–0.37 s | 2.01–2.38 s |
| 25k | 0.30–0.51 s | 1.78–1.91 s |
| 50k | 0.51–0.74 s | 1.51–1.63 s |
| 100k | 0.94–1.19 s | 0.98–1.04 s |
| ~150k (no decimation) | 1.40–1.69 s | 0 |
Two things surprised me.
First, decimating to save time does not save time at this size. Reaching 5k faces costs about 2.1 s, more than probing the full 150k mesh (1.4–1.7 s). Decimation gets slower the further you reduce, presumably because the quadric collapse has more edges to remove. The decimate_to option is there to make results comparable across datasets with very different face counts, which is why the paper used it. It is not a speed knob for files this size.
Second, the per-family split. On the workshop at full resolution, topology took 0.53 s, the ray probes 0.54 s, self-intersection 0.47 s, roughness 0.13 s and triangle quality 0.008 s. Topology and self-intersection grow roughly in line with faces. The ray probes use a fixed 20,000 samples, so their time grows slowly: 0.11–0.27 s at 5k faces and 0.28–0.54 s at full resolution. I assume the growth is Embree building and walking a bigger acceleration structure, but I did not profile it. Extrapolating the straight-ish line, a 1M-face scan would take on the order of ten seconds. That is an extrapolation; I have not run one.
Decimation also changes answers, as Log 4 showed. The full curve for the workshop's self-intersection share: 3.96% at 5k, 1.17% at 10k, 0.204% at 25k, 0.032% at 50k, 0.017% at 100k, 0.005% at full resolution. The bust showed 1.08% at 5k. Hidden and thin shares moved by at most about 3 points (workshop thin 27.8% at 5k vs 30.6% at full; hidden 10.7% vs 11.7%). If you must decimate, self-intersection is the number you can no longer trust.
Known limitations
Collected from the logs above and from reading the code. None of these is hypothetical; each one showed up on these six files or in the source.
- Not on PyPI yet. Install from GitHub (Log 1). The docs'
pip install geomcheckcurrently fails. - No units. Every threshold is a fraction of the bounding-box diagonal. A wall verdict needs a print size you supply yourself, and GLB to STL conversion often drops scale.
- Thresholds via a global dict. Changing
CONFIGchanges it for everything in the process. Fine for scripts, awkward for a service that checks files with different settings in parallel. - No locations in the summary.
compute_allreturns fractions and counts. To find where the radio's bad edge is, I wrote my own edge listing (Log 3).geomcheck.visualize.face_flagsgives per-face flags for rays, components and boundaries, but not for non-manifold edges. - Visibility directions are not nested. Hidden share is not strictly monotonic in the direction count (the dragon in Log 5).
- Size cannot tell junk from detail. The bust's tree and the workshop's buried pads are both "small". Only the visibility cross-reference separates them, and that is not built into the summary.
- Self-intersection is resolution-sensitive once you decimate (Log 7).
- Geometry only. No textures, UVs, materials, rigging or prompt fidelity. The glTF-Validator and a human look still have jobs.
- CPU only, single process. Fine at 1.5 s per file; a large batch needs your own parallelism.
- Tested here on one generator. All six models came from Modelfy, so this log says nothing about how other generators' meshes behave.
Roadmap (what I would like to add, no dates)
These are directions, not commitments, roughly in the order the logs above made me want them:
- Publish the package to PyPI so the documented install command works.
- An optional
scale_mmargument, so thin-wall output can be reported in millimetres at a given print size. - Per-edge and per-face location output for non-manifold edges and self-intersections, so a report can say where, not just how many.
- A "buried piece" flag that combines the component and visibility probes, which is the check that separated the workshop's pads from the bust's tree.
- Nested direction sets for the visibility probe, so more directions can never raise the hidden share.
- Passing thresholds as function arguments instead of a global dict.
- A command-line entry point that prints the table from Log 2 and writes JSON.
If you try it on your own meshes and something disagrees with another tool, an issue on the repository with the file and both outputs is the most useful thing you can send.
What it can't measure
The probes come from my paper, Geometric validity is not perceptual quality: what deterministic probes can and cannot measure in generated 3D assets (doi:10.5281/zenodo.22995915). The parts that matter for anyone using geomcheck as a checker:
- On defects injected into real scans, holes and floaters were detected perfectly (AUROC 1.000), crossing sheets at 0.940–0.986, hidden shells at 0.811–0.912.
- Against expert defect labels, a classifier on the 30 probe features reached a Matthews correlation of 0.272, against 0.335–0.341 for the best vision-language judges. None of the paired tests against the four strongest judges was significant.
- Correlation with human geometry ratings within each generator was |r| ≤ 0.2.
So: it is a gate (is this file printable, riggable, exportable?), not a score. It ignores textures, materials and whether the model matches its prompt. A perfect-looking result like the dragon tells you the geometry is clean, not that the dragon is good.

Illustration, not test output: the probes see defects in the lens. Whether the model looks good is a separate judgment.
How this was tested
- Who: Miles Carter. I wrote geomcheck and I work on modelfy.art. The six models are Modelfy outputs (backend: Tencent Hunyuan 3D), so this is not an independent benchmark, and no other generator was tested.
- What: geomcheck 0.1.0 with default settings (weld at 1e-6 of the diagonal, "small" below 1% of area, 20,000 surface samples, 64 view directions, seed 0) on six ~150k-triangle GLBs, plus
decimate_toruns. The threshold sweep re-uses geomcheck's internal functions with one cut-off changed at a time. Per-face flags, renders and component checks usegeomcheck.visualizeand a few lines of my own NumPy. - Other tools: Blender 4.3.2 + 3D-Print Toolbox 1.4.1 (downloaded from extensions.blender.org, run headless, random seed fixed for its thickness sampling), PyMeshLab 2025.7.post1, ADMesh 0.98.5, PrusaSlicer 2.9.2 (
--infoonly for this log). - Where: one 8-core x86_64 Linux machine, CPU only, Python 3.13.5. Timings are single runs.
- Not tested: real prints, engine import, other generators, meshes above 150k faces.
- Raw data: JSON and logs for every number on this page are kept with the run.
- AI use: I had an AI assistant execute the scripts and write a first draft of this log, then compared each figure with the saved JSON. The single line sketch is AI-made and marked as such. Every other picture is a render or chart produced by these runs.
Links
- Source (MIT): https://github.com/Stark-Will/geometric-probes-3d
- Docs: https://geomcheck.readthedocs.io/en/latest/
- Project site: https://stark-will.github.io/geometric-probes-3d/
- Paper (Zenodo): https://doi.org/10.5281/zenodo.22995915
- Blender 3D-Print Toolbox: https://extensions.blender.org/add-ons/print3d-toolbox/
- If you want to look at a mesh before probing it, the Modelfy 3D viewer opens GLB, OBJ, STL, FBX, STEP and other formats locally in the browser. The test models came from Modelfy.